
Markets in a Minute
Visualizing Every Company on the S&P 500 Index
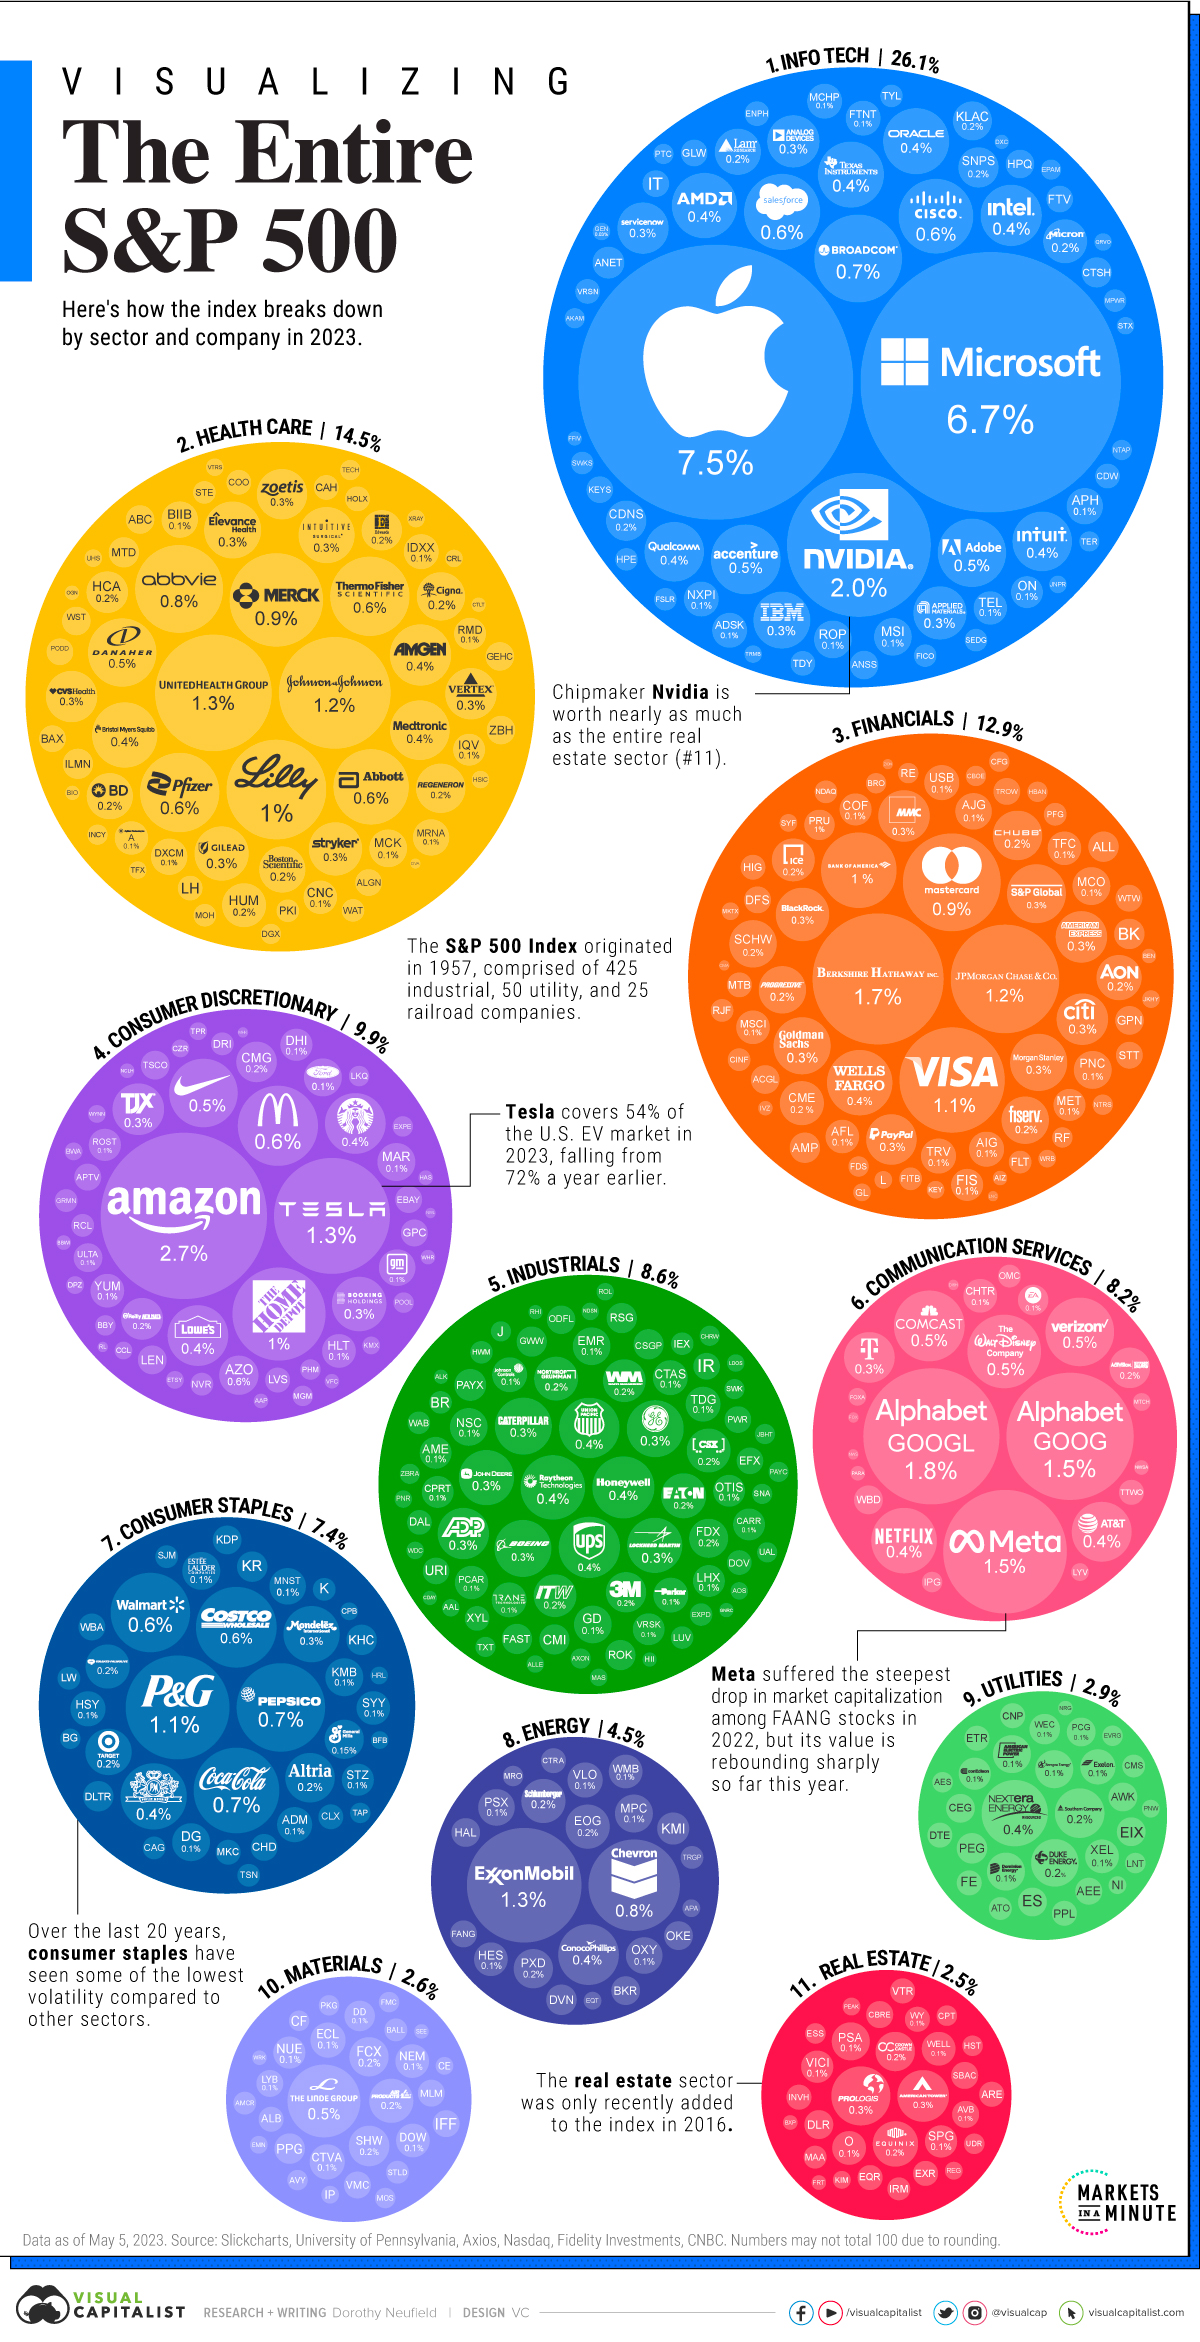
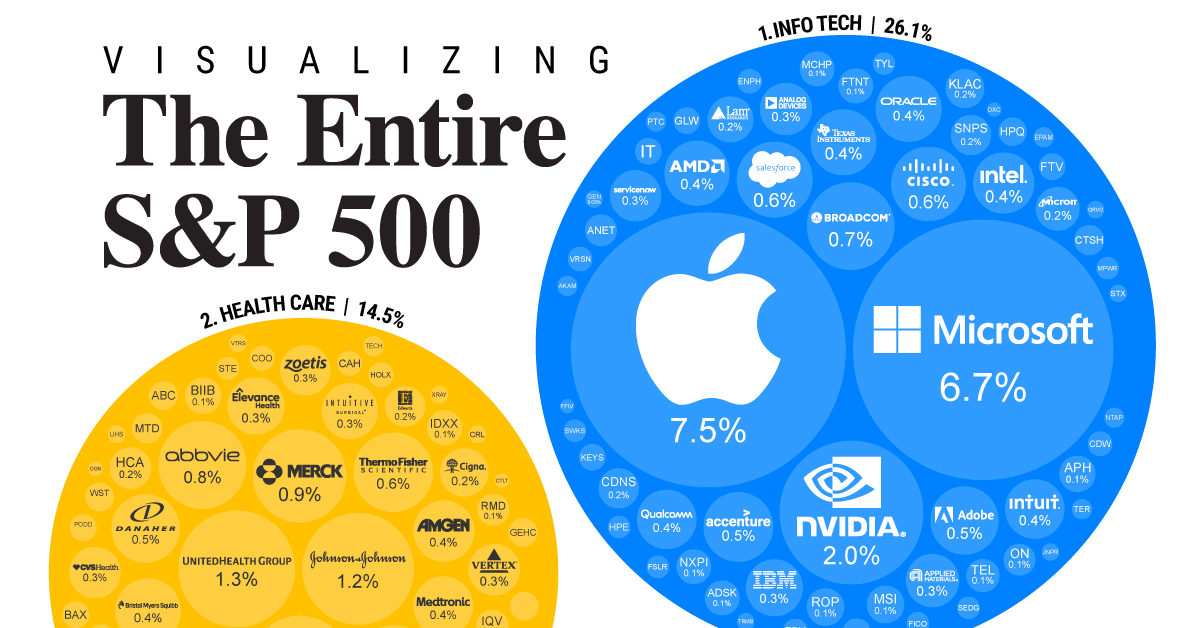
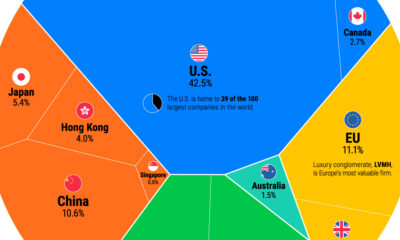
S&P 500 Companies: A Complete Visual Breakdown
S&P 500 companies hold $7.1 trillion in assets, and account for close to 80% of available market capitalization on U.S. stock exchanges.
The index serves as a barometer for the U.S. stock market, covering the largest public U.S. companies by market capitalization. Often, it reflects investor sentiment and is considered an indicator for U.S. economic health.
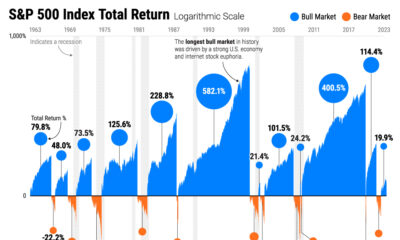
As the S&P 500 enters a bull market after the longest downturn in decades, the above graphic shows the entire makeup of one of the world’s largest markets.
Top S&P 500 Companies, by Weight
Here are the 100 biggest companies on the S&P 500 by sector and weight, using data from Slickcharts. Data is as of May 5, 2023.
| Rank, by Weight | Name | Sector | Weight (%) |
|---|---|---|---|
| 1 | Apple | Info Tech | 7.46 |
| 2 | Microsoft | Info Tech | 6.69 |
| 3 | Amazon | Consumer Discretionary | 2.72 |
| 4 | NVIDIA | Info Tech | 2.04 |
| 5 | Alphabet (Class A) | Communication Services | 1.82 |
| 6 | Berkshire Hathaway | Financials | 1.69 |
| 7 | Alphabet (Class C) | Communication Services | 1.59 |
| 8 | Meta | Communication Services | 1.50 |
| 9 | UnitedHealth Group | Health Care | 1.34 |
| 10 | Tesla | Consumer Discretionary | 1.32 |
| 11 | Exxon Mobil | Energy | 1.29 |
| 12 | Johnson & Johnson | Health Care | 1.23 |
| 13 | JPMorgan | Financials | 1.16 |
| 14 | Visa | Financials | 1.09 |
| 15 | Procter & Gamble | Consumer Staples | 1.06 |
| 16 | Eli Lilly | Health Care | 0.98 |
| 17 | Mastercard | Financials | 0.94 |
| 18 | Merck & Co. | Health Care | 0.86 |
| 19 | Home Depot | Consumer Discretionary | 0.85 |
| 20 | Chevron | Energy | 0.82 |
| 21 | PepsiCo | Consumer Staples | 0.77 |
| 22 | Broadcom | Info Tech | 0.76 |
| 23 | AbbVie | Health Care | 0.76 |
| 24 | Coca-Cola | Consumer Staples | 0.72 |
| 25 | Costco | Consumer Staples | 0.64 |
| 26 | McDonald's | Consumer Discretionary | 0.63 |
| 27 | Pfizer | Health Care | 0.62 |
| 28 | Thermo Fisher Scientific | Health Care | 0.62 |
| 29 | Walmart | Consumer Staples | 0.62 |
| 30 | Salesforce | Info Tech | 0.57 |
| 31 | Abbott Laboratories | Health Care | 0.56 |
| 32 | Bank of America | Financials | 0.56 |
| 33 | Cisco Systems | Info Tech | 0.55 |
| 34 | Walt Disney | Communication Services | 0.53 |
| 35 | Linde | Materials | 0.52 |
| 36 | Comcast | Communication Services | 0.49 |
| 37 | Accenture | Info Tech | 0.48 |
| 38 | Adobe | Info Tech | 0.46 |
| 39 | Danaher | Health Care | 0.46 |
| 40 | Verizon Communications | Communication Services | 0.46 |
| 41 | NIKE | Consumer Discretionary | 0.46 |
| 42 | Texas Instruments | Info Tech | 0.43 |
| 43 | NextEra Energy | Utilities | 0.43 |
| 44 | Oracle | Info Tech | 0.43 |
| 45 | Philip Morris | Consumer Staples | 0.43 |
| 46 | Bristol-Myers Squibb | Health Care | 0.42 |
| 47 | Advanced Micro Devices | Info Tech | 0.42 |
| 48 | Wells Fargo | Financials | 0.42 |
| 49 | Netflix | Communication Services | 0.42 |
| 50 | Raytheon Technologies | Industrials | 0.41 |
| 51 | Honeywell International | Industrials | 0.38 |
| 52 | United Parcel Service | Industrials | 0.37 |
| 53 | Intel | Info Tech | 0.37 |
| 54 | Amgen | Health Care | 0.37 |
| 55 | Lowe's | Consumer Discretionary | 0.36 |
| 56 | Starbucks | Consumer Discretionary | 0.36 |
| 57 | Union Pacific | Industrials | 0.36 |
| 58 | ConocoPhillips | Energy | 0.36 |
| 59 | AT&T | Communication Services | 0.35 |
| 60 | QUALCOMM | Info Tech | 0.35 |
| 61 | Intuit | Info Tech | 0.35 |
| 62 | Medtronic | Health Care | 0.35 |
| 63 | Prologis | Real Estate | 0.34 |
| 64 | S&P Global | Financials | 0.34 |
| 65 | Caterpillar | Industrials | 0.32 |
| 66 | IBM | Info Tech | 0.32 |
| 67 | Boeing | Industrials | 0.32 |
| 68 | Elevance Health | Health Care | 0.32 |
| 69 | Morgan Stanley | Financials | 0.32 |
| 70 | Goldman Sachs | Financials | 0.32 |
| 71 | General Electric | Industrials | 0.32 |
| 72 | Intuitive Surgical | Health Care | 0.31 |
| 73 | Mondelez International | Consumer Staples | 0.31 |
| 74 | Lockheed Martin | Industrials | 0.30 |
| 75 | Deere & Company | Industrials | 0.30 |
| 76 | Booking Holdings | Consumer Discretionary | 0.29 |
| 77 | Gilead Sciences | Health Care | 0.29 |
| 78 | Applied Materials | Info Tech | 0.28 |
| 79 | BlackRock | Financials | 0.28 |
| 80 | Stryker | Health Care | 0.28 |
| 81 | Analog Devices | Info Tech | 0.27 |
| 82 | American Tower | Real Estate | 0.26 |
| 83 | American Express | Financials | 0.26 |
| 84 | CVS | Health Care | 0.26 |
| 85 | TJX | Consumer Discretionary | 0.26 |
| 86 | Citigroup | Financials | 0.26 |
| 87 | Vertex Pharmaceuticals | Health Care | 0.26 |
| 88 | Automatic Data Processing | Industrials | 0.26 |
| 89 | Marsh & McLennan | Financials | 0.26 |
| 90 | ServiceNow | Info Tech | 0.26 |
| 91 | Zoetis | Health Care | 0.25 |
| 92 | T-Mobile U.S. | Communication Services | 0.25 |
| 93 | PayPal | Financials | 0.25 |
| 94 | Altria Group | Consumer Staples | 0.24 |
| 95 | Chubb | Financials | 0.24 |
| 96 | Regeneron Pharmaceuticals | Health Care | 0.24 |
| 97 | Southern Company | Utilities | 0.24 |
| 98 | Cigna | Health Care | 0.23 |
| 99 | Duke Energy | Utilities | 0.22 |
| 100 | Fiserv | Financials | 0.22 |
Over the last decade, big tech names have dominated the index.
The tech sector makes up over 26%, with Apple, Microsoft, and Nvidia as the top S&P 500 companies by market capitalization. Despite interest rates climbing at warp speed, a select number of big tech names have maintained, or even expanded their influence on the index over the last year.
In many cases, investor demand for AI-related stocks has fueled these increases.
Amazon is the third-largest company in the index. While shares tumbled in 2022 amid slowing sales, they have since rebounded by about 46% this year. Like Amazon, consumer discretionary firm Tesla has seen a strong reversal as the index’s 10th biggest stock by weight.
In the financial sector, Berkshire Hathaway has the highest weight (1.7%) while UnitedHealth Group (1.3%) is the top in health care. The health conglomerate even towers above JP Morgan Chase, the biggest bank in America.
S&P 500 Sectors and the Market Cycle
Below, we show the 11 sectors in the S&P 500, organized by weight and their typical performance over the business cycle:
- Cyclical: Rise and fall with the market cycle, often correlated to expansions or contractions
- Defensive: Typically are negatively correlated to the market cycle, with more stable earnings and dividends
| Sector | Weight | Type |
|---|---|---|
| Information Technology | 26.1% | Cyclical |
| Health Care | 14.5% | Defensive |
| Financials | 12.9% | Cyclical |
| Consumer Discretionary | 9.9% | Cyclical |
| Industrials | 8.6% | Cyclical |
| Communication Services | 8.2% | Cyclical |
| Consumer Staples | 7.4% | Defensive |
| Energy | 4.5% | Defensive |
| Utilities | 2.9% | Defensive |
| Materials | 2.6% | Cyclical |
| Real Estate | 2.5% | Cyclical |
Numbers may not total 100 due to rounding.
Information technology, health care, and financials have the highest share in the S&P 500. Together, they cover over half the index.
S&P 500 Companies: Mixed Signals in 2023
In many ways there are two major themes playing out this year so far for U.S. equities, which is the best-performing asset class year to date.
First is that seven big tech companies—Apple, Microsoft, Nvidia, Google, Tesla, Meta, and Amazon—are driving virtually all of the index’s gains. These companies have seen double or triple-digit returns this year so far. As of May 31, tech sector ETFs saw $8 billion in inflows to date, the highest across any sector.
Secondly, the energy and health care sectors have seen the highest outflows, at $9 billion and $4 billion, respectively.
Even with interest rates hitting 15-year highs, extreme greed is in the market, based on the Fear and Greed Index. This may signal higher risk in the S&P 500, since a hit to these few companies with high weightings could significantly affect the broader index.


Markets in a Minute
The Top 5 Reasons Clients Fire a Financial Advisor
Firing an advisor is often driven by more than cost and performance factors. Here are the top reasons clients ‘break up’ with their advisors.

The Top 5 Reasons Clients Fire a Financial Advisor
What drives investors to fire a financial advisor?
From saving for a down payment to planning for retirement, clients turn to advisors to guide them through life’s complex financial decisions. However, many of the key reasons for firing a financial advisor stem from emotional factors, and go beyond purely financial motivations.
We partnered with Morningstar to show the top reasons clients fire an advisor to provide insight on what’s driving investor behavior.
What Drives Firing Decisions?
Here are the top reasons clients terminated their advisor, based on a survey of 184 respondents:
| Reason for Firing | % of Respondents Citing This Reason | Type of Motivation |
|---|---|---|
| Quality of financial advice and services | 32% | Emotion-based reason |
| Quality of relationship | 21% | Emotion-based reason |
| Cost of services | 17% | Financial-based reason |
| Return performance | 11% | Financial-based reason |
| Comfort handling financial issues on their own | 10% | Emotion-based reason |
Numbers may not total 100 due to rounding. Respondents could select more than one answer.
Numbers may not total 100 due to rounding. Respondents could select more than one answer.
While firing an advisor is rare, many of the primary drivers behind firing decisions are also emotionally driven.
Often, advisors were fired due to the quality of the relationship. In many cases, this was due to an advisor not dedicating enough time to fully grasp their personal financial goals. Additionally, wealthier, and more financially literate clients are more likely to fire their advisors—highlighting the importance of understanding the client.
Key Takeaways
Given these driving factors, here are five ways that advisors can build a lasting relationship through recognizing their clients’ emotional needs:
- Understand your clients’ deeper goals
- Reach out proactively
- Act as a financial coach
- Keep clients updated
- Conduct goal-setting exercises on a regular basis
By communicating their value and setting expectations early, advisors can help prevent setbacks in their practice by adeptly recognizing the emotional motivators of their clients.
Markets in a Minute
The Top 5 Reasons Clients Hire a Financial Advisor
Here are the most common drivers for hiring a financial advisor, revealing that investor motivations go beyond just financial factors.

The Top 5 Reasons Clients Hire a Financial Advisor
What drives investors to hire a financial advisor?
From saving for a down payment to planning for retirement, clients turn to advisors to guide them through life’s complex financial decisions. However, many of the key reasons for hiring a financial advisor stem from emotional factors, and go beyond purely financial motivations.
We partnered with Morningstar to show the top reasons clients hire a financial advisor to provide insight on what’s driving investor behavior.
What Drives Hiring Decisions?
Here are the most common reasons for hiring an advisor, based on a survey of 312 respondents.
| Reason for Hiring | % of Respondents Citing This Reason | Type of Motivation |
|---|---|---|
| Specific goals or needs | 32% | Financial-based reason |
| Discomfort handling finances | 32% | Emotion-based reason |
| Behavioral coaching | 17% | Emotion-based reason |
| Recommended by family or friends | 12% | Emotion-based reason |
| Quality of relationship | 10% | Emotion-based reason |
Numbers may not total 100 due to rounding. Respondents could select more than one answer.
While financial factors played an important role in hiring decisions, emotional reasons made up the largest share of total responses.
This illustrates that clients place a high degree of importance on reaching specific goals or needs, and how an advisor communicates with them. Furthermore, clients seek out advisors for behavioral coaching to help them make informed decisions while staying the course.
Key Takeaways
With this in mind, here are five ways advisors can provide value to their clients and grow their practice:
- Address clients’ emotional needs early on
- Demonstrate how you can offer support
- Use ordinary language
- Provide education to help clients stay on track
- Acknowledge that these are issues we all face
By addressing emotional factors, advisors can more effectively help clients’ navigate intricate financial decisions and avoid common behavioral mistakes.

The Top 5 Reasons Clients Fire a Financial Advisor

The Top 5 Reasons Clients Hire a Financial Advisor

Visualizing the Growth of $100, by Asset Class

How Small Investments Make a Big Impact Over Time

What Were the Top Performing Investment Themes of 2023?
-

 Infographics2 years ago
The Top Investment Quotes Every Investor Should Know
-

 Markets in a Minute2 years ago
Mapped: The Growth in U.S. House Prices by State
-

 Markets in a Minute2 years ago
How Closely Related Are Historical Mortgage Rates and Housing Prices?
-

 Infographics2 years ago
A Visual Guide to Stagflation, Inflation, and Deflation
-

 Markets in a Minute1 year ago
Mapped: Global Energy Prices, by Country in 2022
-

 Markets in a Minute2 years ago
Visualizing Historical Oil Prices (1968-2022)
-

 Infographics1 year ago
Visual Guide: The Three Types of Economic Indicators
-

 Markets in a Minute2 years ago
Mapped: Global Macroeconomic Risk, by Country in 2022
