
Markets in a Minute
Mapped: The Growth in House Prices by Country
The following slider shows both nominal and real housing prices by country. Use slider arrows to navigate.

Mapped: The Growth in House Prices by Country
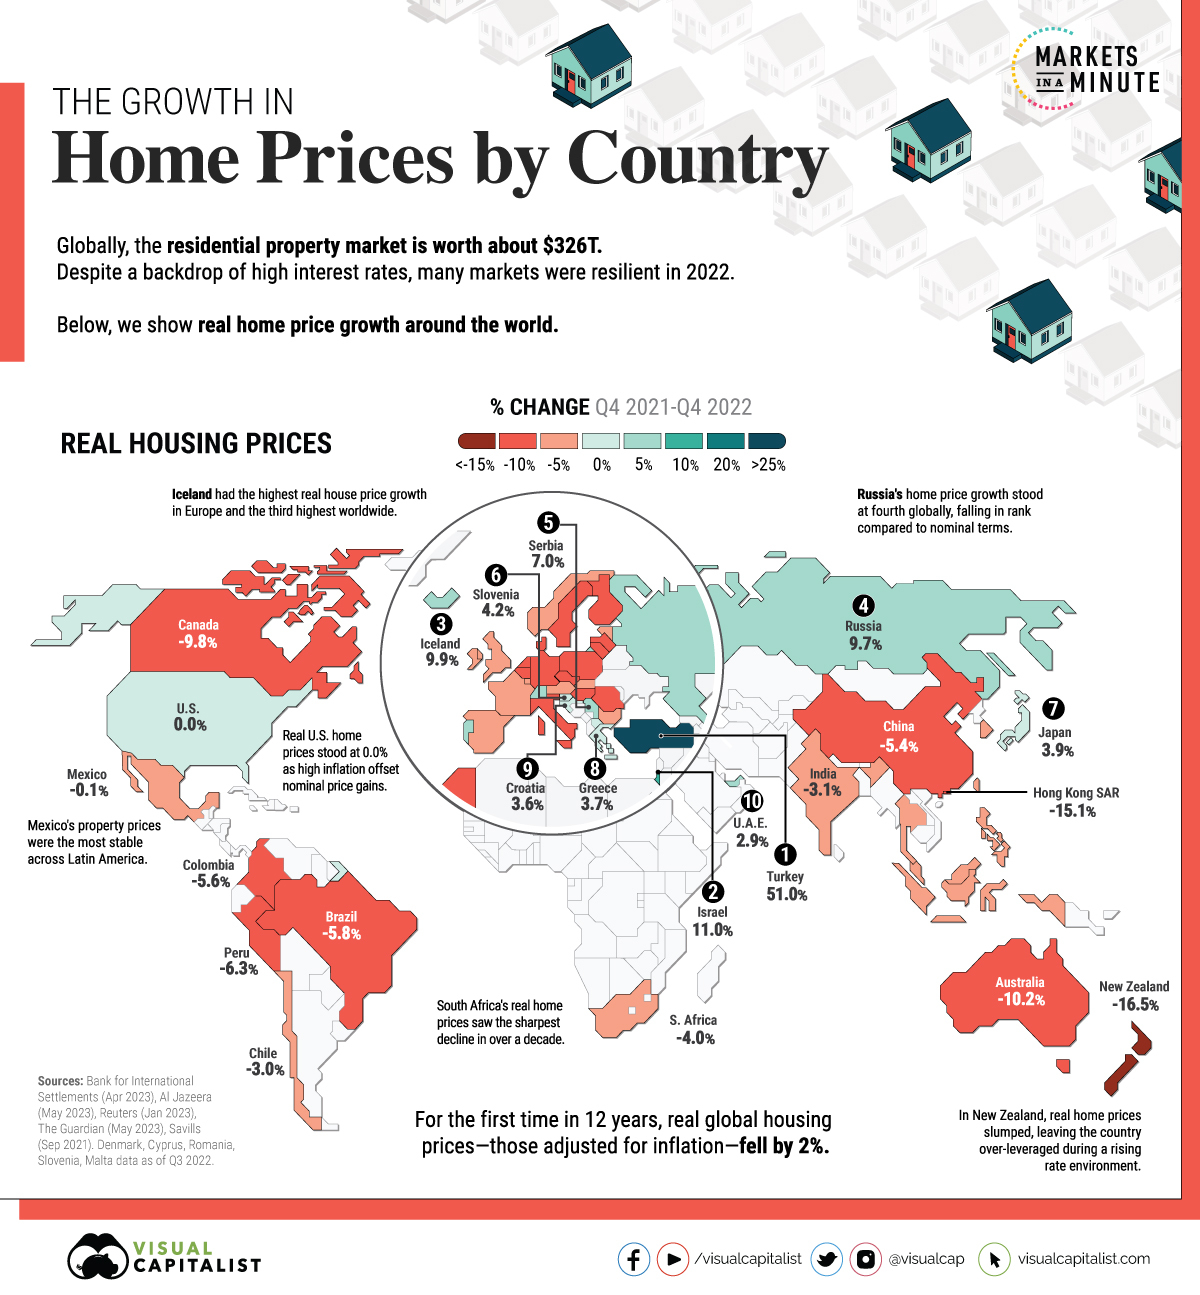
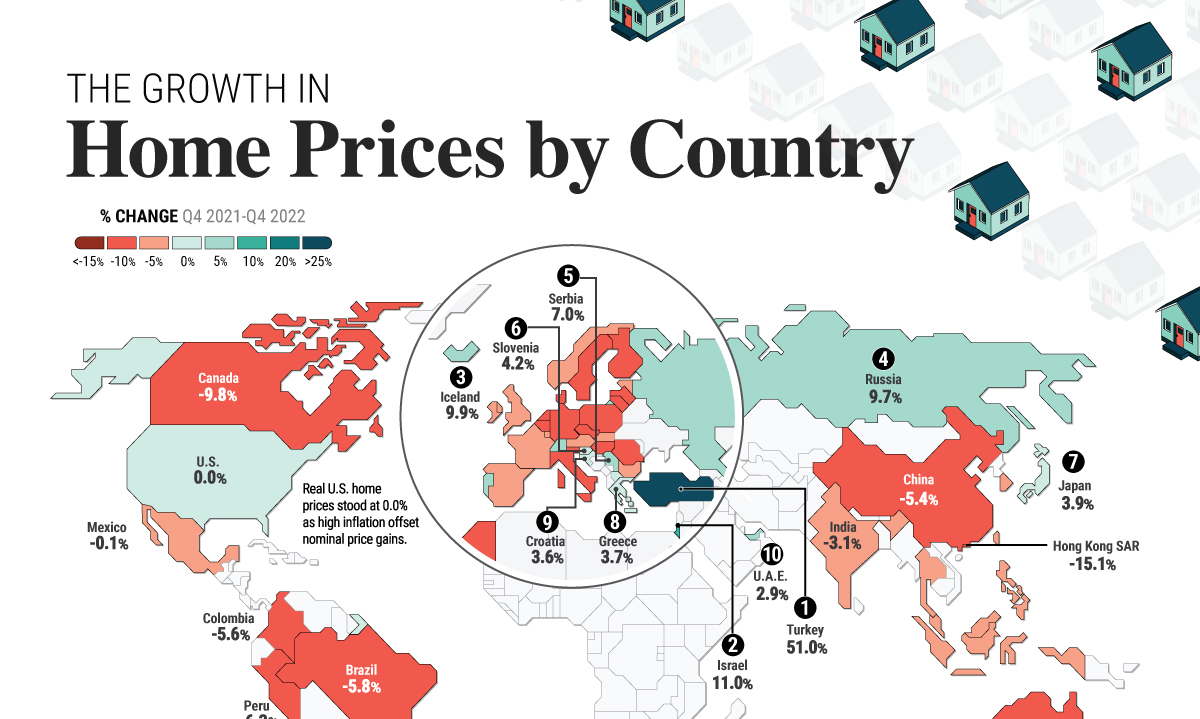
Global housing prices rose an average of 6% annually, between Q4 2021 and Q4 2022.
In real terms that take inflation into account, prices actually fell 2% for the first decline in 12 years. Despite a surge in interest rates and mortgage costs, housing markets were noticeably stable. Real prices remain 7% above pre-pandemic levels.
In this graphic, we show the change in residential property prices with data from the Bank for International Settlements (BIS).
The Growth in House Prices, Ranked
The following dataset from the BIS covers nominal and real house price growth across 58 countries and regions as of the fourth quarter of 2022:
| Price Growth Rank | Country / Region | Nominal Year-over-Year Change (%) | Real Year-over-Year Change (%) |
|---|---|---|---|
| 1 | 🇹🇷 Türkiye | 167.9 | 51.0 |
| 2 | 🇷🇸 Serbia | 23.1 | 7.0 |
| 3 | 🇷🇺 Russia | 23.1 | 9.7 |
| 4 | 🇲🇰 North Macedonia | 20.6 | 1.0 |
| 5 | 🇮🇸 Iceland | 20.3 | 9.9 |
| 6 | 🇭🇷 Croatia | 17.3 | 3.6 |
| 7 | 🇪🇪 Estonia | 16.9 | -3.0 |
| 8 | 🇮🇱 Israel | 16.8 | 11.0 |
| 9 | 🇭🇺 Hungary | 16.5 | -5.1 |
| 10 | 🇱🇹 Lithuania | 16.0 | -5.5 |
| 11 | 🇸🇮 Slovenia | 15.4 | 4.2 |
| 12 | 🇧🇬 Bulgaria | 13.4 | -3.2 |
| 13 | 🇬🇷 Greece | 12.2 | 3.7 |
| 14 | 🇵🇹 Portugal | 11.3 | 1.3 |
| 15 | 🇬🇧 United Kingdom | 10.0 | -0.7 |
| 16 | 🇸🇰 Slovak Republic | 9.7 | -4.8 |
| 17 | 🇦🇪 United Arab Emirates | 9.6 | 2.9 |
| 18 | 🇵🇱 Poland | 9.3 | -6.9 |
| 19 | 🇱🇻 Latvia | 9.1 | -10.2 |
| 20 | 🇸🇬 Singapore | 8.6 | 1.9 |
| 21 | 🇮🇪 Ireland | 8.6 | -0.2 |
| 22 | 🇨🇱 Chile | 8.2 | -3.0 |
| 23 | 🇯🇵 Japan | 7.9 | 3.9 |
| 24 | 🇲🇽 Mexico | 7.9 | -0.1 |
| 25 | 🇵🇭 Philippines | 7.7 | -0.2 |
| 26 | 🇺🇸 United States | 7.1 | 0.0 |
| 27 | 🇨🇿 Czechia | 6.9 | -7.6 |
| 28 | 🇷🇴 Romania | 6.7 | -7.5 |
| 29 | 🇲🇹 Malta | 6.3 | -0.7 |
| 30 | 🇨🇾 Cyprus | 6.3 | -2.9 |
| 31 | 🇨🇴 Colombia | 6.3 | -5.6 |
| 32 | 🇱🇺 Luxembourg | 5.6 | -0.5 |
| 33 | 🇪🇸 Spain | 5.5 | -1.1 |
| 34 | 🇨🇭 Switzerland | 5.4 | 2.4 |
| 35 | 🇳🇱 Netherlands | 5.4 | -5.3 |
| 36 | 🇦🇹 Austria | 5.2 | -4.8 |
| 37 | 🇫🇷 France | 4.8 | -1.2 |
| 38 | 🇧🇪 Belgium | 4.7 | -5.7 |
| 39 | 🇹🇭 Thailand | 4.7 | -1.1 |
| 40 | 🇿🇦 South Africa | 3.1 | -4.0 |
| 41 | 🇮🇳 India | 2.8 | -3.1 |
| 42 | 🇮🇹 Italy | 2.8 | -8.0 |
| 43 | 🇳🇴 Norway | 2.6 | -3.8 |
| 44 | 🇮🇩 Indonesia | 2.0 | -3.4 |
| 45 | 🇵🇪 Peru | 1.5 | -6.3 |
| 46 | 🇲🇾 Malaysia | 1.2 | -2.6 |
| 47 | 🇰🇷 South Korea | -0.1 | -5.0 |
| 48 | 🇲🇦 Morocco | -0.1 | -7.7 |
| 49 | 🇧🇷 Brazil | -0.1 | -5.8 |
| 50 | 🇫🇮 Finland | -2.3 | -10.2 |
| 51 | 🇩🇰 Denmark | -2.4 | -10.6 |
| 52 | 🇦🇺 Australia | -3.2 | -10.2 |
| 53 | 🇩🇪 Germany | -3.6 | -12.1 |
| 54 | 🇸🇪 Sweden | -3.7 | -13.7 |
| 55 | 🇨🇳 China | -3.7 | -5.4 |
| 56 | 🇨🇦 Canada | -3.8 | -9.8 |
| 57 | 🇳🇿 New Zealand | -10.4 | -16.5 |
| 58 | 🇭🇰 Hong Kong SAR | -13.5 | -15.1 |
Türkiye’s property prices jumped the highest globally, at nearly 168% amid soaring inflation.
Real estate demand has increased alongside declining interest rates. The government drastically cut interest rates from 19% in late 2021 to 8.5% to support a weakening economy.
Many European countries saw some of the highest price growth in nominal terms. A strong labor market and low interest rates pushed up prices, even as mortgage rates broadly doubled across the continent. For real price growth, most countries were in negative territory—notably Sweden, Germany, and Denmark.
Nominal U.S. housing prices grew just over 7%, while real price growth halted to 0%. Prices have remained elevated given the stubbornly low supply of inventory. In fact, residential prices remain 45% above pre-pandemic levels.
How Do Interest Rates Impact Property Markets?
Global house prices boomed during the pandemic as central banks cut interest rates to prop up economies.
Now, rates have returned to levels last seen before the Global Financial Crisis. On average, rates have increased four percentage points in many major economies. Roughly three-quarters of the countries in the BIS dataset witnessed negative year-over-year real house price growth as of the fourth quarter of 2022.
Interest rates have a large impact on property prices. Cross-country evidence shows that for every one percentage point increase in real interest rates, the growth rate of housing prices tends to fall by about two percentage points.
When Will Housing Prices Fall?
The rise in U.S. interest rates has been counteracted by homeowners being reluctant to sell so they can keep their low mortgage rates. As a result, it is keeping inventory low and prices high. Homeowners can’t sell and keep their low mortgage rates unless they meet strict conditions on a new property.
Additionally, several other factors impact price dynamics. Construction costs, income growth, labor shortages, and population growth all play a role.
With a strong labor market continuing through 2023, stable incomes may help stave off prices from falling. On the other hand, buyers with floating-rate mortgages face steeper costs and may be unable to afford new rates. This could increase housing supply in the market, potentially leading to lower prices.


Markets in a Minute
The Top 5 Reasons Clients Fire a Financial Advisor
Firing an advisor is often driven by more than cost and performance factors. Here are the top reasons clients ‘break up’ with their advisors.

The Top 5 Reasons Clients Fire a Financial Advisor
What drives investors to fire a financial advisor?
From saving for a down payment to planning for retirement, clients turn to advisors to guide them through life’s complex financial decisions. However, many of the key reasons for firing a financial advisor stem from emotional factors, and go beyond purely financial motivations.
We partnered with Morningstar to show the top reasons clients fire an advisor to provide insight on what’s driving investor behavior.
What Drives Firing Decisions?
Here are the top reasons clients terminated their advisor, based on a survey of 184 respondents:
| Reason for Firing | % of Respondents Citing This Reason | Type of Motivation |
|---|---|---|
| Quality of financial advice and services | 32% | Emotion-based reason |
| Quality of relationship | 21% | Emotion-based reason |
| Cost of services | 17% | Financial-based reason |
| Return performance | 11% | Financial-based reason |
| Comfort handling financial issues on their own | 10% | Emotion-based reason |
Numbers may not total 100 due to rounding. Respondents could select more than one answer.
Numbers may not total 100 due to rounding. Respondents could select more than one answer.
While firing an advisor is rare, many of the primary drivers behind firing decisions are also emotionally driven.
Often, advisors were fired due to the quality of the relationship. In many cases, this was due to an advisor not dedicating enough time to fully grasp their personal financial goals. Additionally, wealthier, and more financially literate clients are more likely to fire their advisors—highlighting the importance of understanding the client.
Key Takeaways
Given these driving factors, here are five ways that advisors can build a lasting relationship through recognizing their clients’ emotional needs:
- Understand your clients’ deeper goals
- Reach out proactively
- Act as a financial coach
- Keep clients updated
- Conduct goal-setting exercises on a regular basis
By communicating their value and setting expectations early, advisors can help prevent setbacks in their practice by adeptly recognizing the emotional motivators of their clients.
Markets in a Minute
The Top 5 Reasons Clients Hire a Financial Advisor
Here are the most common drivers for hiring a financial advisor, revealing that investor motivations go beyond just financial factors.

The Top 5 Reasons Clients Hire a Financial Advisor
What drives investors to hire a financial advisor?
From saving for a down payment to planning for retirement, clients turn to advisors to guide them through life’s complex financial decisions. However, many of the key reasons for hiring a financial advisor stem from emotional factors, and go beyond purely financial motivations.
We partnered with Morningstar to show the top reasons clients hire a financial advisor to provide insight on what’s driving investor behavior.
What Drives Hiring Decisions?
Here are the most common reasons for hiring an advisor, based on a survey of 312 respondents.
| Reason for Hiring | % of Respondents Citing This Reason | Type of Motivation |
|---|---|---|
| Specific goals or needs | 32% | Financial-based reason |
| Discomfort handling finances | 32% | Emotion-based reason |
| Behavioral coaching | 17% | Emotion-based reason |
| Recommended by family or friends | 12% | Emotion-based reason |
| Quality of relationship | 10% | Emotion-based reason |
Numbers may not total 100 due to rounding. Respondents could select more than one answer.
While financial factors played an important role in hiring decisions, emotional reasons made up the largest share of total responses.
This illustrates that clients place a high degree of importance on reaching specific goals or needs, and how an advisor communicates with them. Furthermore, clients seek out advisors for behavioral coaching to help them make informed decisions while staying the course.
Key Takeaways
With this in mind, here are five ways advisors can provide value to their clients and grow their practice:
- Address clients’ emotional needs early on
- Demonstrate how you can offer support
- Use ordinary language
- Provide education to help clients stay on track
- Acknowledge that these are issues we all face
By addressing emotional factors, advisors can more effectively help clients’ navigate intricate financial decisions and avoid common behavioral mistakes.

The Top 5 Reasons Clients Fire a Financial Advisor

The Top 5 Reasons Clients Hire a Financial Advisor

Visualizing the Growth of $100, by Asset Class

How Small Investments Make a Big Impact Over Time

What Were the Top Performing Investment Themes of 2023?
-

 Infographics2 years ago
The Top Investment Quotes Every Investor Should Know
-

 Markets in a Minute2 years ago
Mapped: The Growth in U.S. House Prices by State
-

 Markets in a Minute2 years ago
How Closely Related Are Historical Mortgage Rates and Housing Prices?
-

 Infographics2 years ago
A Visual Guide to Stagflation, Inflation, and Deflation
-

 Markets in a Minute1 year ago
Mapped: Global Energy Prices, by Country in 2022
-

 Infographics3 years ago
The 5 Fastest Growing Industries of the Next Decade
-

 Markets in a Minute2 years ago
Visualizing Historical Oil Prices (1968-2022)
-

 Infographics1 year ago
Visual Guide: The Three Types of Economic Indicators
