
Markets in a Minute
Visualizing 30 Years of Investor Sentiment
Visualizing Investor Sentiment Over 30 Years
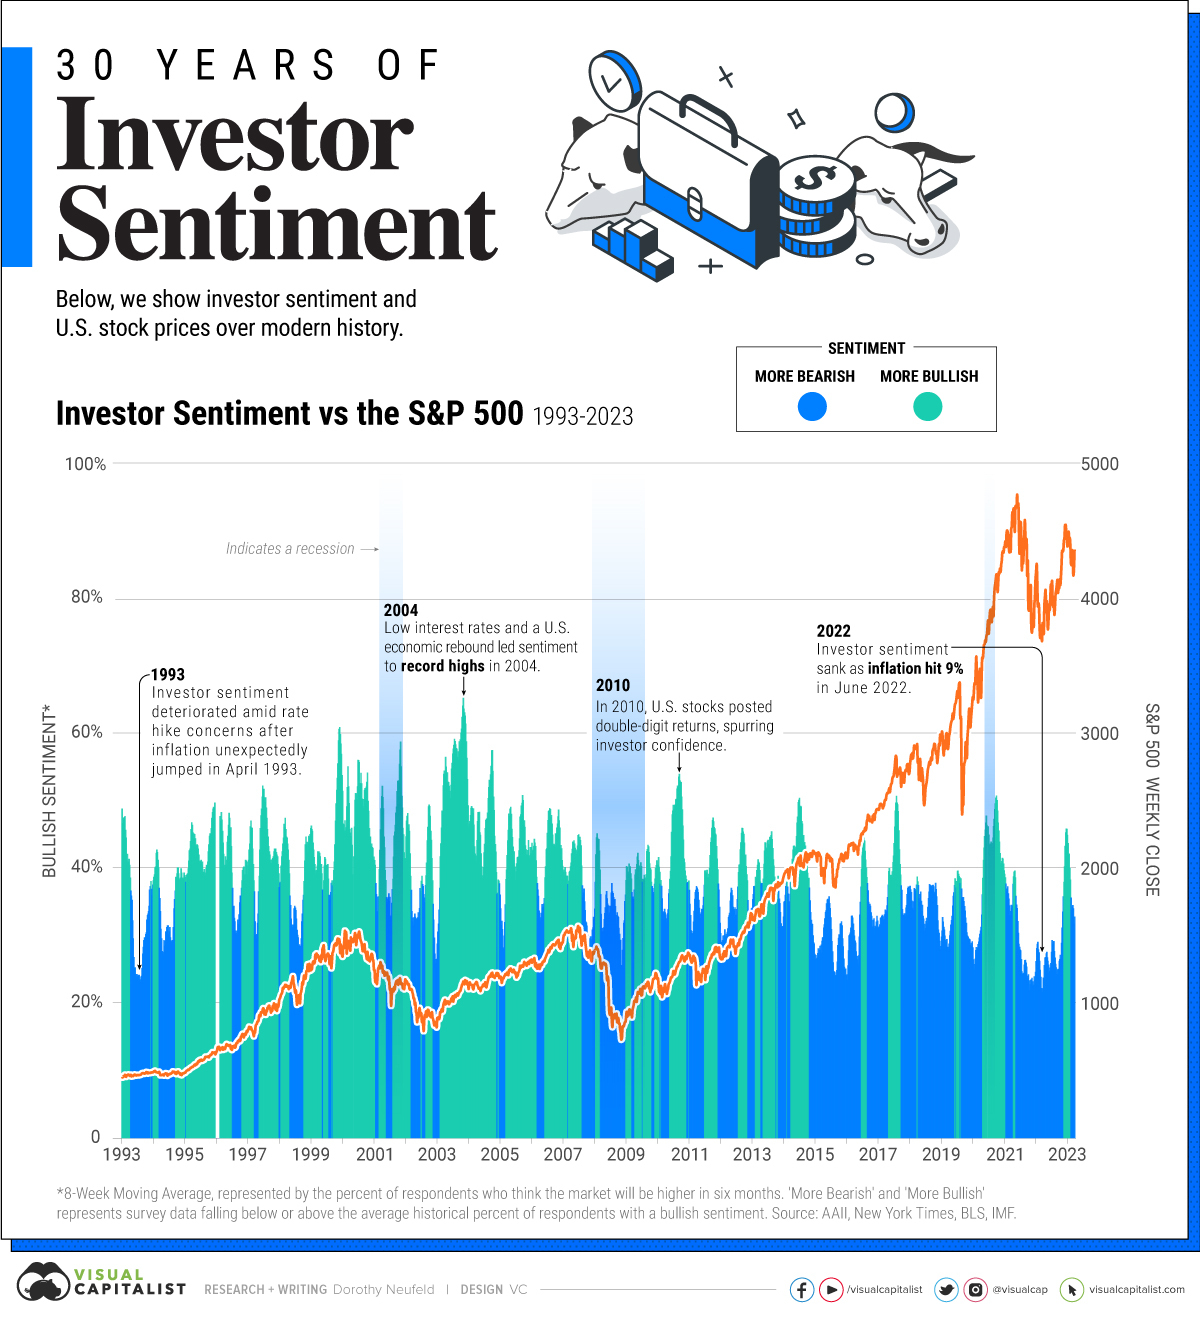
Sometimes investor sentiment garners attention because it provides a glimpse at how investors might behave. In this way, sentiment would influence their investment behavior, and in turn the wider stock market.
To be sure, the link between sentiment and the stock market is not linear. In fact, many consider extreme sentiment readings as a contrarian indicator. If sentiment swings sharply in one direction, some investors may consider this a signal to do the reverse.
This graphic shows 30 years of investor sentiment, based on data from the American Association of Individual Investors (AAII).
How is Investor Sentiment Measured?
The AAII survey shows bullish sentiment, indicated by the percentage of investors who think the stock market will be higher in six months. We charted the eight-week moving average for bullish sentiment to smooth out fluctuations and show broader trends.
When Investor Optimism Ran High
When has sentiment peaked over historical market cycles?
The highest bullish readings took place during 2004 and 2000 surrounding the Dotcom bubble. In January 2004, the bullish eight-week moving average hit records amid a U.S. economic rebound, spurred by low interest rates after stocks had tumbled for over two years.
Prior to this, at the height of the bubble in early 2000, investor optimism accelerated. This came after the Nasdaq posted 86% returns in 1999, as tech stocks soared. In 1999, 13 stocks in the index saw at least 1,000% returns. The tech-heavy Nasdaq index later hit a high in March 2000 before bursting, not fully recovering until 2015.
Investor sentiment later hit highs in January 2011, following surging stock market performance as the S&P 500 fully recovered losses from the 2008 crash in late 2010. This rebound would become the longest bull market in history.
More recently, bullish sentiment jumped in April 2021 as the Federal Reserve signaled that interest rates would stay near rock bottom. In April, the S&P 500 hit new highs, climbing over 80% from March 2020 lows.
Where Does Sentiment Stand Today?
This year, investor sentiment has improved compared to 2022, as investors hope that the Fed may wind down interest rate hikes.
Despite real U.S. GDP picking up 4.9% year-over-year in the third quarter, October’s inflation reading remained unchanged compared to the previous month, sitting at 3.2%. The S&P 500 has increased roughly 18% in 2023 to-date, as investor optimism improves.
Yet a separate survey shows that almost 70% of U.S. consumers think a recession is coming next year.
With the looming uncertainty on the direction of interest rates—given strong economic data potentially lifting inflation—investors and consumers appear to have mixed views on where the market is heading even as stocks look to be resilient so far.


Markets in a Minute
The Top 5 Reasons Clients Fire a Financial Advisor
Firing an advisor is often driven by more than cost and performance factors. Here are the top reasons clients ‘break up’ with their advisors.

The Top 5 Reasons Clients Fire a Financial Advisor
What drives investors to fire a financial advisor?
From saving for a down payment to planning for retirement, clients turn to advisors to guide them through life’s complex financial decisions. However, many of the key reasons for firing a financial advisor stem from emotional factors, and go beyond purely financial motivations.
We partnered with Morningstar to show the top reasons clients fire an advisor to provide insight on what’s driving investor behavior.
What Drives Firing Decisions?
Here are the top reasons clients terminated their advisor, based on a survey of 184 respondents:
| Reason for Firing | % of Respondents Citing This Reason | Type of Motivation |
|---|---|---|
| Quality of financial advice and services | 32% | Emotion-based reason |
| Quality of relationship | 21% | Emotion-based reason |
| Cost of services | 17% | Financial-based reason |
| Return performance | 11% | Financial-based reason |
| Comfort handling financial issues on their own | 10% | Emotion-based reason |
Numbers may not total 100 due to rounding. Respondents could select more than one answer.
Numbers may not total 100 due to rounding. Respondents could select more than one answer.
While firing an advisor is rare, many of the primary drivers behind firing decisions are also emotionally driven.
Often, advisors were fired due to the quality of the relationship. In many cases, this was due to an advisor not dedicating enough time to fully grasp their personal financial goals. Additionally, wealthier, and more financially literate clients are more likely to fire their advisors—highlighting the importance of understanding the client.
Key Takeaways
Given these driving factors, here are five ways that advisors can build a lasting relationship through recognizing their clients’ emotional needs:
- Understand your clients’ deeper goals
- Reach out proactively
- Act as a financial coach
- Keep clients updated
- Conduct goal-setting exercises on a regular basis
By communicating their value and setting expectations early, advisors can help prevent setbacks in their practice by adeptly recognizing the emotional motivators of their clients.
Markets in a Minute
The Top 5 Reasons Clients Hire a Financial Advisor
Here are the most common drivers for hiring a financial advisor, revealing that investor motivations go beyond just financial factors.

The Top 5 Reasons Clients Hire a Financial Advisor
What drives investors to hire a financial advisor?
From saving for a down payment to planning for retirement, clients turn to advisors to guide them through life’s complex financial decisions. However, many of the key reasons for hiring a financial advisor stem from emotional factors, and go beyond purely financial motivations.
We partnered with Morningstar to show the top reasons clients hire a financial advisor to provide insight on what’s driving investor behavior.
What Drives Hiring Decisions?
Here are the most common reasons for hiring an advisor, based on a survey of 312 respondents.
| Reason for Hiring | % of Respondents Citing This Reason | Type of Motivation |
|---|---|---|
| Specific goals or needs | 32% | Financial-based reason |
| Discomfort handling finances | 32% | Emotion-based reason |
| Behavioral coaching | 17% | Emotion-based reason |
| Recommended by family or friends | 12% | Emotion-based reason |
| Quality of relationship | 10% | Emotion-based reason |
Numbers may not total 100 due to rounding. Respondents could select more than one answer.
While financial factors played an important role in hiring decisions, emotional reasons made up the largest share of total responses.
This illustrates that clients place a high degree of importance on reaching specific goals or needs, and how an advisor communicates with them. Furthermore, clients seek out advisors for behavioral coaching to help them make informed decisions while staying the course.
Key Takeaways
With this in mind, here are five ways advisors can provide value to their clients and grow their practice:
- Address clients’ emotional needs early on
- Demonstrate how you can offer support
- Use ordinary language
- Provide education to help clients stay on track
- Acknowledge that these are issues we all face
By addressing emotional factors, advisors can more effectively help clients’ navigate intricate financial decisions and avoid common behavioral mistakes.

The Top 5 Reasons Clients Fire a Financial Advisor

The Top 5 Reasons Clients Hire a Financial Advisor

Visualizing the Growth of $100, by Asset Class

How Small Investments Make a Big Impact Over Time

What Were the Top Performing Investment Themes of 2023?
-

 Infographics2 years ago
The Top Investment Quotes Every Investor Should Know
-

 Markets in a Minute2 years ago
Mapped: The Growth in U.S. House Prices by State
-

 Markets in a Minute2 years ago
How Closely Related Are Historical Mortgage Rates and Housing Prices?
-

 Infographics2 years ago
A Visual Guide to Stagflation, Inflation, and Deflation
-

 Markets in a Minute1 year ago
Mapped: Global Energy Prices, by Country in 2022
-

 Markets in a Minute2 years ago
Visualizing Historical Oil Prices (1968-2022)
-

 Infographics1 year ago
Visual Guide: The Three Types of Economic Indicators
-

 Markets in a Minute2 years ago
Mapped: Global Macroeconomic Risk, by Country in 2022
