
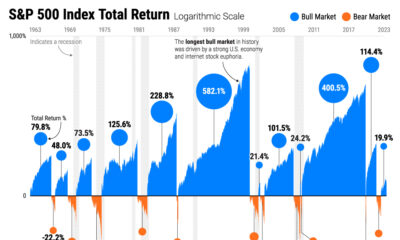

Stock market cycles often rhyme throughout history, shaped by monetary policy, consumer spending, and herd behaviour.


This graphic shows the return expectation gap between investors and advisors around the world, revealing a range of market outlooks.


Here's how investor sentiment has shifted over the last three decades, from the Dotcom boom to present-day.
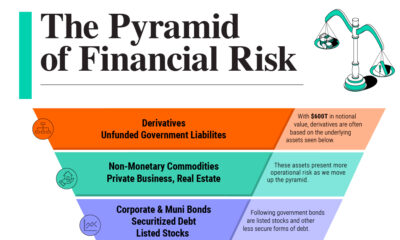

Assets at the bottom of Exter’s pyramid of financial risk are typically the most liquid during periods of market stress.
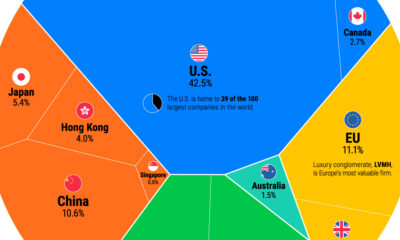

We show the entire global stock market in 2023, illustrating the dominance of U.S. markets. But as structural dynamics shift, will this last?
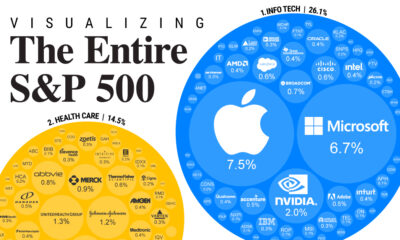

S&P 500 companies make up $34 trillion in market value combined. This graphic shows how they break down by weight and sector.
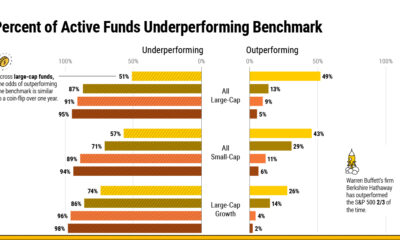

For actively managed funds, the odds of beating the market over the long run are like finding a needle in a haystack.


From GDP to interest rates, this infographic shows key economic indicators for navigating the massive U.S. economy.
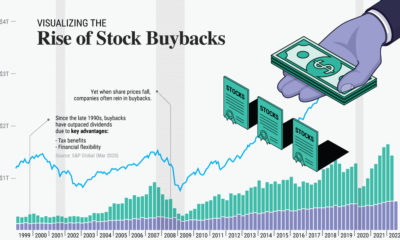

Unlike the last two downturns, stock buybacks could hit a record $1.3T in 2022. We chart their growth over the last two decades.
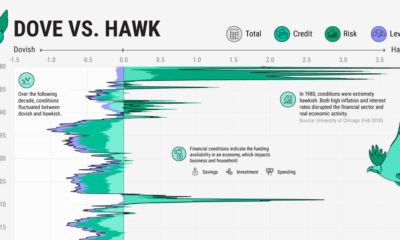

We show the Financial Conditions Index, which breaks down the state of U.S. financial markets based on 105 indicators.


