
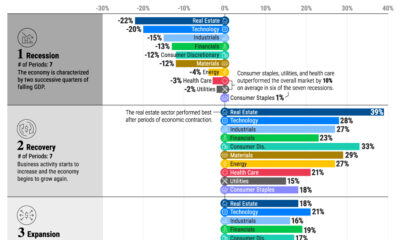

We show the best performing S&P 500 sectors over each phase of the business cycle using nearly seven decades of data.
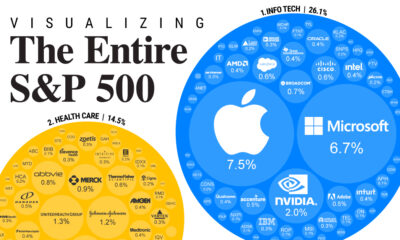

S&P 500 companies make up $34 trillion in market value combined. This graphic shows how they break down by weight and sector.
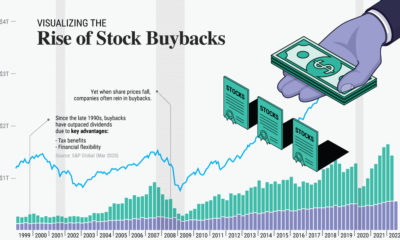

Unlike the last two downturns, stock buybacks could hit a record $1.3T in 2022. We chart their growth over the last two decades.


