
Markets in a Minute
Chart: U.S. Home Price Growth Over 50 Years
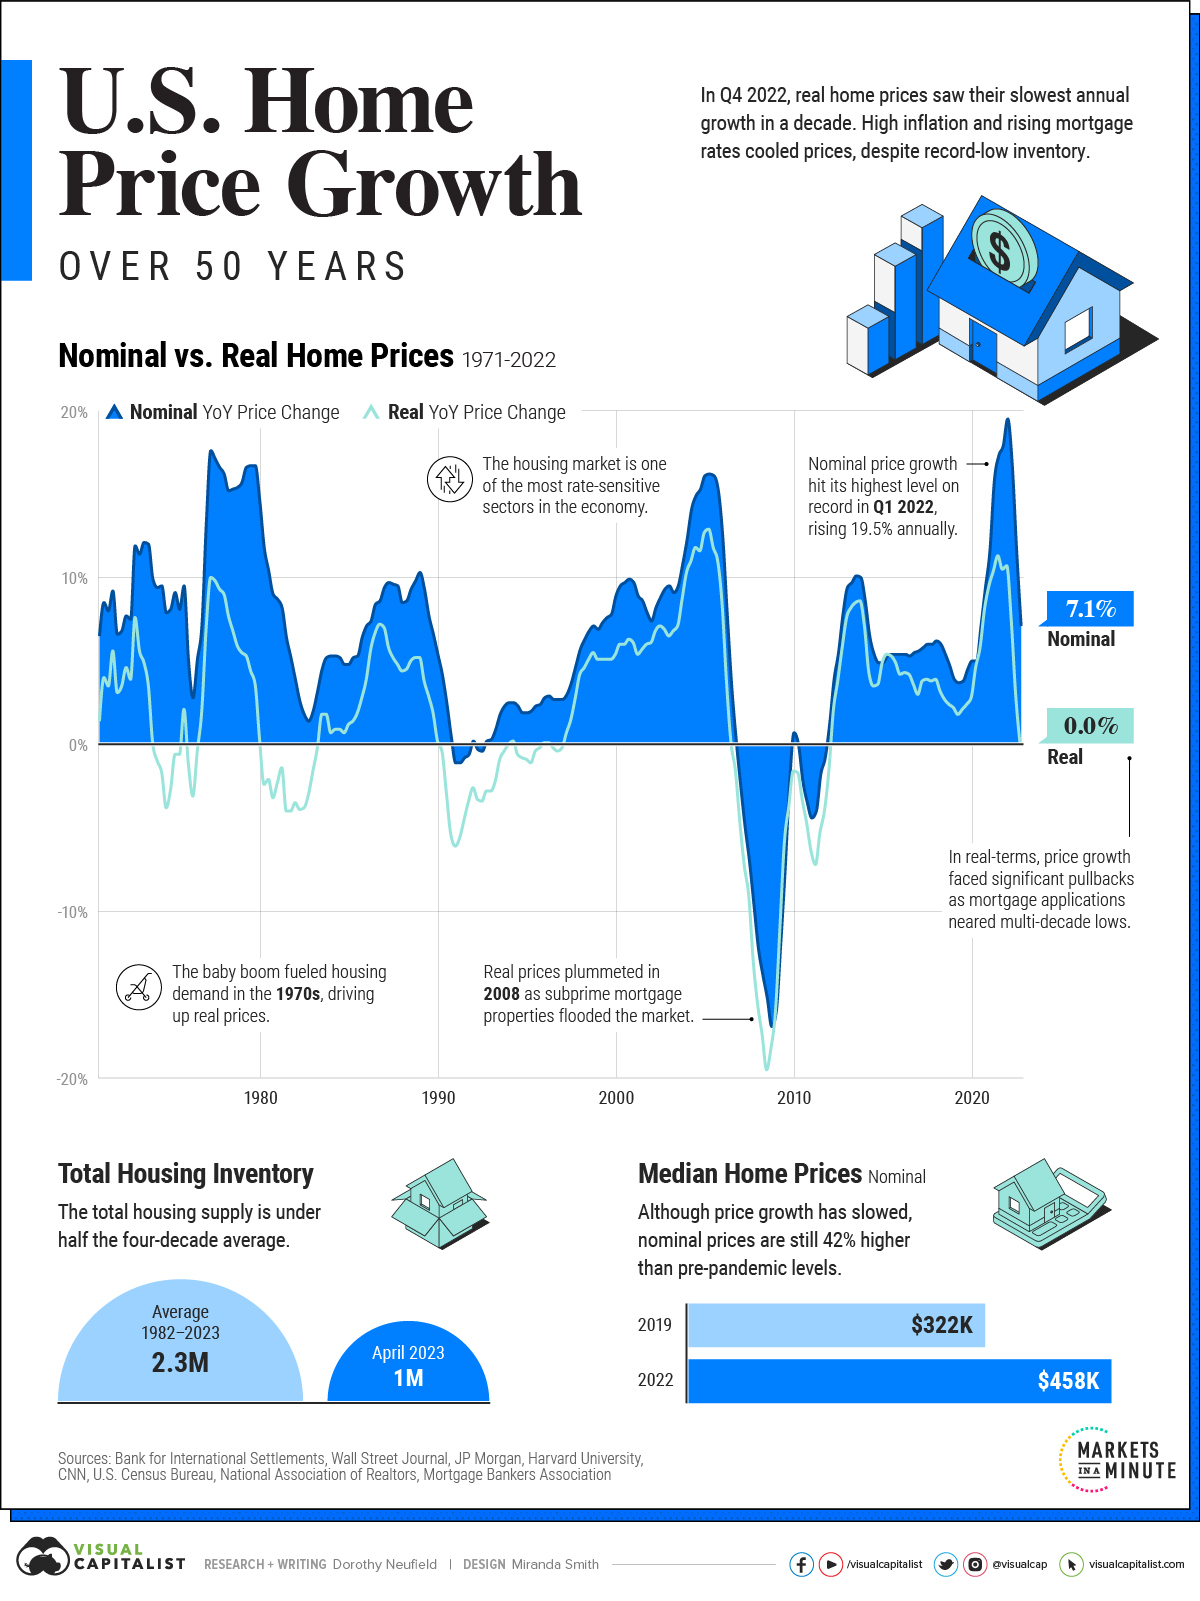
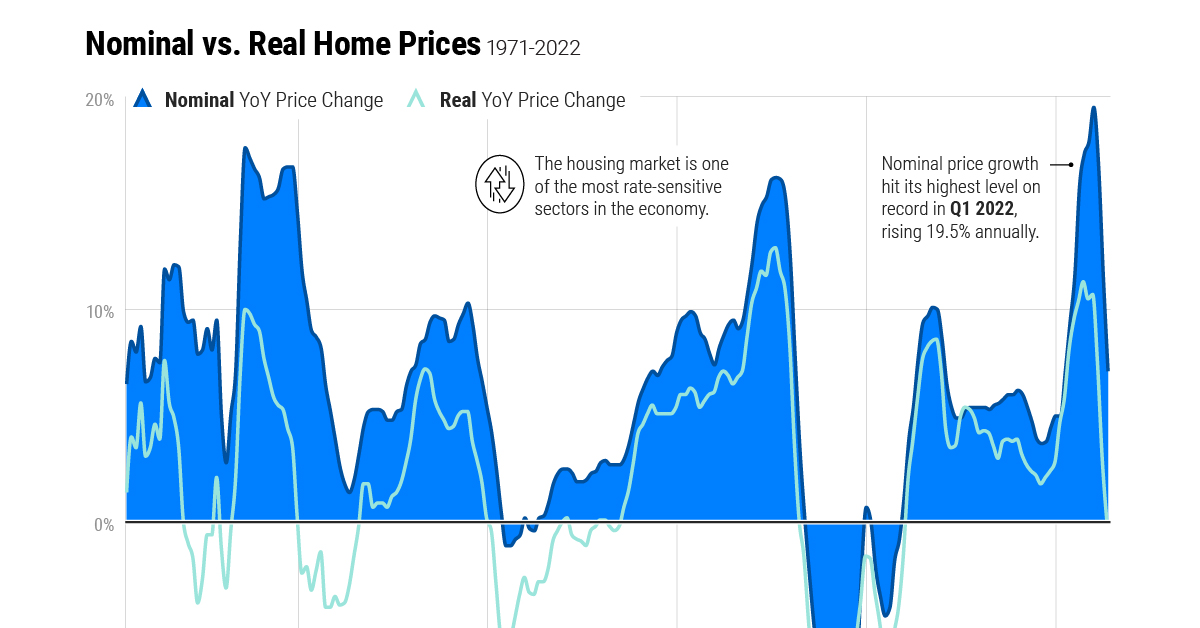
Chart: U.S. Home Price Growth Over 50 Years
U.S. home prices grew significantly in 2022, even as interest rates climbed higher.
Yet in inflation-adjusted terms, this growth rate was far lower. By Q4 2022, it fell to being flat year-on-year, making it the slowest real growth seen in a decade.
The above graphic compares nominal and real residential property price growth over 50 years based on the latest data from the Bank for International Settlements (BIS).
Nominal vs. Real Home Price Growth
In 2022, opposing forces of rising mortgage rates and a narrow supply of housing produced a moderate nominal growth rate of just over 7% as of Q4 2022. That said, real price growth dropped to 0% over the period.
Here’s how that looks in context of the recent highs and lows of housing price growth:
| Nominal Home Price Growth Year-over-Year | Real Home Price Growth Year-over-Year |
|
|---|---|---|
| Q4 2022 | 7.1% | 0.0% |
| Peak | 19.5% (Q1 2022) | 12.9% (Q2 2005) |
| Low | -16.9% (Q4 2008) | -19.5% (Q3 2008) |
Recent Highs: During the pandemic, growth hit almost a 20% year-over-year rate by Q1 2022, which was record home price growth at the time. It was driven by ultra-low interest rates and remote work leading people to seek out more space.
Recent Lows: In both real and nominal terms, home price growth sank to their lowest levels in 2008. The property market crashed after a wave of easing lending requirements. This flooded the market with an oversupply of houses as subprime homeowners couldn’t afford to make payments, leading prices to plummet.
Factors Influencing Home Price Growth
Today, a mix of factors are supporting nominal house prices.
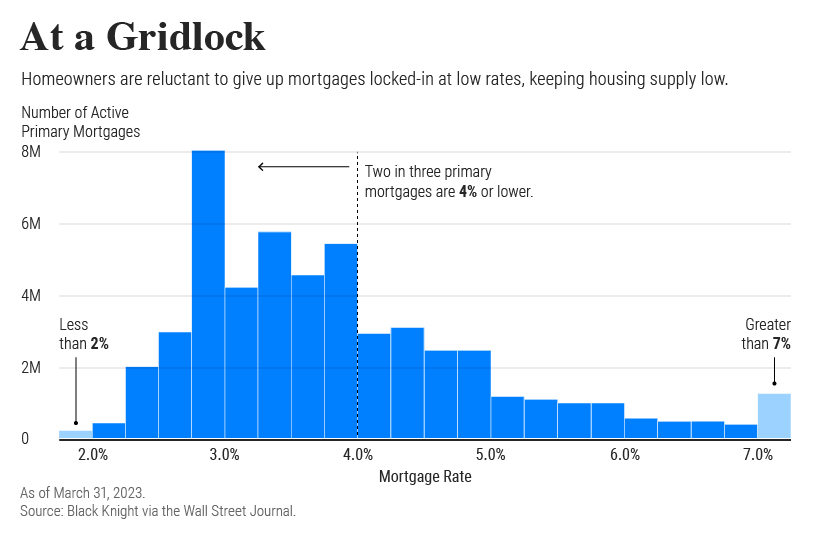
First, the housing supply remains low. Total existing inventory stood at 1 million in April, under half the four-decade average. As interest rates have increased, homeowners have been hesitant to sell and the number of mortgage applications has fallen. In turn, this is pushing prices higher.
In fact, the majority of primary mortgages have interest rates locked in under 4%. As of May 4, the average 30-year fixed mortgage rate stood much higher, at 6.4%.
Along with this, new home sales are falling.
After hitting a 15-year peak in 2021, sales sank almost 27% year-over-year in April. New home sales are often considered a leading indicator for the residential market.
Wider Implications
The U.S. residential market is valued at about $45 trillion, and has historically been highly sensitive to interest rates.
While the rapid increase in interest rates haven’t yet had a major impact on housing prices, some cracks are beginning to show.
On the other hand, if prices remain stubborn, it may contribute to inflationary pressures, leading the Federal Reserve to continue with rate increases, given the market’s sheer size and influence on the overall U.S. economy.


Markets in a Minute
The Top 5 Reasons Clients Fire a Financial Advisor
Firing an advisor is often driven by more than cost and performance factors. Here are the top reasons clients ‘break up’ with their advisors.

The Top 5 Reasons Clients Fire a Financial Advisor
What drives investors to fire a financial advisor?
From saving for a down payment to planning for retirement, clients turn to advisors to guide them through life’s complex financial decisions. However, many of the key reasons for firing a financial advisor stem from emotional factors, and go beyond purely financial motivations.
We partnered with Morningstar to show the top reasons clients fire an advisor to provide insight on what’s driving investor behavior.
What Drives Firing Decisions?
Here are the top reasons clients terminated their advisor, based on a survey of 184 respondents:
| Reason for Firing | % of Respondents Citing This Reason | Type of Motivation |
|---|---|---|
| Quality of financial advice and services | 32% | Emotion-based reason |
| Quality of relationship | 21% | Emotion-based reason |
| Cost of services | 17% | Financial-based reason |
| Return performance | 11% | Financial-based reason |
| Comfort handling financial issues on their own | 10% | Emotion-based reason |
Numbers may not total 100 due to rounding. Respondents could select more than one answer.
Numbers may not total 100 due to rounding. Respondents could select more than one answer.
While firing an advisor is rare, many of the primary drivers behind firing decisions are also emotionally driven.
Often, advisors were fired due to the quality of the relationship. In many cases, this was due to an advisor not dedicating enough time to fully grasp their personal financial goals. Additionally, wealthier, and more financially literate clients are more likely to fire their advisors—highlighting the importance of understanding the client.
Key Takeaways
Given these driving factors, here are five ways that advisors can build a lasting relationship through recognizing their clients’ emotional needs:
- Understand your clients’ deeper goals
- Reach out proactively
- Act as a financial coach
- Keep clients updated
- Conduct goal-setting exercises on a regular basis
By communicating their value and setting expectations early, advisors can help prevent setbacks in their practice by adeptly recognizing the emotional motivators of their clients.
Markets in a Minute
The Top 5 Reasons Clients Hire a Financial Advisor
Here are the most common drivers for hiring a financial advisor, revealing that investor motivations go beyond just financial factors.

The Top 5 Reasons Clients Hire a Financial Advisor
What drives investors to hire a financial advisor?
From saving for a down payment to planning for retirement, clients turn to advisors to guide them through life’s complex financial decisions. However, many of the key reasons for hiring a financial advisor stem from emotional factors, and go beyond purely financial motivations.
We partnered with Morningstar to show the top reasons clients hire a financial advisor to provide insight on what’s driving investor behavior.
What Drives Hiring Decisions?
Here are the most common reasons for hiring an advisor, based on a survey of 312 respondents.
| Reason for Hiring | % of Respondents Citing This Reason | Type of Motivation |
|---|---|---|
| Specific goals or needs | 32% | Financial-based reason |
| Discomfort handling finances | 32% | Emotion-based reason |
| Behavioral coaching | 17% | Emotion-based reason |
| Recommended by family or friends | 12% | Emotion-based reason |
| Quality of relationship | 10% | Emotion-based reason |
Numbers may not total 100 due to rounding. Respondents could select more than one answer.
While financial factors played an important role in hiring decisions, emotional reasons made up the largest share of total responses.
This illustrates that clients place a high degree of importance on reaching specific goals or needs, and how an advisor communicates with them. Furthermore, clients seek out advisors for behavioral coaching to help them make informed decisions while staying the course.
Key Takeaways
With this in mind, here are five ways advisors can provide value to their clients and grow their practice:
- Address clients’ emotional needs early on
- Demonstrate how you can offer support
- Use ordinary language
- Provide education to help clients stay on track
- Acknowledge that these are issues we all face
By addressing emotional factors, advisors can more effectively help clients’ navigate intricate financial decisions and avoid common behavioral mistakes.

The Top 5 Reasons Clients Fire a Financial Advisor

The Top 5 Reasons Clients Hire a Financial Advisor

Visualizing the Growth of $100, by Asset Class

How Small Investments Make a Big Impact Over Time

What Were the Top Performing Investment Themes of 2023?
-

 Infographics2 years ago
The Top Investment Quotes Every Investor Should Know
-

 Markets in a Minute2 years ago
Mapped: The Growth in U.S. House Prices by State
-

 Markets in a Minute2 years ago
How Closely Related Are Historical Mortgage Rates and Housing Prices?
-

 Infographics2 years ago
A Visual Guide to Stagflation, Inflation, and Deflation
-

 Markets in a Minute1 year ago
Mapped: Global Energy Prices, by Country in 2022
-

 Markets in a Minute2 years ago
Visualizing Historical Oil Prices (1968-2022)
-

 Infographics1 year ago
Visual Guide: The Three Types of Economic Indicators
-

 Markets in a Minute2 years ago
Mapped: Global Macroeconomic Risk, by Country in 2022
