Firing an advisor is often driven by more than cost and performance factors. Here are the top reasons clients 'break up' with their advisors.


Here are the most common drivers for hiring a financial advisor, revealing that investor motivations go beyond just financial factors.
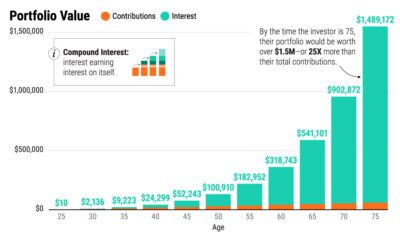

Compound interest is a powerful force in building wealth. Here's how it impacts even the most modest portfolio over the long-term.
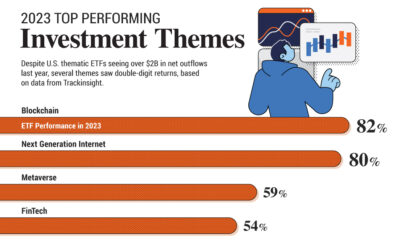

In 2023, several investment themes outperformed the S&P 500 by a wide margin. Here are the top performers—from blockchain to AI.
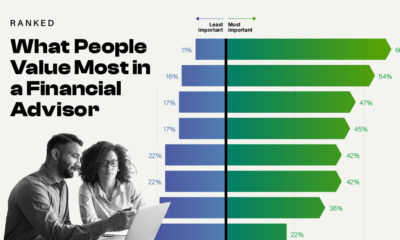

Positive reviews and recommendations are some of the least important factors—so what do people look for in a financial advisor?


Global inflation projections look optimistic in 2024, but risks of a second wave of price pressures remain due to geopolitical shocks.


Will global GDP growth continue to be resilient in 2024? This graphic shows the economic outlook for 191 economies around the world.
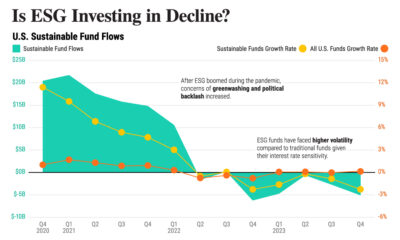

After the pandemic boom, ESG investments lost their luster amid high interest rates. Could they make a comeback?
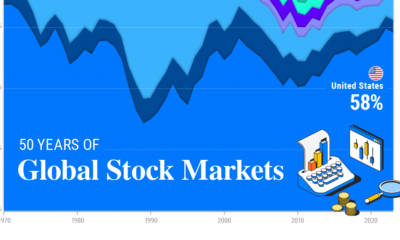

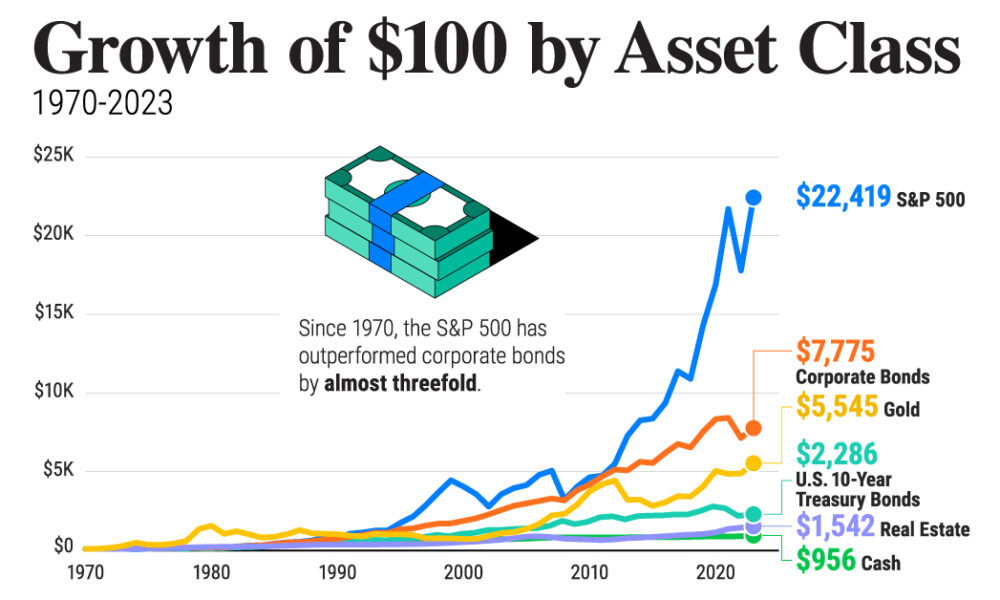
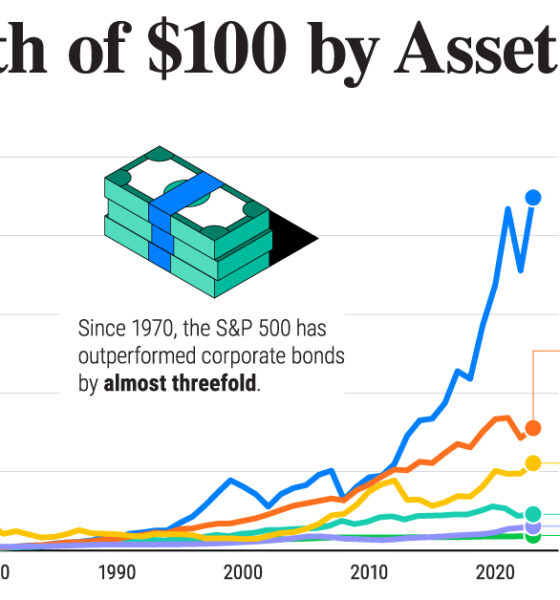
This graphic shows the evolution of global stock markets over modern history—highlighting the outsized influence of the U.S. market.
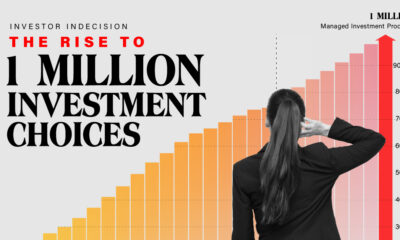

By 2031, there could be one million managed investment products. The rapid growth is leading to decision paralysis among investors.