
Markets in a Minute
All S&P 500 Sectors and Industries, by Size
View the full-size version of this infographic. Buy the poster.
All of the S&P 500 Sectors and Industries, by Size
View the high resolution version of this infographic. Buy the poster.
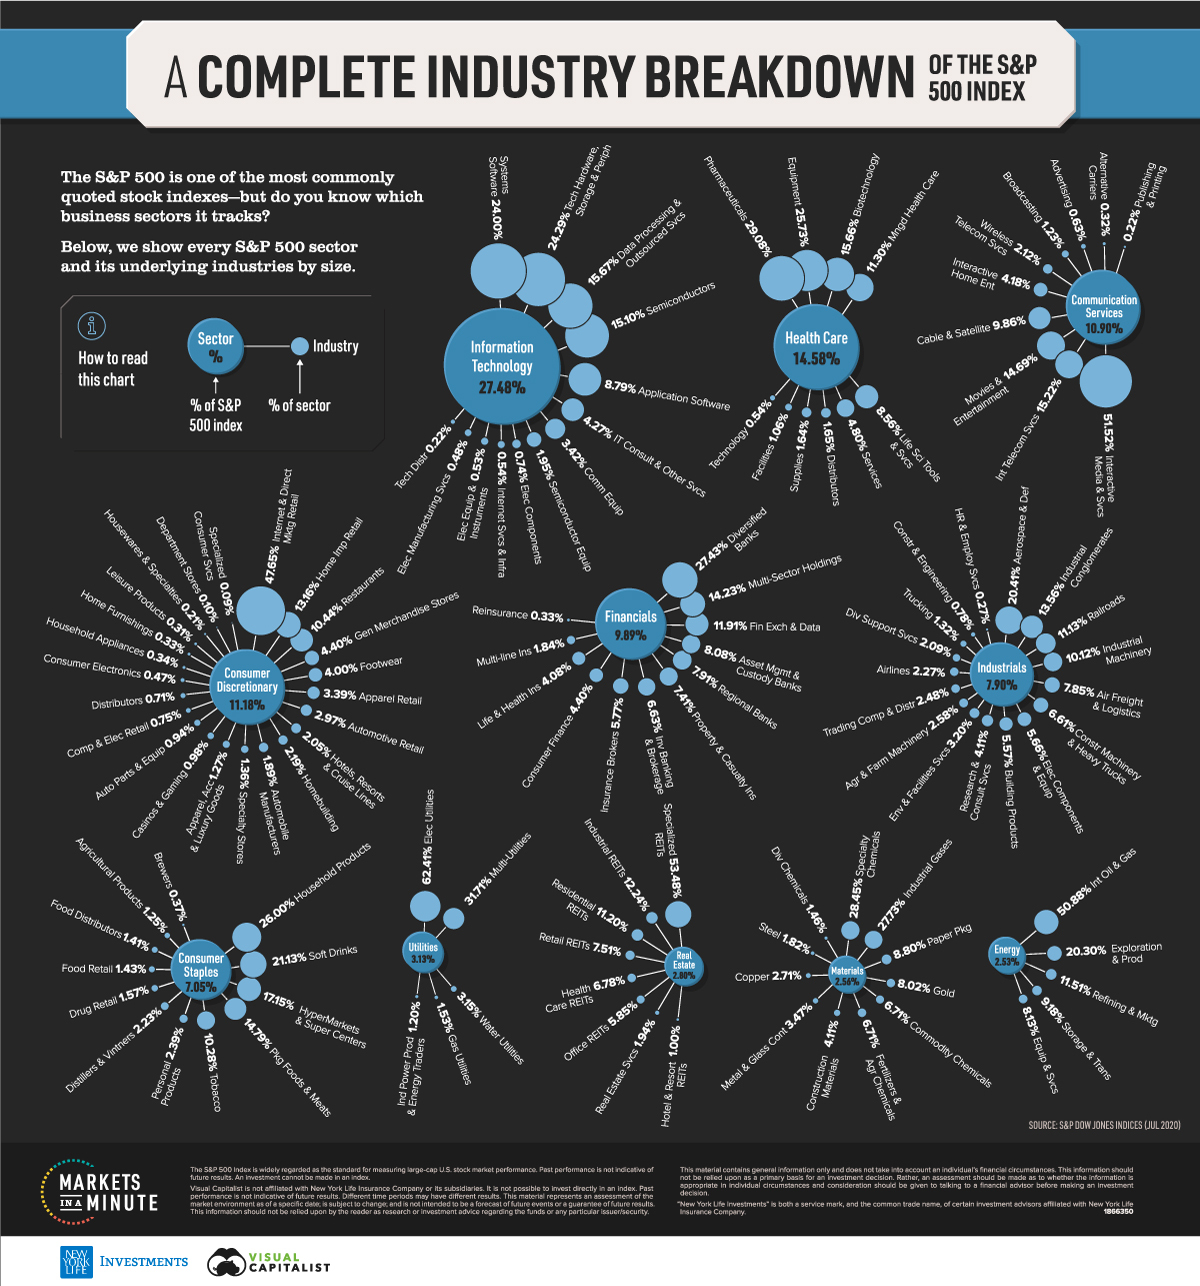
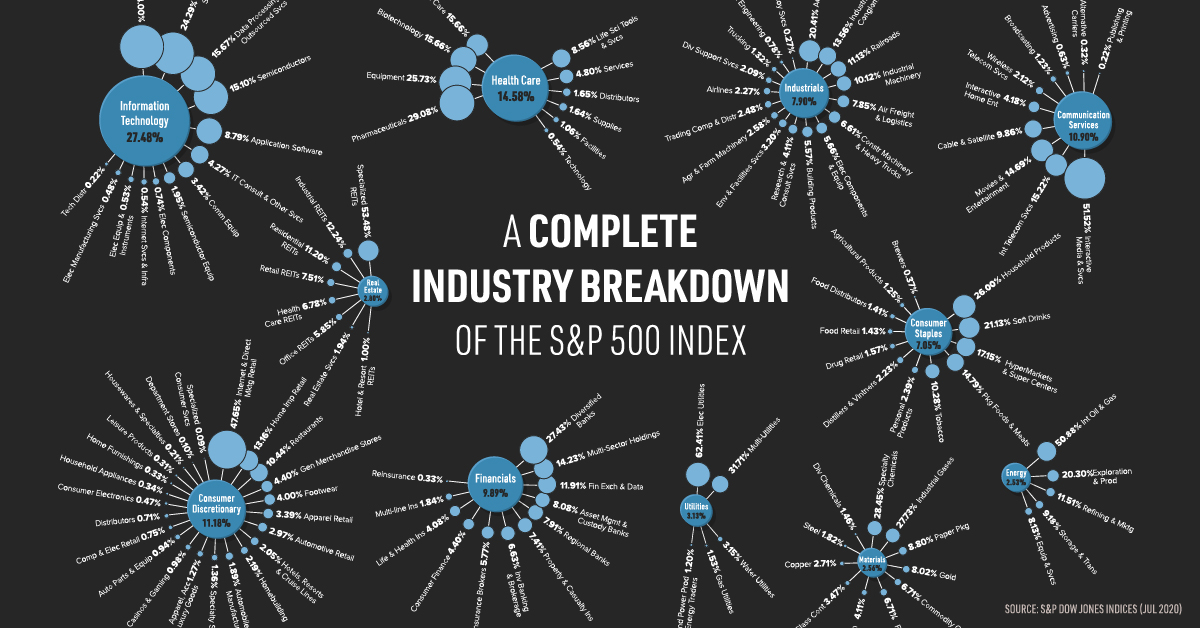
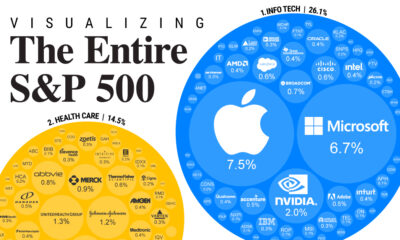
The S&P 500 is one of the most widely quoted stock market indexes, but do you know how it’s comprised? From soft drinks to semiconductors, the benchmark index tracks an extremely wide variety of industries across the U.S. economy.
In this Markets in a Minute chart from New York Life Investments, we show every sector and its underlying industries by size.
A Sector View
At a high level, the S&P 500 tracks broad segments of the economy known as sectors. Here’s how the percentage allocation in the index breaks down:
| Sector | Percent of S&P 500 Index |
|---|---|
| Information Technology | 27.48% |
| Health Care | 14.58% |
| Consumer Discretionary | 11.18% |
| Communication Services | 10.90% |
| Financials | 9.89% |
| Industrials | 7.90% |
| Consumer Staples | 7.05% |
| Utilities | 3.13% |
| Real Estate | 2.80% |
| Materials | 2.56% |
| Energy | 2.53% |
Data as of July 31, 2020.
Information technology, which makes up almost 28% of the index, has outperformed other sectors by a wide margin so far in 2020. At the other end of the spectrum, real estate, materials, and energy each make up less than 3% of the index.
Diving Deeper: An Industry View
While investors are likely familiar with sectors, the specific underlying industries may be lesser known. Below is a complete industry breakdown of the S&P 500.
Click “Next” to view industry breakdowns of each sector
| Sector | Industry | % of Sector |
|---|---|---|
| Communication Services | ||
| Advertising | 0.63% | |
| Alternative Carriers | 0.32% | |
| Broadcasting | 1.23% | |
| Cable & Satellite | 9.86% | |
| Integrated Telecommunication Services | 15.22% | |
| Interactive Home Entertainment | 4.18% | |
| Interactive Media & Services | 51.52% | |
| Movies & Entertainment | 14.69% | |
| Publishing & Printing | 0.22% | |
| Communication Services (cont'd) | Wireless Telecommunication Services | 2.12% |
| Consumer Discretionary | ||
| Apparel Retail | 3.39% | |
| Apparel, Accessories & Luxury Goods | 1.27% | |
| Auto Parts & Equipment | 0.94% | |
| Automobile Manufacturers | 1.89% | |
| Automotive Retail | 2.97% | |
| Casinos & Gaming | 0.98% | |
| Computer & Electronics Retail | 0.75% | |
| Consumer Electronics | 0.47% | |
| Consumer Discretionary (cont'd) | Department Stores | 0.10% |
| Distributors | 0.71% | |
| Footwear | 4.00% | |
| General Merchandise Stores | 4.40% | |
| Home Furnishings | 0.33% | |
| Home Improvement Retail | 13.16% | |
| Homebuilding | 2.19% | |
| Hotels, Resorts & Cruise Lines | 2.05% | |
| Household Appliances | 0.34% | |
| Housewares & Specialties | 0.21% | |
| Consumer Discretionary (cont'd) | Internet & Direct Marketing Retail | 47.65% |
| Leisure Products | 0.31% | |
| Restaurants | 10.44% | |
| Specialized Consumer Services | 0.09% | |
| Specialty Stores | 1.36% | |
| Consumer Staples | ||
| Agricultural Products | 1.25% | |
| Brewers | 0.37% | |
| Distillers & Vintners | 2.23% | |
| Drug Retail | 1.57% | |
| Consumer Staples (cont'd) | Food Distributors | 1.41% |
| Food Retail | 1.43% | |
| Household Products | 26% | |
| HyperMarkets & Super Centers | 17.15% | |
| Packaged Foods & Meats | 14.79% | |
| Personal Products | 2.39% | |
| Soft Drinks | 21.13% | |
| Tobacco | 10.28% | |
| Energy | ||
| Integrated Oil & Gas | 50.88% | |
| Energy (cont'd) | Oil & Gas Equipment & Services | 8.13% |
| Oil & Gas Exploration & Production | 20.30% | |
| Oil & Gas Refining & Marketing | 11.51% | |
| Oil & Gas Storage & Transportation | 9.18% | |
| Financials | ||
| Asset Management & Custody Banks | 8.08% | |
| Consumer Finance | 4.40% | |
| Diversified Banks | 27.43% | |
| Financial Exchanges & Data | 11.91% | |
| Insurance Brokers | 5.77% | |
| Financials (cont'd) | Investment Banking & Brokerage | 6.63% |
| Life & Health Insurance | 4.08% | |
| Multi-line Insurance | 1.84% | |
| Multi-Sector Holdings | 14.23% | |
| Property & Casualty Insurance | 7.41% | |
| Regional Banks | 7.91% | |
| Reinsurance | 0.33% | |
| Health Care | ||
| Biotechnology | 15.66% | |
| Health Care Distributors | 1.65% | |
| Health Care (cont'd) | Health Care Equipment | 25.73% |
| Health Care Facilities | 1.06% | |
| Health Care Services | 4.80% | |
| Health Care Supplies | 1.64% | |
| Health Care Technology | 0.54% | |
| Life Sciences Tools & Services | 8.56% | |
| Managed Health Care | 11.30% | |
| Pharmaceuticals | 29.08% | |
| Industrials | ||
| Aerospace & Defense | 20.41% | |
| Industrials (cont'd) | Agricultural & Farm Machinery | 2.58% |
| Air Freight & Logistics | 7.85% | |
| Airlines | 2.27% | |
| Building Products | 5.57% | |
| Construction & Engineering | 0.78% | |
| Construction Machinery & Heavy Trucks | 6.61% | |
| Diversified Support Services | 2.09% | |
| Electrical Components & Equipment | 5.66% | |
| Environmental & Facilities Services | 3.20% | |
| Human Resource & Employment Services | 0.27% | |
| Industrials (cont'd) | Industrial Conglomerates | 13.56% |
| Industrial Machinery | 10.12% | |
| Railroads | 11.13% | |
| Research & Consulting Services | 4.11% | |
| Trading Companies & Distributors | 2.48% | |
| Trucking | 1.32% | |
| Information Technology | ||
| Application Software | 8.79% | |
| Communications Equipment | 3.42% | |
| Data Processing & Outsourced Services | 15.67% | |
| Information Technology (cont'd) | Electronic Components | 0.74% |
| Electronic Equipment & Instruments | 0.53% | |
| Electronic Manufacturing Services | 0.48% | |
| Internet Services & Infrastructure | 0.54% | |
| IT Consulting & Other Services | 4.27% | |
| Semiconductor Equipment | 1.95% | |
| Semiconductors | 15.10% | |
| Systems Software | 24.00% | |
| Technology Distributors | 0.22% | |
| Technology Hardware, Storage & Peripherals | 24.29% | |
| Materials | ||
| Commodity Chemicals | 6.71% | |
| Construction Materials | 4.11% | |
| Copper | 2.71% | |
| Diversified Chemicals | 1.46% | |
| Fertilizers & Agricultural Chemicals | 6.71% | |
| Gold | 8.02% | |
| Industrial Gases | 27.73% | |
| Metal & Glass Containers | 3.47% | |
| Paper Packaging | 8.80% | |
| Materials (cont'd) | Specialty Chemicals | 28.45% |
| Steel | 1.82% | |
| Real Estate | ||
| Health Care REITs | 6.78% | |
| Hotel & Resort REITs | 1.00% | |
| Industrial REITs | 12.24% | |
| Office REITs | 5.85% | |
| Real Estate Services | 1.94% | |
| Residential REITs | 11.20% | |
| Retail REITs | 7.51% | |
| Real Estate (cont'd) | Specialized REITs | 53.48% |
| Utilities | ||
| Electric Utilities | 62.41% | |
| Gas Utilities | 1.53% | |
| Independent Power Producers & Energy Traders | 1.20% | |
| Water Utilities | 3.15% | |
| Multi-Utilities | 31.71% |
Data as of July 31, 2020.
In total, the S&P 500 tracks 126 industries, and each one presents unique risks and opportunities.
Biotechnology, which focuses on novel drug development and clinical research for treating diseases, has gained renewed interest during the COVID-19 pandemic. While successful drugs can offer high potential returns, about 90% of clinical programs ultimately fail. Investors can screen potential companies for various factors including corporate sponsor support, ample long-term funds, and a pipeline with more than one product.
Another example is aerospace and defense. Due to the high barriers to entry and significant funding from the U.S. government, this can be an attractive industry for investors. However, it can be impacted by the current government’s defense policies. For example, the aerospace and defense industry performed well after President Donald Trump was elected, and it may be influenced by the November 2020 election results.
The Big Picture
With a full view of the S&P 500 sectors and industries, investors can get a better idea of the opportunities within U.S. large cap stocks. However, it’s worth noting that it is not possible to invest directly in an index. Investors can put funds in these industries by purchasing stocks directly, or through managed products such as ETFs and mutual funds that track index performance.
By exploring every corner of the economy, investors can take advantage of growth potential in various areas—not just those trending in the news cycle.


Markets in a Minute
The Top 5 Reasons Clients Fire a Financial Advisor
Firing an advisor is often driven by more than cost and performance factors. Here are the top reasons clients ‘break up’ with their advisors.

The Top 5 Reasons Clients Fire a Financial Advisor
What drives investors to fire a financial advisor?
From saving for a down payment to planning for retirement, clients turn to advisors to guide them through life’s complex financial decisions. However, many of the key reasons for firing a financial advisor stem from emotional factors, and go beyond purely financial motivations.
We partnered with Morningstar to show the top reasons clients fire an advisor to provide insight on what’s driving investor behavior.
What Drives Firing Decisions?
Here are the top reasons clients terminated their advisor, based on a survey of 184 respondents:
| Reason for Firing | % of Respondents Citing This Reason | Type of Motivation |
|---|---|---|
| Quality of financial advice and services | 32% | Emotion-based reason |
| Quality of relationship | 21% | Emotion-based reason |
| Cost of services | 17% | Financial-based reason |
| Return performance | 11% | Financial-based reason |
| Comfort handling financial issues on their own | 10% | Emotion-based reason |
Numbers may not total 100 due to rounding. Respondents could select more than one answer.
Numbers may not total 100 due to rounding. Respondents could select more than one answer.
While firing an advisor is rare, many of the primary drivers behind firing decisions are also emotionally driven.
Often, advisors were fired due to the quality of the relationship. In many cases, this was due to an advisor not dedicating enough time to fully grasp their personal financial goals. Additionally, wealthier, and more financially literate clients are more likely to fire their advisors—highlighting the importance of understanding the client.
Key Takeaways
Given these driving factors, here are five ways that advisors can build a lasting relationship through recognizing their clients’ emotional needs:
- Understand your clients’ deeper goals
- Reach out proactively
- Act as a financial coach
- Keep clients updated
- Conduct goal-setting exercises on a regular basis
By communicating their value and setting expectations early, advisors can help prevent setbacks in their practice by adeptly recognizing the emotional motivators of their clients.
Markets in a Minute
The Top 5 Reasons Clients Hire a Financial Advisor
Here are the most common drivers for hiring a financial advisor, revealing that investor motivations go beyond just financial factors.

The Top 5 Reasons Clients Hire a Financial Advisor
What drives investors to hire a financial advisor?
From saving for a down payment to planning for retirement, clients turn to advisors to guide them through life’s complex financial decisions. However, many of the key reasons for hiring a financial advisor stem from emotional factors, and go beyond purely financial motivations.
We partnered with Morningstar to show the top reasons clients hire a financial advisor to provide insight on what’s driving investor behavior.
What Drives Hiring Decisions?
Here are the most common reasons for hiring an advisor, based on a survey of 312 respondents.
| Reason for Hiring | % of Respondents Citing This Reason | Type of Motivation |
|---|---|---|
| Specific goals or needs | 32% | Financial-based reason |
| Discomfort handling finances | 32% | Emotion-based reason |
| Behavioral coaching | 17% | Emotion-based reason |
| Recommended by family or friends | 12% | Emotion-based reason |
| Quality of relationship | 10% | Emotion-based reason |
Numbers may not total 100 due to rounding. Respondents could select more than one answer.
While financial factors played an important role in hiring decisions, emotional reasons made up the largest share of total responses.
This illustrates that clients place a high degree of importance on reaching specific goals or needs, and how an advisor communicates with them. Furthermore, clients seek out advisors for behavioral coaching to help them make informed decisions while staying the course.
Key Takeaways
With this in mind, here are five ways advisors can provide value to their clients and grow their practice:
- Address clients’ emotional needs early on
- Demonstrate how you can offer support
- Use ordinary language
- Provide education to help clients stay on track
- Acknowledge that these are issues we all face
By addressing emotional factors, advisors can more effectively help clients’ navigate intricate financial decisions and avoid common behavioral mistakes.

The Top 5 Reasons Clients Fire a Financial Advisor

The Top 5 Reasons Clients Hire a Financial Advisor

Visualizing the Growth of $100, by Asset Class

How Small Investments Make a Big Impact Over Time

What Were the Top Performing Investment Themes of 2023?
-

 Infographics2 years ago
The Top Investment Quotes Every Investor Should Know
-

 Markets in a Minute2 years ago
Mapped: The Growth in U.S. House Prices by State
-

 Markets in a Minute2 years ago
How Closely Related Are Historical Mortgage Rates and Housing Prices?
-

 Infographics2 years ago
A Visual Guide to Stagflation, Inflation, and Deflation
-

 Markets in a Minute1 year ago
Mapped: Global Energy Prices, by Country in 2022
-

 Markets in a Minute2 years ago
Visualizing Historical Oil Prices (1968-2022)
-

 Infographics1 year ago
Visual Guide: The Three Types of Economic Indicators
-

 Markets in a Minute2 years ago
Mapped: Global Macroeconomic Risk, by Country in 2022
