
Markets in a Minute
The $109 Trillion Global Stock Market in One Chart
The $109 Trillion Global Stock Market in One Chart
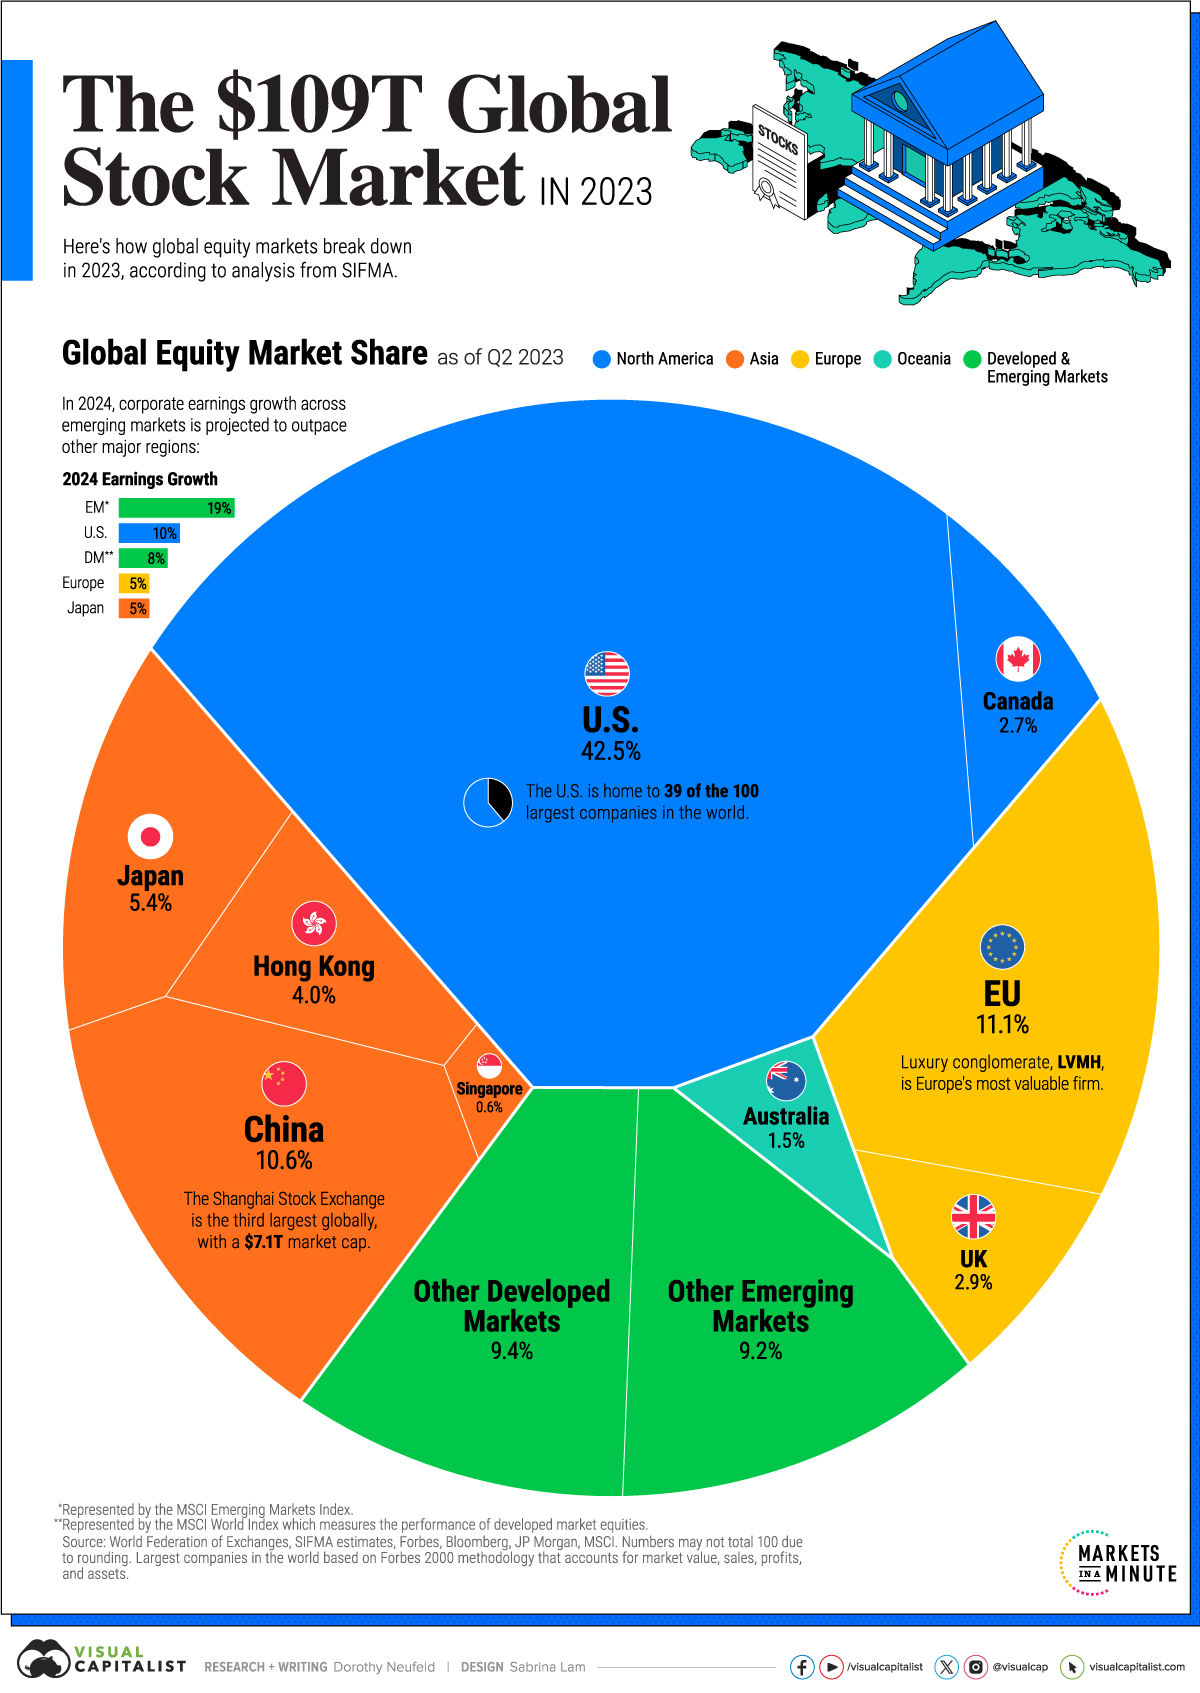
Global equity markets have nearly tripled in size since 2003, climbing to $109 trillion in total market capitalization.
Over the last several decades, the growth in money supply and ultra-low interest rates have underpinned rising asset values across economies.
Given this backdrop, the above graphic shows the size of the global stock market in 2023, based on data from the World Federation of Exchanges (WFE) and the Securities Industry and Financial Markets Association (SIFMA).
The Global Stock Market, by Share
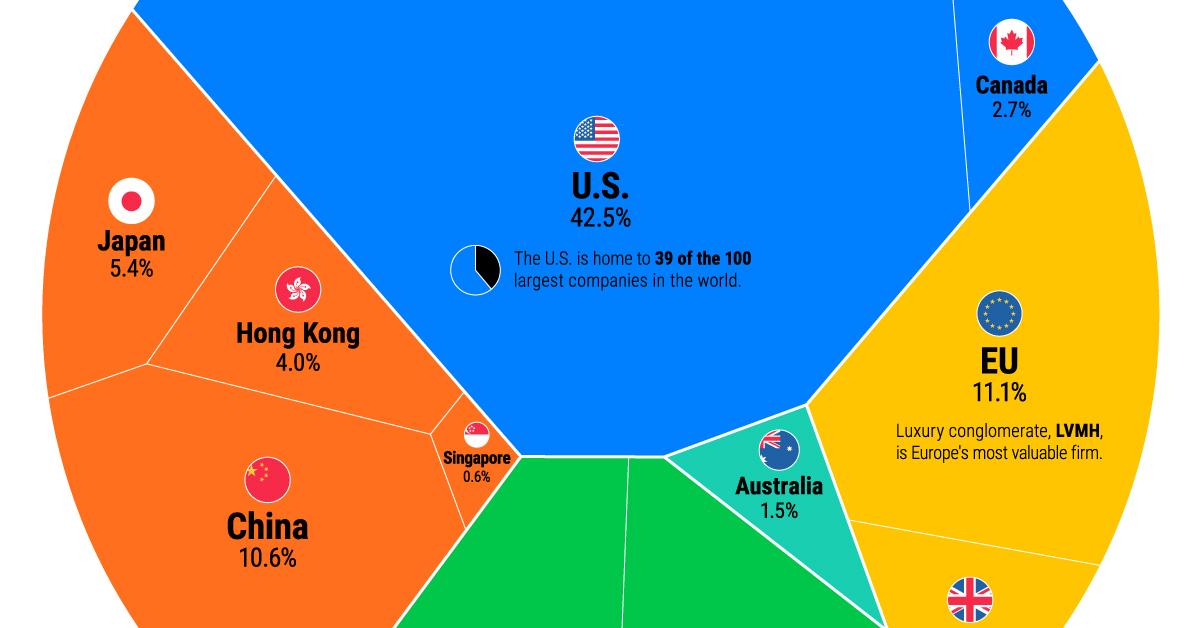
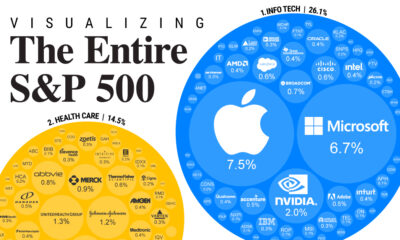
With the world’s deepest capital markets, the U.S. makes up 42.5% of global equity market capitalization, outpacing the next closest economy, the European Union by a significant margin.
Here are the world’s major equity markets based on global market cap share as of Q2 2023:
| Country / Region | Market Cap | Share (%) |
|---|---|---|
| 🇺🇸 U.S. | $46.2T | 42.5% |
| 🇪🇺 EU | $12.1T | 11.1% |
| 🇨🇳 China | $11.5T | 10.6% |
| 🇯🇵 Japan | $5.8T | 5.4% |
| 🇭🇰 Hong Kong | $4.3T | 4.0% |
| 🇬🇧 UK | $3.2T | 2.9% |
| 🇨🇦 Canada | $3.0T | 2.7% |
| 🇦🇺 Australia | $1.7T | 1.5% |
| 🇸🇬 Singapore | $0.6T | 0.6% |
| 🌏 Rest of Developed Markets | $10.2T | 9.4% |
| 🌍 Rest of Emerging Markets | $10.0T | 9.2% |
| Global Total | $108.6T | 100.0% |
Data as of Q2 2023. Numbers may not total 100 due to rounding..
Today, U.S. equity markets total over $46.2 trillion in market capitalization.
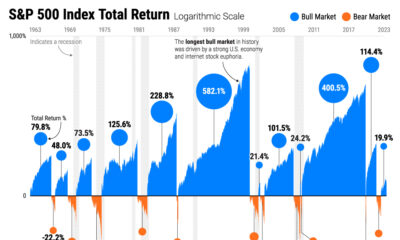
Compared to other rich nations, U.S. stocks have often outperformed over the last several decades. If an investor put $100 in the S&P 500 in 1990 this investment would have grown to about $2,000 in 2023, or four-fold the returns seen in other developed countries.
The second-largest equity market is the European Union at 11.1% of global share, followed by China, at 10.6%.
In the last 20 years, China’s economy has increased by roughly 12-fold, reaching $19.4 trillion this year. China’s equity markets have also grown considerably, fueled by the incorporation of Chinese domestic stocks into the MSCI Emerging Market Index in 2018, and earlier, with the internationalization of its equity markets in 2002.
Japan’s equity markets account for 5.4% of the global share, followed by Hong Kong, at 4%.
The Future Investment Landscape
Goldman Sachs projects that U.S. equity market capitalization will fall to 35% of the overall global market by 2030.
Meanwhile, emerging markets, including China and India, are collectively forecast to reach the 35% mark in the same timeframe. By 2050, the EM share is anticipated to far surpass the U.S., rising to 47% of global stock markets.
| Country / Region | Global Equity Market Share 2030 | Global Equity Market Share 2050 |
|---|---|---|
| 🇺🇸 U.S. | 34.7% | 26.9% |
| 🇪🇺 Euro Area | 8.3% | 7.9% |
| 🇨🇳 China | 14.1% | 15.0% |
| 🇮🇳 India | 4.1% | 8.3% |
| 🌏 Rest of Developed Markets | 21.5% | 17.8% |
| 🌍 Rest of Emerging Markets | 17.4% | 24.1% |
Numbers may not total 100 due to rounding.
The first factor underscoring this shift is the rapid growth projected for emerging economies.
Historically, as GDP per capita grows, capital markets in an economy become more sophisticated. We can see this in richer countries, which tend to have higher equitization of their markets.
India is projected to rise the fastest globally. By 2030, it is projected to account for 4.1% of global equity market cap. Furthermore, by 2050, this share is projected to outrank the euro area due to strong GDP per capita growth and demographic drivers.
The second factor, although to a lesser extent, is emerging market rising valuation multiples driven by higher GDP per capita. Richer countries, as seen in the U.S., often trade at higher earnings multiples because they are viewed to have lower risk.
Implications for Investors
What does this mean from an investment standpoint?
While the U.S. has outperformed in recent decades, it may not mean that it will continue on this trend, according to Goldman Sachs. Given the structural shifts stemming from growing populations and GDP growth, investors may consider diversifying their portfolios geographically looking ahead.


Markets in a Minute
The Top 5 Reasons Clients Fire a Financial Advisor
Firing an advisor is often driven by more than cost and performance factors. Here are the top reasons clients ‘break up’ with their advisors.

The Top 5 Reasons Clients Fire a Financial Advisor
What drives investors to fire a financial advisor?
From saving for a down payment to planning for retirement, clients turn to advisors to guide them through life’s complex financial decisions. However, many of the key reasons for firing a financial advisor stem from emotional factors, and go beyond purely financial motivations.
We partnered with Morningstar to show the top reasons clients fire an advisor to provide insight on what’s driving investor behavior.
What Drives Firing Decisions?
Here are the top reasons clients terminated their advisor, based on a survey of 184 respondents:
| Reason for Firing | % of Respondents Citing This Reason | Type of Motivation |
|---|---|---|
| Quality of financial advice and services | 32% | Emotion-based reason |
| Quality of relationship | 21% | Emotion-based reason |
| Cost of services | 17% | Financial-based reason |
| Return performance | 11% | Financial-based reason |
| Comfort handling financial issues on their own | 10% | Emotion-based reason |
Numbers may not total 100 due to rounding. Respondents could select more than one answer.
Numbers may not total 100 due to rounding. Respondents could select more than one answer.
While firing an advisor is rare, many of the primary drivers behind firing decisions are also emotionally driven.
Often, advisors were fired due to the quality of the relationship. In many cases, this was due to an advisor not dedicating enough time to fully grasp their personal financial goals. Additionally, wealthier, and more financially literate clients are more likely to fire their advisors—highlighting the importance of understanding the client.
Key Takeaways
Given these driving factors, here are five ways that advisors can build a lasting relationship through recognizing their clients’ emotional needs:
- Understand your clients’ deeper goals
- Reach out proactively
- Act as a financial coach
- Keep clients updated
- Conduct goal-setting exercises on a regular basis
By communicating their value and setting expectations early, advisors can help prevent setbacks in their practice by adeptly recognizing the emotional motivators of their clients.
Markets in a Minute
The Top 5 Reasons Clients Hire a Financial Advisor
Here are the most common drivers for hiring a financial advisor, revealing that investor motivations go beyond just financial factors.

The Top 5 Reasons Clients Hire a Financial Advisor
What drives investors to hire a financial advisor?
From saving for a down payment to planning for retirement, clients turn to advisors to guide them through life’s complex financial decisions. However, many of the key reasons for hiring a financial advisor stem from emotional factors, and go beyond purely financial motivations.
We partnered with Morningstar to show the top reasons clients hire a financial advisor to provide insight on what’s driving investor behavior.
What Drives Hiring Decisions?
Here are the most common reasons for hiring an advisor, based on a survey of 312 respondents.
| Reason for Hiring | % of Respondents Citing This Reason | Type of Motivation |
|---|---|---|
| Specific goals or needs | 32% | Financial-based reason |
| Discomfort handling finances | 32% | Emotion-based reason |
| Behavioral coaching | 17% | Emotion-based reason |
| Recommended by family or friends | 12% | Emotion-based reason |
| Quality of relationship | 10% | Emotion-based reason |
Numbers may not total 100 due to rounding. Respondents could select more than one answer.
While financial factors played an important role in hiring decisions, emotional reasons made up the largest share of total responses.
This illustrates that clients place a high degree of importance on reaching specific goals or needs, and how an advisor communicates with them. Furthermore, clients seek out advisors for behavioral coaching to help them make informed decisions while staying the course.
Key Takeaways
With this in mind, here are five ways advisors can provide value to their clients and grow their practice:
- Address clients’ emotional needs early on
- Demonstrate how you can offer support
- Use ordinary language
- Provide education to help clients stay on track
- Acknowledge that these are issues we all face
By addressing emotional factors, advisors can more effectively help clients’ navigate intricate financial decisions and avoid common behavioral mistakes.

The Top 5 Reasons Clients Fire a Financial Advisor

The Top 5 Reasons Clients Hire a Financial Advisor

Visualizing the Growth of $100, by Asset Class

How Small Investments Make a Big Impact Over Time

What Were the Top Performing Investment Themes of 2023?
-

 Infographics2 years ago
The Top Investment Quotes Every Investor Should Know
-

 Markets in a Minute2 years ago
Mapped: The Growth in U.S. House Prices by State
-

 Markets in a Minute2 years ago
How Closely Related Are Historical Mortgage Rates and Housing Prices?
-

 Infographics2 years ago
A Visual Guide to Stagflation, Inflation, and Deflation
-

 Markets in a Minute1 year ago
Mapped: Global Energy Prices, by Country in 2022
-

 Markets in a Minute2 years ago
Visualizing Historical Oil Prices (1968-2022)
-

 Infographics1 year ago
Visual Guide: The Three Types of Economic Indicators
-

 Markets in a Minute2 years ago
Mapped: Global Macroeconomic Risk, by Country in 2022
