
Markets in a Minute
The Fastest Rising Asset Classes in 2023
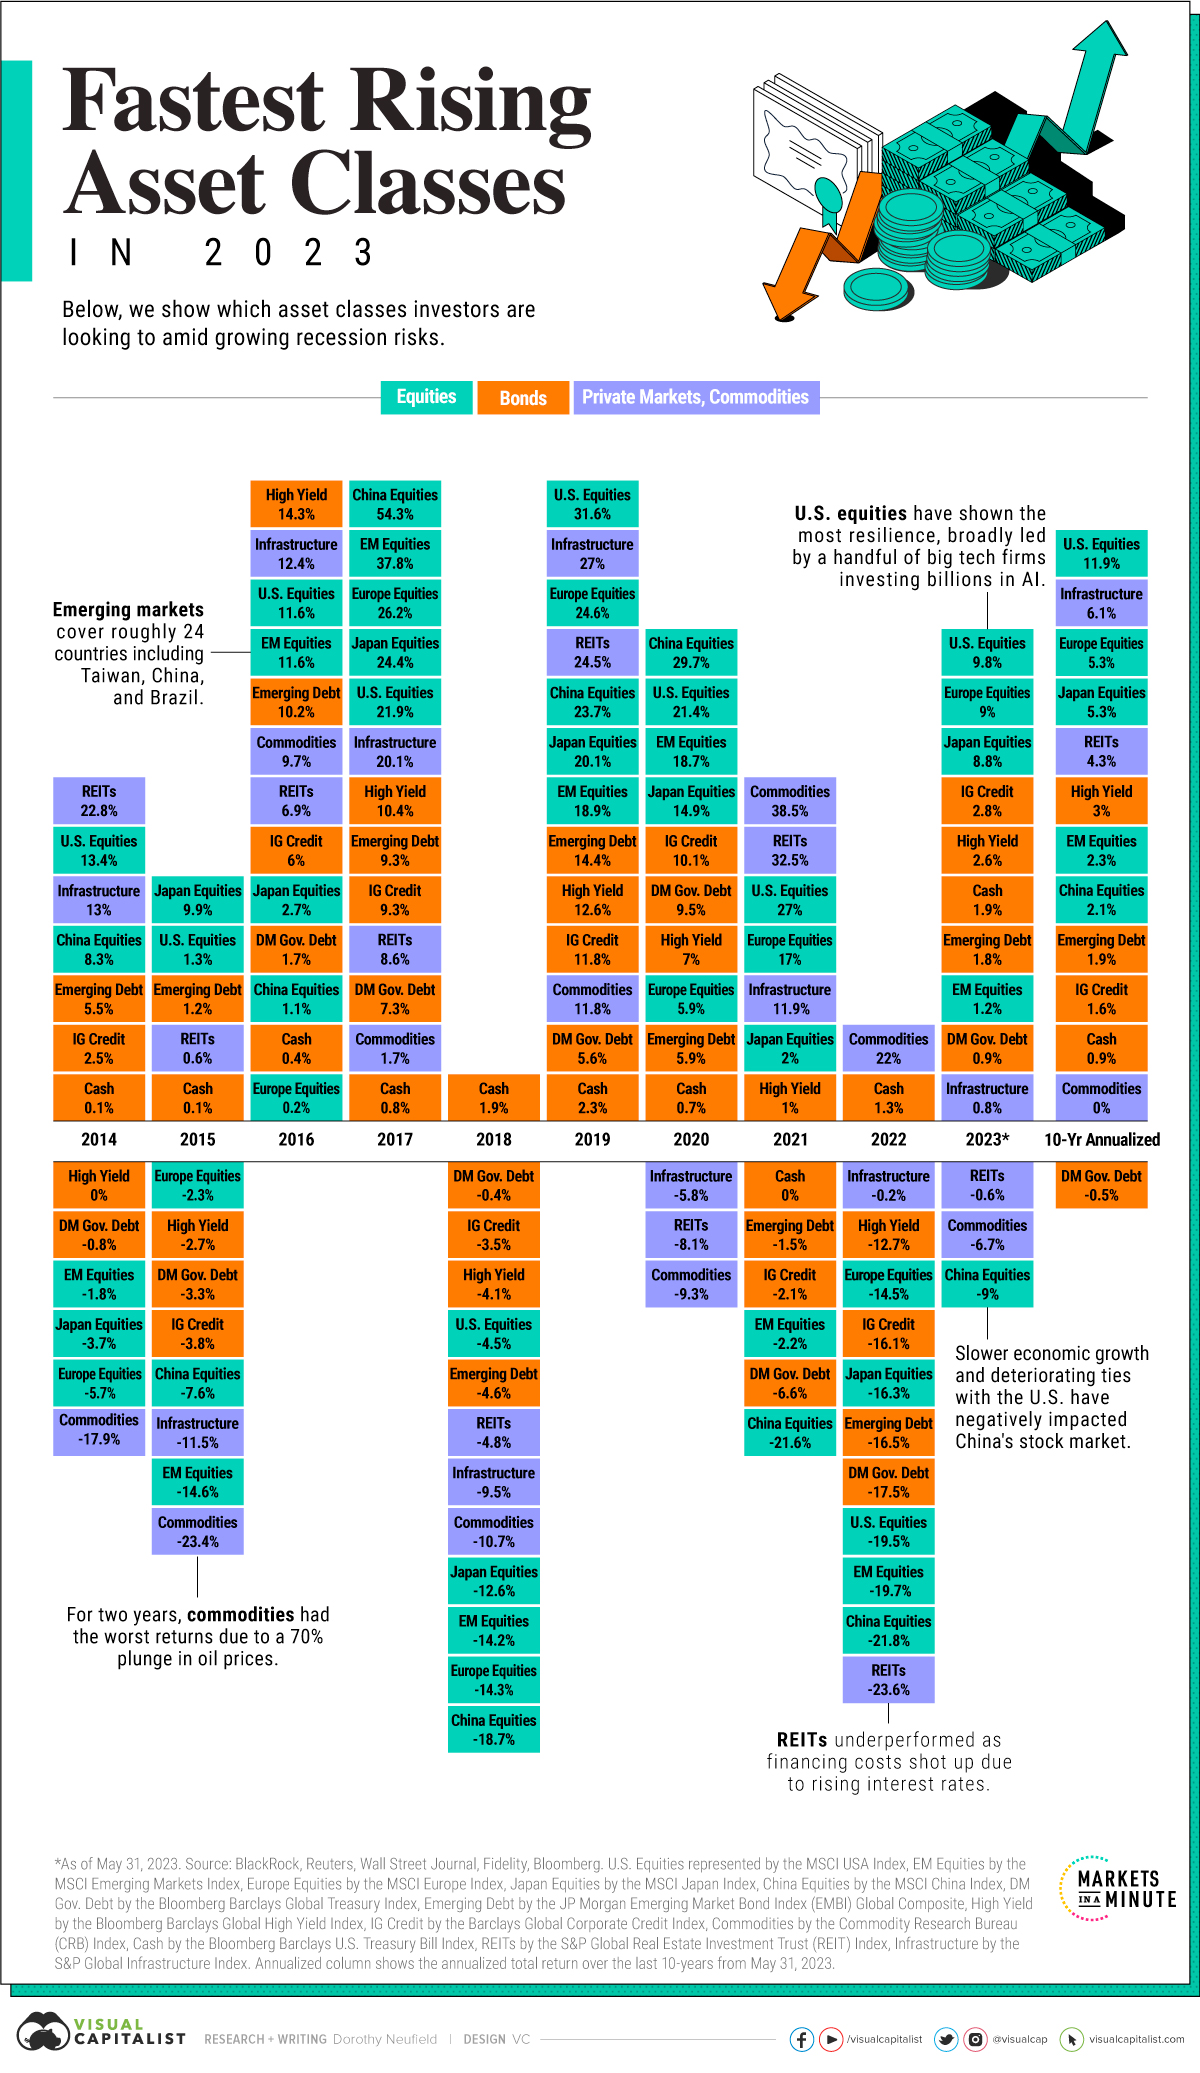
The Fastest Rising Asset Classes in 2023
Many corners of the market have shown resilience despite persistent inflation and slowing economic growth in 2023. U.S. equities, international equities, and a variety of bonds have seen positive returns so far this year.
In the above graphic, we rank the top-performing asset classes to date with data from BlackRock.
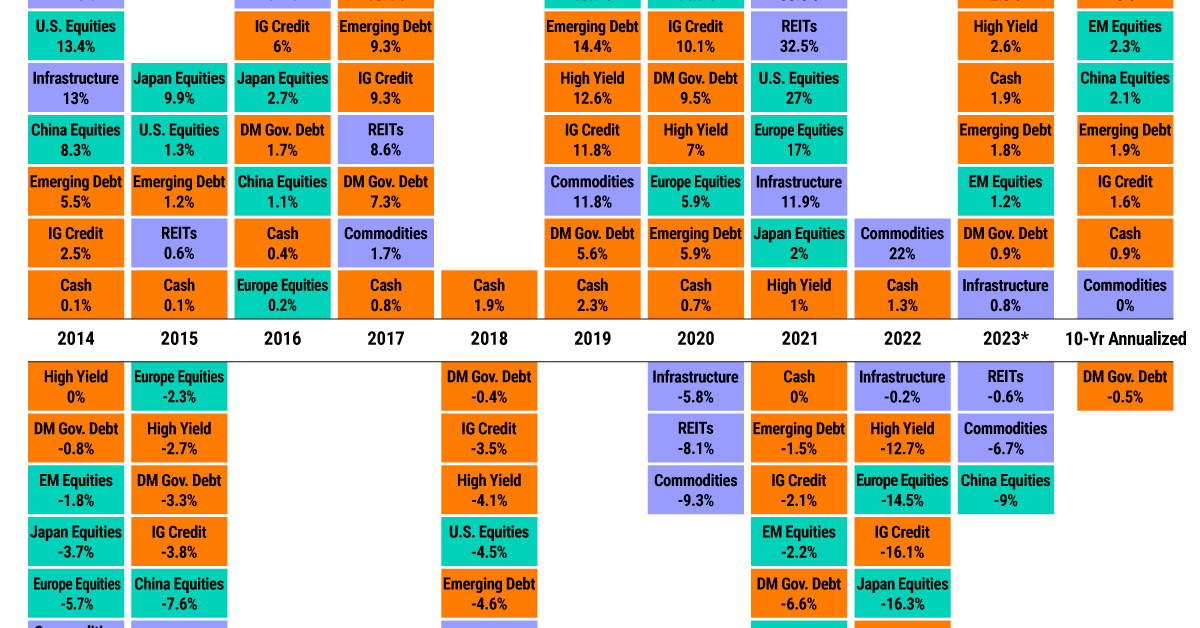
Asset Class Performance, Ranked
Here’s how select asset classes have performed in 2023 as of May 31:
| Asset Type | 2023 Return (as of May 31) | 10-Year Annualized Return |
|---|---|---|
| U.S. Equities | 9.8% | 11.9% |
| Europe Equities | 9.0% | 5.3% |
| Japan Equities | 8.8% | 5.3% |
| Investment Grade Credit | 2.8% | 1.6% |
| High Yield Bonds | 2.6% | 3.0% |
| Cash | 1.9% | 0.9% |
| Emerging Market Debt | 1.8% | 1.9% |
| Emerging Market Equities | 1.2% | 2.3% |
| Developing Market Gov. Debt | 0.9% | -0.5% |
| Infrastructure | 0.8% | 6.1% |
| REITs | -0.6% | 4.3% |
| Commodities | -6.7% | 0.0% |
| China Equities | -9.0% | 2.1% |
After a troublesome 2022 for markets, you can see above that U.S. equities have rebounded the fastest in 2023. They are sitting at 9.8% returns year-to-date.
However, this has largely been a story of a few outperformers buoying the overall market. Nvidia with 159% returns, along with Meta (120%), Apple (36%), and Microsoft (37%) are among the companies with strong growth. Many of these companies are investing billions in artificial intelligence.
European equities, at 9% returns, have also seen steady performance. Investors have flocked to the market, given the tilt to value stocks during rising rates.
Globally, bonds fall roughly in the middle of the pack, while commodities have fallen 6.7% on the year so far. China’s equity market has faced headwinds amid strained economic ties with the U.S. and economic data falling under expectations.
Bull Market On the Horizon?
Tech funds saw a record $8.5 billion in weekly inflows as of May 31, 2023 driven by AI enthusiasm.
As investors pour into these megacap stocks, S&P 500 returns have rebounded almost 20% from their October lows, moving closer into bull market territory.
As it stands, investor optimism has increased across the broader market. The investor fear gauge hovered near its lowest point since February 2020. The CBOE Volatility Index (VIX) sank to 15, a significant drop from its average reading of 23 over the past year.


Markets in a Minute
The Top 5 Reasons Clients Fire a Financial Advisor
Firing an advisor is often driven by more than cost and performance factors. Here are the top reasons clients ‘break up’ with their advisors.

The Top 5 Reasons Clients Fire a Financial Advisor
What drives investors to fire a financial advisor?
From saving for a down payment to planning for retirement, clients turn to advisors to guide them through life’s complex financial decisions. However, many of the key reasons for firing a financial advisor stem from emotional factors, and go beyond purely financial motivations.
We partnered with Morningstar to show the top reasons clients fire an advisor to provide insight on what’s driving investor behavior.
What Drives Firing Decisions?
Here are the top reasons clients terminated their advisor, based on a survey of 184 respondents:
| Reason for Firing | % of Respondents Citing This Reason | Type of Motivation |
|---|---|---|
| Quality of financial advice and services | 32% | Emotion-based reason |
| Quality of relationship | 21% | Emotion-based reason |
| Cost of services | 17% | Financial-based reason |
| Return performance | 11% | Financial-based reason |
| Comfort handling financial issues on their own | 10% | Emotion-based reason |
Numbers may not total 100 due to rounding. Respondents could select more than one answer.
Numbers may not total 100 due to rounding. Respondents could select more than one answer.
While firing an advisor is rare, many of the primary drivers behind firing decisions are also emotionally driven.
Often, advisors were fired due to the quality of the relationship. In many cases, this was due to an advisor not dedicating enough time to fully grasp their personal financial goals. Additionally, wealthier, and more financially literate clients are more likely to fire their advisors—highlighting the importance of understanding the client.
Key Takeaways
Given these driving factors, here are five ways that advisors can build a lasting relationship through recognizing their clients’ emotional needs:
- Understand your clients’ deeper goals
- Reach out proactively
- Act as a financial coach
- Keep clients updated
- Conduct goal-setting exercises on a regular basis
By communicating their value and setting expectations early, advisors can help prevent setbacks in their practice by adeptly recognizing the emotional motivators of their clients.
Markets in a Minute
The Top 5 Reasons Clients Hire a Financial Advisor
Here are the most common drivers for hiring a financial advisor, revealing that investor motivations go beyond just financial factors.

The Top 5 Reasons Clients Hire a Financial Advisor
What drives investors to hire a financial advisor?
From saving for a down payment to planning for retirement, clients turn to advisors to guide them through life’s complex financial decisions. However, many of the key reasons for hiring a financial advisor stem from emotional factors, and go beyond purely financial motivations.
We partnered with Morningstar to show the top reasons clients hire a financial advisor to provide insight on what’s driving investor behavior.
What Drives Hiring Decisions?
Here are the most common reasons for hiring an advisor, based on a survey of 312 respondents.
| Reason for Hiring | % of Respondents Citing This Reason | Type of Motivation |
|---|---|---|
| Specific goals or needs | 32% | Financial-based reason |
| Discomfort handling finances | 32% | Emotion-based reason |
| Behavioral coaching | 17% | Emotion-based reason |
| Recommended by family or friends | 12% | Emotion-based reason |
| Quality of relationship | 10% | Emotion-based reason |
Numbers may not total 100 due to rounding. Respondents could select more than one answer.
While financial factors played an important role in hiring decisions, emotional reasons made up the largest share of total responses.
This illustrates that clients place a high degree of importance on reaching specific goals or needs, and how an advisor communicates with them. Furthermore, clients seek out advisors for behavioral coaching to help them make informed decisions while staying the course.
Key Takeaways
With this in mind, here are five ways advisors can provide value to their clients and grow their practice:
- Address clients’ emotional needs early on
- Demonstrate how you can offer support
- Use ordinary language
- Provide education to help clients stay on track
- Acknowledge that these are issues we all face
By addressing emotional factors, advisors can more effectively help clients’ navigate intricate financial decisions and avoid common behavioral mistakes.

The Top 5 Reasons Clients Fire a Financial Advisor

The Top 5 Reasons Clients Hire a Financial Advisor

Visualizing the Growth of $100, by Asset Class

How Small Investments Make a Big Impact Over Time

What Were the Top Performing Investment Themes of 2023?
-

 Infographics2 years ago
The Top Investment Quotes Every Investor Should Know
-

 Markets in a Minute2 years ago
Mapped: The Growth in U.S. House Prices by State
-

 Markets in a Minute2 years ago
How Closely Related Are Historical Mortgage Rates and Housing Prices?
-

 Infographics2 years ago
A Visual Guide to Stagflation, Inflation, and Deflation
-

 Markets in a Minute1 year ago
Mapped: Global Energy Prices, by Country in 2022
-

 Infographics3 years ago
The 5 Fastest Growing Industries of the Next Decade
-

 Markets in a Minute2 years ago
Visualizing Historical Oil Prices (1968-2022)
-

 Infographics1 year ago
Visual Guide: The Three Types of Economic Indicators
