
Markets in a Minute
Visualizing Historical Oil Prices (1968-2022)
This infographic is available as a poster.
This infographic is available as a poster.
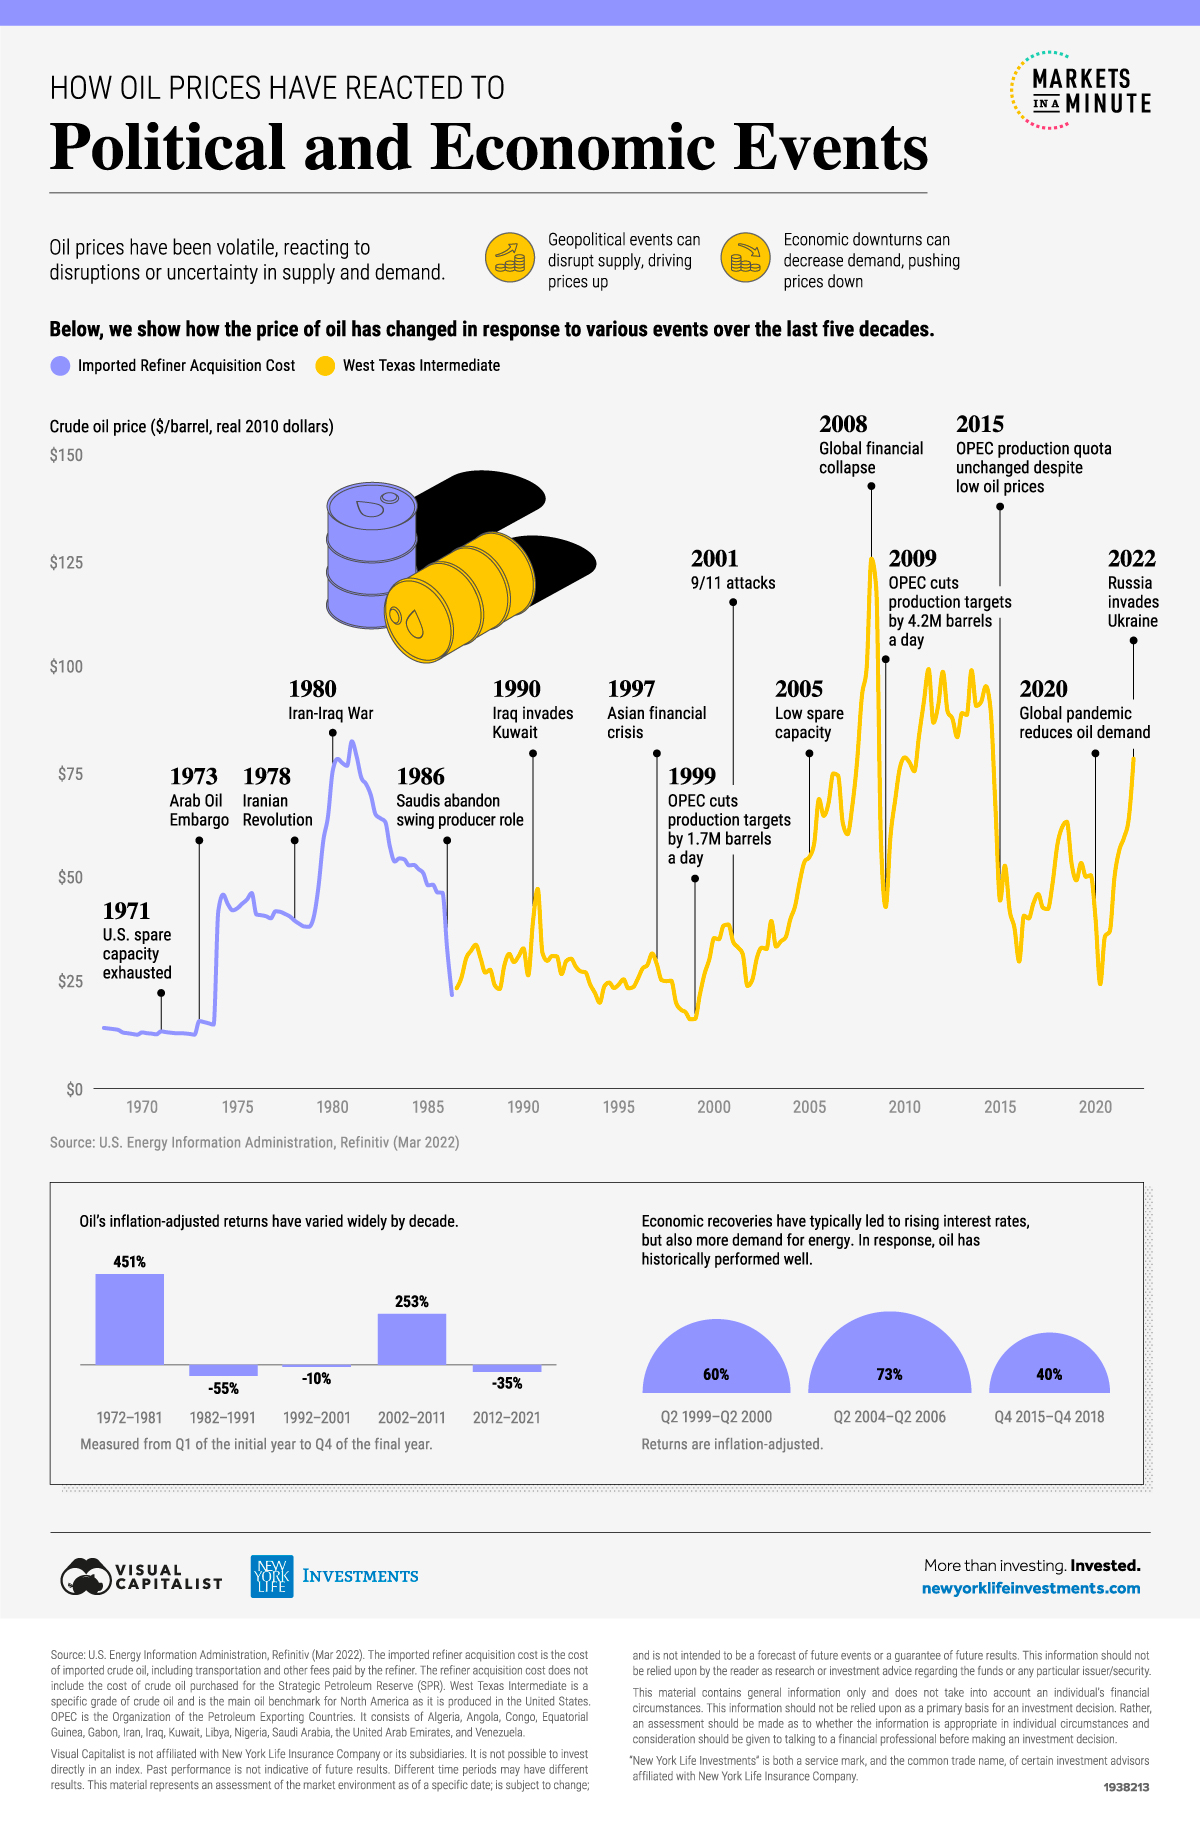
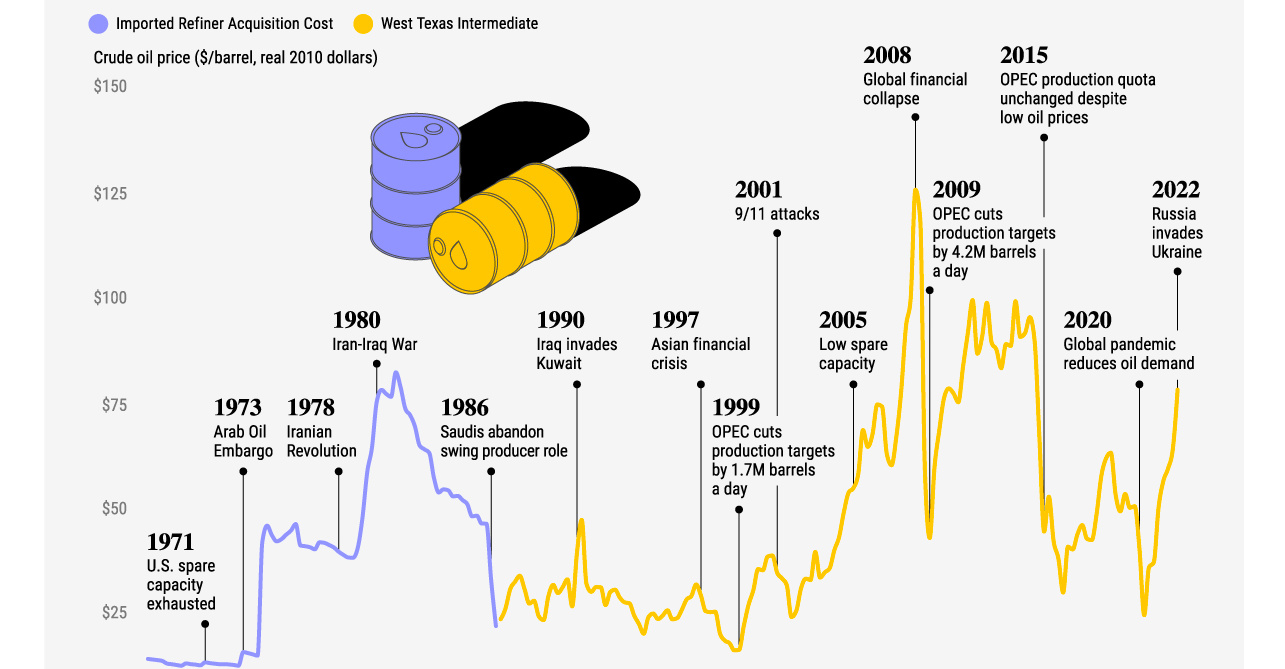
Historical Oil Prices (1968-2022)
Amid Russia’s invasion of Ukraine, the inflation-adjusted price of oil reached a seven-year high. Russia is one of the world’s largest producers of crude oil, and many countries have announced a ban on Russian oil imports amid the war. This has led to supply uncertainties and, therefore, rising prices.
How does the price increase compare to previous political and economic events? In this Markets in a Minute from New York Life Investments, we look at historical oil prices since 1968.
The Fundamentals Behind Oil Prices
Before diving into the data, it’s worth explaining why historical oil prices have seen so much volatility. This mainly stems from the fact that the supply and demand of oil tends to have a low responsiveness to price changes in the short term.
- On the supply side, oil production capacity can be challenging to change quickly. Drilling a new oil well is a lengthy and complex process.
- On the demand side, it can be quite difficult to change equipment that uses petroleum products. For instance, in the short term, people will keep driving their cars to work despite higher gas prices.
For these reasons, in order to re-balance supply and demand, it takes a sufficiently large price change to occur. For example, if gas prices were to double, only then may enough commuters consider taking public transit or changing behavior in other ways.
What kind of events can shock the system enough to drive big price changes?
A large portion of the world’s oil is located in regions that are prone to political conflict. Political events can disrupt the actual or perceived supply of oil, and drive prices upwards. On the other hand, an economic downturn reduces energy demand and can depress prices.
Looking Back at Historical Oil Prices
To compare how events have influenced historical oil prices, we used data from the U.S. Energy Information Administration. It should be noted that the data extends to March 31, 2022, and does not reflect the recent price dips in response to Shanghai lockdowns and U.S. rate hikes.
Here is the inflation-adjusted price of a barrel of crude oil during select events.
| Date | Event | Crude Oil Price per Barrel Real 2010 Dollars |
|---|---|---|
| Q1 1971 | U.S. spare capacity exhausted | $13.47 |
| Q1 1973 | Arab Oil Embargo | $15.90 |
| Q1 1974 | Embargo lifted | $42.00 |
| Q1 1978 | Iranian Revolution | $39.65 |
| Q3 1980 | Official start of Iran-Iraq war | $76.93 |
| Q1 1986 | Saudis abandon swing producer role | $32.90 |
| Q2 1990 | Trough price prior to Iraq's invasion of Kuwait | $26.72 |
| Q3 1990 | Iraq invades Kuwait | $39.37 |
| Q4 1990 | Peak price during invasion | $47.15 |
| Q2 1991 | Iraq accepts UN resolution to end conflict | $30.18 |
| Q4 1996 | Peak price prior to Asian financial crisis | $31.88 |
| Q3 1997 | Asian financial crisis begins | $25.35 |
| Q1 1999 | OPEC cuts production target by 1.7M b/d | $16.41 |
| Q4 2000 | Peak price prior to 9/11 | $38.73 |
| Q3 2001 | 9/11 attacks | $31.76 |
| Q4 2001 | Trough price after 9/11 | $24.22 |
| Q1 2005 | Low spare capacity | $54.71 |
| Q2 2008 | Peak price before global financial collapse | $125.21 |
| Q1 2009 | OPEC cuts production targets by 4.2M b/d | $42.89 |
| Q2 2014 | Peak price prior to supply gut price collapse | $95.07 |
| Q1 2015 | OPEC production quota unchanged despite low prices | $44.41 |
| Q4 2019 | Price immediately prior to global pandemic | $50.38 |
| Q1 2020 | COVID-19 declared a pandemic | $40.34 |
| Q2 2020 | Trough price during global pandemic | $24.65 |
| Q1 2022 | Russia invades Ukraine | $77.94 |
From the first quarter of 1968 until the second quarter of 1986, data reflects the reporter refiner acquisition cost. From the third quarter of 1986 to the first quarter of 2022, data reflects the West Texas Intermediate cost.
In 1973, the Organization of the Petroleum Exporting Countries (OPEC) announced an embargo (ban) on oil exports to the United States. The move was in response to the U.S. providing military aid to Israel. By the time the embargo ended in March 1974, the inflation-adjusted price of crude oil had risen 164%. The embargo also led to a selloff in the stock market, with the recovery taking almost six years.
Historical oil prices rose rapidly from 2004-2008. During that time, economic growth was fueling oil demand but there was little spare production capacity. By the second quarter of 2008, inflation-adjusted oil prices hit a high of $125 per barrel. They crashed by 66% shortly thereafter due to the global financial crisis.
Most recently, the COVID-19 pandemic and associated containment measures caused historical oil prices to drop by nearly 40% in three months. Oil prices have since risen 216% from their pandemic low, as of the first quarter of 2022. This is due to the economic recovery and Russia’s invasion of Ukraine.
Oil as an Investment
Investors’ interest in oil as an alternative investment has risen in recent years. Given the high volatility in historical oil prices, investors may want to consider their comfort with this level of risk. Of course, an investor’s sustainability goals may also be a factor when choosing whether to invest in oil.
However, oil also presents opportunities. It has had low-to-negative correlation with U.S. bonds in recent years and may help investors diversify their portfolios. Not only that, it may help investors manage rising interest rates. An economic recovery typically leads to rising interest rates, but also more energy demand. Oil prices have historically climbed during these periods.


Markets in a Minute
The Top 5 Reasons Clients Fire a Financial Advisor
Firing an advisor is often driven by more than cost and performance factors. Here are the top reasons clients ‘break up’ with their advisors.

The Top 5 Reasons Clients Fire a Financial Advisor
What drives investors to fire a financial advisor?
From saving for a down payment to planning for retirement, clients turn to advisors to guide them through life’s complex financial decisions. However, many of the key reasons for firing a financial advisor stem from emotional factors, and go beyond purely financial motivations.
We partnered with Morningstar to show the top reasons clients fire an advisor to provide insight on what’s driving investor behavior.
What Drives Firing Decisions?
Here are the top reasons clients terminated their advisor, based on a survey of 184 respondents:
| Reason for Firing | % of Respondents Citing This Reason | Type of Motivation |
|---|---|---|
| Quality of financial advice and services | 32% | Emotion-based reason |
| Quality of relationship | 21% | Emotion-based reason |
| Cost of services | 17% | Financial-based reason |
| Return performance | 11% | Financial-based reason |
| Comfort handling financial issues on their own | 10% | Emotion-based reason |
Numbers may not total 100 due to rounding. Respondents could select more than one answer.
Numbers may not total 100 due to rounding. Respondents could select more than one answer.
While firing an advisor is rare, many of the primary drivers behind firing decisions are also emotionally driven.
Often, advisors were fired due to the quality of the relationship. In many cases, this was due to an advisor not dedicating enough time to fully grasp their personal financial goals. Additionally, wealthier, and more financially literate clients are more likely to fire their advisors—highlighting the importance of understanding the client.
Key Takeaways
Given these driving factors, here are five ways that advisors can build a lasting relationship through recognizing their clients’ emotional needs:
- Understand your clients’ deeper goals
- Reach out proactively
- Act as a financial coach
- Keep clients updated
- Conduct goal-setting exercises on a regular basis
By communicating their value and setting expectations early, advisors can help prevent setbacks in their practice by adeptly recognizing the emotional motivators of their clients.
Markets in a Minute
The Top 5 Reasons Clients Hire a Financial Advisor
Here are the most common drivers for hiring a financial advisor, revealing that investor motivations go beyond just financial factors.

The Top 5 Reasons Clients Hire a Financial Advisor
What drives investors to hire a financial advisor?
From saving for a down payment to planning for retirement, clients turn to advisors to guide them through life’s complex financial decisions. However, many of the key reasons for hiring a financial advisor stem from emotional factors, and go beyond purely financial motivations.
We partnered with Morningstar to show the top reasons clients hire a financial advisor to provide insight on what’s driving investor behavior.
What Drives Hiring Decisions?
Here are the most common reasons for hiring an advisor, based on a survey of 312 respondents.
| Reason for Hiring | % of Respondents Citing This Reason | Type of Motivation |
|---|---|---|
| Specific goals or needs | 32% | Financial-based reason |
| Discomfort handling finances | 32% | Emotion-based reason |
| Behavioral coaching | 17% | Emotion-based reason |
| Recommended by family or friends | 12% | Emotion-based reason |
| Quality of relationship | 10% | Emotion-based reason |
Numbers may not total 100 due to rounding. Respondents could select more than one answer.
While financial factors played an important role in hiring decisions, emotional reasons made up the largest share of total responses.
This illustrates that clients place a high degree of importance on reaching specific goals or needs, and how an advisor communicates with them. Furthermore, clients seek out advisors for behavioral coaching to help them make informed decisions while staying the course.
Key Takeaways
With this in mind, here are five ways advisors can provide value to their clients and grow their practice:
- Address clients’ emotional needs early on
- Demonstrate how you can offer support
- Use ordinary language
- Provide education to help clients stay on track
- Acknowledge that these are issues we all face
By addressing emotional factors, advisors can more effectively help clients’ navigate intricate financial decisions and avoid common behavioral mistakes.

The Top 5 Reasons Clients Fire a Financial Advisor

The Top 5 Reasons Clients Hire a Financial Advisor

Visualizing the Growth of $100, by Asset Class

How Small Investments Make a Big Impact Over Time

What Were the Top Performing Investment Themes of 2023?
-

 Infographics2 years ago
The Top Investment Quotes Every Investor Should Know
-

 Markets in a Minute2 years ago
Mapped: The Growth in U.S. House Prices by State
-

 Markets in a Minute2 years ago
How Closely Related Are Historical Mortgage Rates and Housing Prices?
-

 Infographics2 years ago
A Visual Guide to Stagflation, Inflation, and Deflation
-

 Markets in a Minute1 year ago
Mapped: Global Energy Prices, by Country in 2022
-

 Infographics3 years ago
The 5 Fastest Growing Industries of the Next Decade
-

 Infographics1 year ago
Visual Guide: The Three Types of Economic Indicators
-

 Markets in a Minute1 year ago
Mapped: Global Macroeconomic Risk, by Country in 2022
