
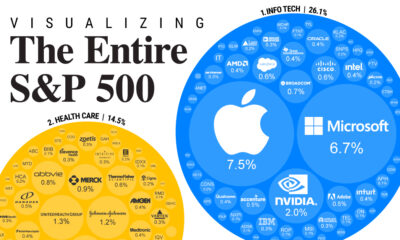
Markets in a Minute
The Top Performing S&P 500 Sectors Over the Business Cycle
The Top Performing S&P 500 Sectors Over the Business Cycle
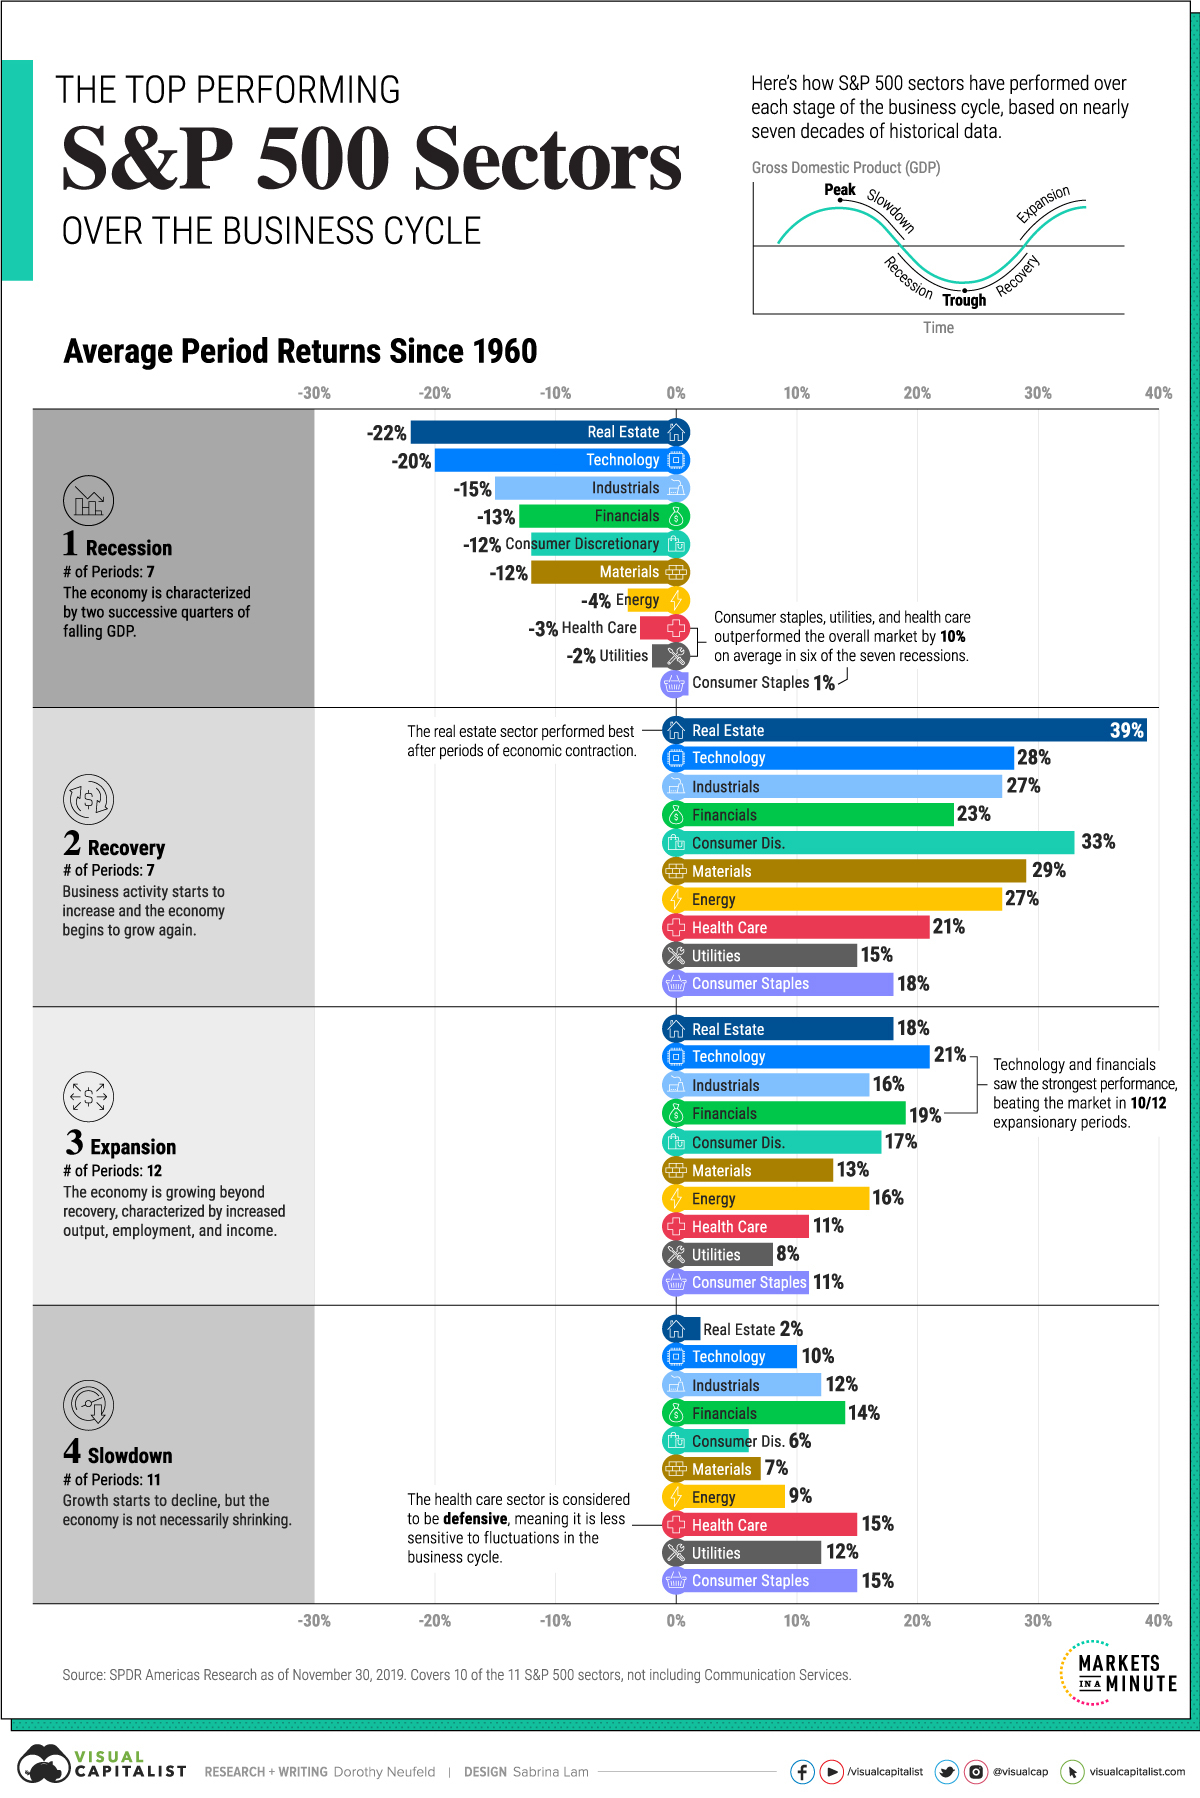
The business cycle fluctuates over time, from the highs of an expansion to the lows of a recession, and each phase impacts the performance of S&P 500 sectors differently.
And though affected sectors have different levels of average performance, any given period may see the outperformance of certain sectors due to external factors, such as technological advancements or high-impact global events (i.e. global pandemics, international conflicts, etc.)
The above graphic uses data from SPDR Americas Research to show the top performing sectors through the business cycle over almost 70 years.
The Business Cycle: Methodology
The dataset is based on the Conference Board’s Leading Economic Index, which assesses U.S. economic activity. This index includes 10 economic indicators that reveal typical turning points in the business cycle covering employment, consumer expectations, and financial conditions.
Overall from December 1, 1960 to November 30, 2019, the dataset covers:
- 7 recessions
- 7 recoveries
- 12 expansions
- 11 slowdowns
Returns are shown for all of the S&P 500 sectors with the exception of the communication services sector. This is because the sector was created relatively recently in 2018 and comprises previous technology, consumer discretionary, and telecommunication stocks already covered in the dataset.
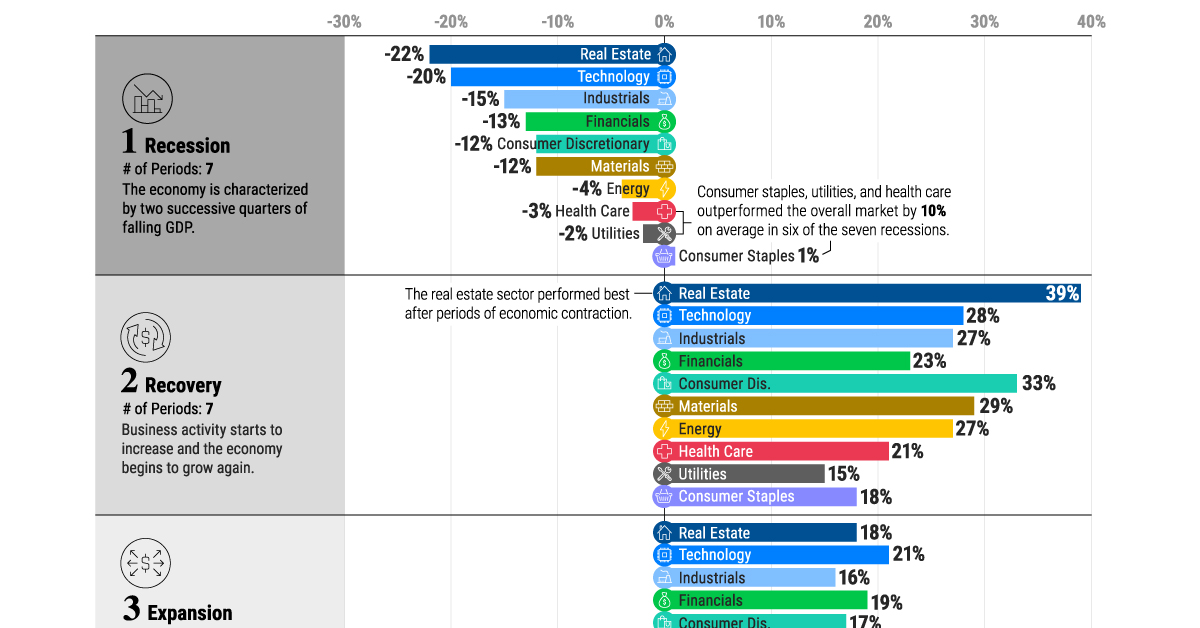
1. Recession
Broadly speaking, a recession is a period of temporary economic decline characterized by two successive quarters of falling GDP.
During this period, consumer staples was the top performing S&P 500 sector, and the only one that has averaged a positive return. Utilities and health care, traditionally defensive sectors, followed next in line. Together, these sectors averaged 10% higher returns than the overall market during six of the seven recessions.
| Rank | S&P 500 Sector | Average Period Return |
|---|---|---|
| 1 | Consumer Staples | +1% |
| 2 | Utilities | -2% |
| 3 | Health Care | -3% |
| 4 | Energy | -4% |
| 5 | Materials | -12% |
| 6 | Consumer Discretionary | -12% |
| 7 | Financials | -13% |
| 8 | Industrials | -15% |
| 9 | Technology | -20% |
| 10 | Real Estate | -22% |
Real estate has been the worst performer during recessions, given its high sensitivity to discretionary spending as both household income and business activity tend to decline.
2. Recovery
A recovery is the phase following a recession where economic activity starts to increase and the economy begins to grow again.
Real estate outperformed all other sectors with an average 39% return. As monetary policy eases and interest rates fall historically after recessions, this makes purchasing real estate more affordable, in turn supporting the sector’s performance.
| Rank | S&P 500 Sector | Average Period Return |
|---|---|---|
| 1 | Real Estate | +39% |
| 2 | Consumer Discretionary | +33% |
| 3 | Materials | +29% |
| 4 | Technology | +28% |
| 5 | Industrials | +27% |
| 6 | Energy | +27% |
| 7 | Financials | +23% |
| 8 | Health Care | +21% |
| 9 | Consumer Staples | +18% |
| 10 | Utilities | +15% |
We can see in the above table that all sectors posted double-digit returns as consumer confidence and labor market conditions improved during recoveries.
3. Expansion
In this phase of the business cycle, the economy is growing beyond recovery. It is characterized by increased economic output, employment, and income.
Interestingly, market returns were the second-best overall after recoveries. Top sectors included technology (21%), financials (19%), and real estate (18%) as economic activity climbed to its peak.
| Rank | S&P 500 Sector | Average Period Return |
|---|---|---|
| 1 | Technology | +21% |
| 2 | Financials | +19% |
| 3 | Real Estate | +18% |
| 4 | Consumer Discretionary | +17% |
| 5 | Industrials | +16% |
| 6 | Energy | +16% |
| 7 | Materials | +13% |
| 8 | Health Care | +11% |
| 9 | Consumer Staples | +11% |
| 10 | Utilities | +8% |
The utilities sector has historically seen the slowest growth across all sectors as investors tend to favor cyclical S&P 500 sectors that rise with an expanding economy.
4. Slowdown
This phase is often considered a peak in the business cycle, where growth starts to decline, but the economy is not necessarily shrinking.
With 15% average returns, health care excelled during slowdowns. Often, investors reduce their exposure to cyclical sectors as they prepare for an economic downturn, looking for more defensive investments. Similarly, consumer staples saw strong performance on average.
| Rank | S&P 500 Sector | Average Period Return |
|---|---|---|
| 1 | Health Care | +15% |
| 2 | Consumer Staples | +15% |
| 3 | Financials | +14% |
| 4 | Industrials | +12% |
| 5 | Utilities | +12% |
| 5 | Technology | +10% |
| 7 | Energy | +9% |
| 8 | Materials | +7% |
| 9 | Consumer Discretionary | +6% |
| 10 | Real Estate | +2% |
Just as real estate saw a steep drop-off during recessions, it witnessed the lowest relative returns when the economy slows and costs tend to increase.
The Case for Diversification
The above data highlights how having a diversified portfolio of investments can help reduce sector-specific risk given the distinct performance trends of individual sectors over the business cycle.


Markets in a Minute
The Top 5 Reasons Clients Fire a Financial Advisor
Firing an advisor is often driven by more than cost and performance factors. Here are the top reasons clients ‘break up’ with their advisors.

The Top 5 Reasons Clients Fire a Financial Advisor
What drives investors to fire a financial advisor?
From saving for a down payment to planning for retirement, clients turn to advisors to guide them through life’s complex financial decisions. However, many of the key reasons for firing a financial advisor stem from emotional factors, and go beyond purely financial motivations.
We partnered with Morningstar to show the top reasons clients fire an advisor to provide insight on what’s driving investor behavior.
What Drives Firing Decisions?
Here are the top reasons clients terminated their advisor, based on a survey of 184 respondents:
| Reason for Firing | % of Respondents Citing This Reason | Type of Motivation |
|---|---|---|
| Quality of financial advice and services | 32% | Emotion-based reason |
| Quality of relationship | 21% | Emotion-based reason |
| Cost of services | 17% | Financial-based reason |
| Return performance | 11% | Financial-based reason |
| Comfort handling financial issues on their own | 10% | Emotion-based reason |
Numbers may not total 100 due to rounding. Respondents could select more than one answer.
Numbers may not total 100 due to rounding. Respondents could select more than one answer.
While firing an advisor is rare, many of the primary drivers behind firing decisions are also emotionally driven.
Often, advisors were fired due to the quality of the relationship. In many cases, this was due to an advisor not dedicating enough time to fully grasp their personal financial goals. Additionally, wealthier, and more financially literate clients are more likely to fire their advisors—highlighting the importance of understanding the client.
Key Takeaways
Given these driving factors, here are five ways that advisors can build a lasting relationship through recognizing their clients’ emotional needs:
- Understand your clients’ deeper goals
- Reach out proactively
- Act as a financial coach
- Keep clients updated
- Conduct goal-setting exercises on a regular basis
By communicating their value and setting expectations early, advisors can help prevent setbacks in their practice by adeptly recognizing the emotional motivators of their clients.
Markets in a Minute
The Top 5 Reasons Clients Hire a Financial Advisor
Here are the most common drivers for hiring a financial advisor, revealing that investor motivations go beyond just financial factors.

The Top 5 Reasons Clients Hire a Financial Advisor
What drives investors to hire a financial advisor?
From saving for a down payment to planning for retirement, clients turn to advisors to guide them through life’s complex financial decisions. However, many of the key reasons for hiring a financial advisor stem from emotional factors, and go beyond purely financial motivations.
We partnered with Morningstar to show the top reasons clients hire a financial advisor to provide insight on what’s driving investor behavior.
What Drives Hiring Decisions?
Here are the most common reasons for hiring an advisor, based on a survey of 312 respondents.
| Reason for Hiring | % of Respondents Citing This Reason | Type of Motivation |
|---|---|---|
| Specific goals or needs | 32% | Financial-based reason |
| Discomfort handling finances | 32% | Emotion-based reason |
| Behavioral coaching | 17% | Emotion-based reason |
| Recommended by family or friends | 12% | Emotion-based reason |
| Quality of relationship | 10% | Emotion-based reason |
Numbers may not total 100 due to rounding. Respondents could select more than one answer.
While financial factors played an important role in hiring decisions, emotional reasons made up the largest share of total responses.
This illustrates that clients place a high degree of importance on reaching specific goals or needs, and how an advisor communicates with them. Furthermore, clients seek out advisors for behavioral coaching to help them make informed decisions while staying the course.
Key Takeaways
With this in mind, here are five ways advisors can provide value to their clients and grow their practice:
- Address clients’ emotional needs early on
- Demonstrate how you can offer support
- Use ordinary language
- Provide education to help clients stay on track
- Acknowledge that these are issues we all face
By addressing emotional factors, advisors can more effectively help clients’ navigate intricate financial decisions and avoid common behavioral mistakes.

The Top 5 Reasons Clients Fire a Financial Advisor

The Top 5 Reasons Clients Hire a Financial Advisor

Visualizing the Growth of $100, by Asset Class

How Small Investments Make a Big Impact Over Time

What Were the Top Performing Investment Themes of 2023?
-

 Infographics2 years ago
The Top Investment Quotes Every Investor Should Know
-

 Markets in a Minute2 years ago
Mapped: The Growth in U.S. House Prices by State
-

 Markets in a Minute2 years ago
How Closely Related Are Historical Mortgage Rates and Housing Prices?
-

 Infographics2 years ago
A Visual Guide to Stagflation, Inflation, and Deflation
-

 Markets in a Minute1 year ago
Mapped: Global Energy Prices, by Country in 2022
-

 Markets in a Minute2 years ago
Visualizing Historical Oil Prices (1968-2022)
-

 Infographics1 year ago
Visual Guide: The Three Types of Economic Indicators
-

 Markets in a Minute2 years ago
Mapped: Global Macroeconomic Risk, by Country in 2022
