
Markets in a Minute
Mapped: Which Countries Have the Highest Investment Risk?
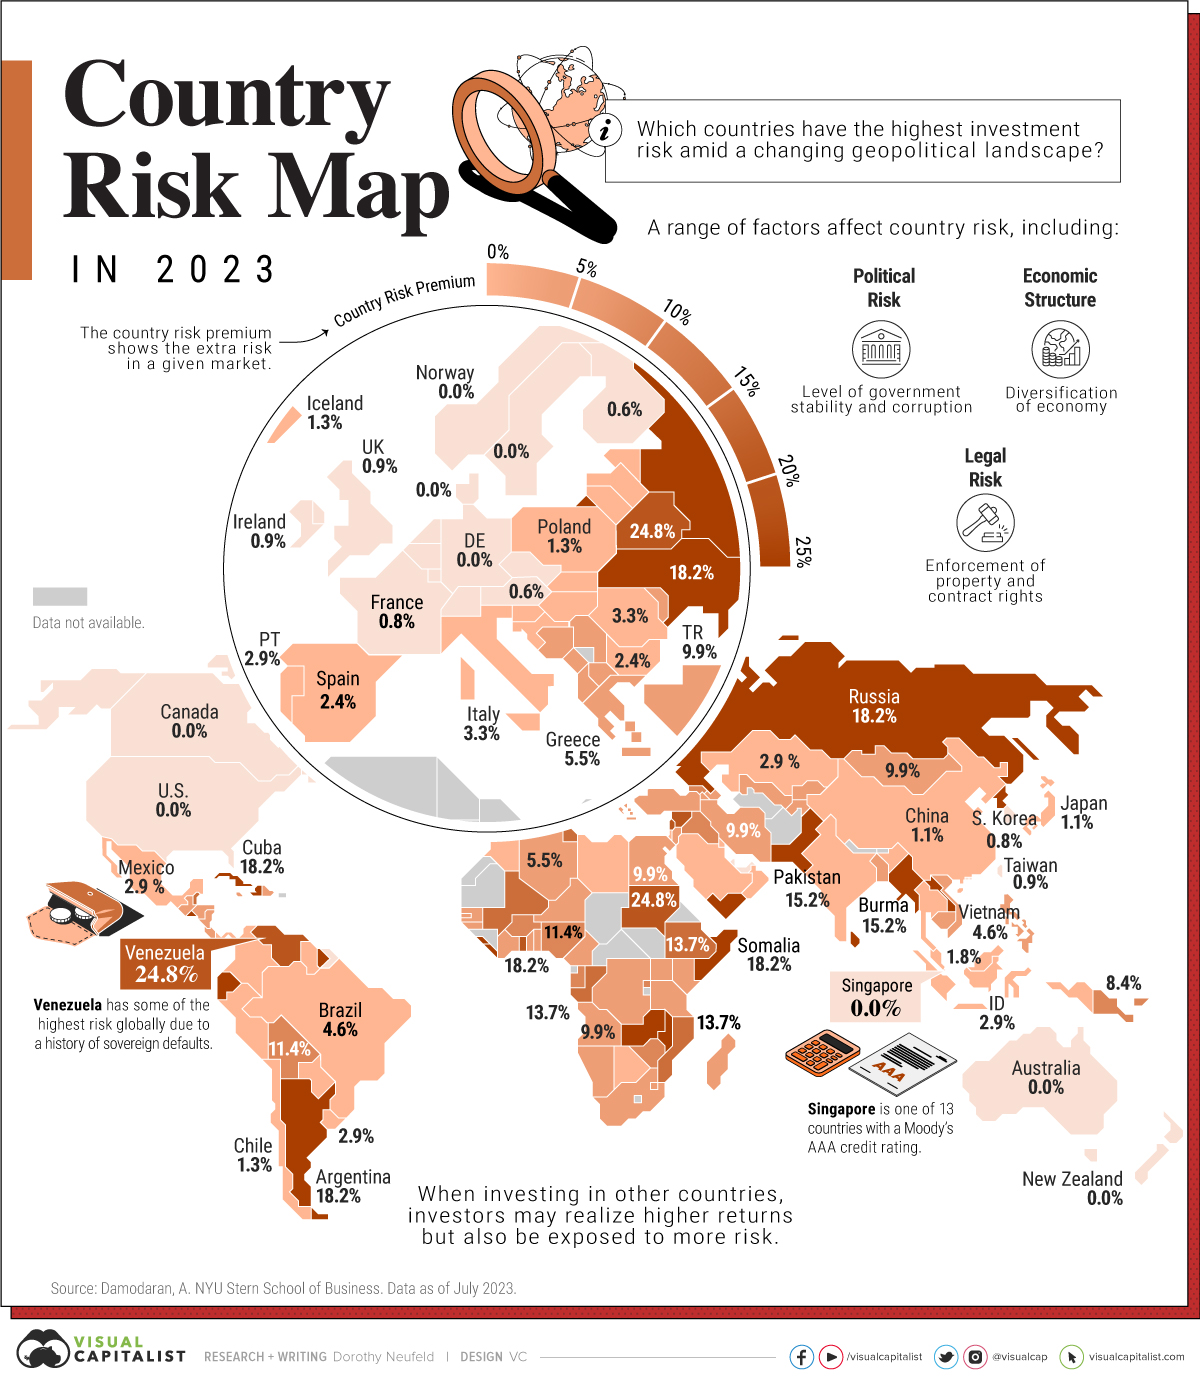
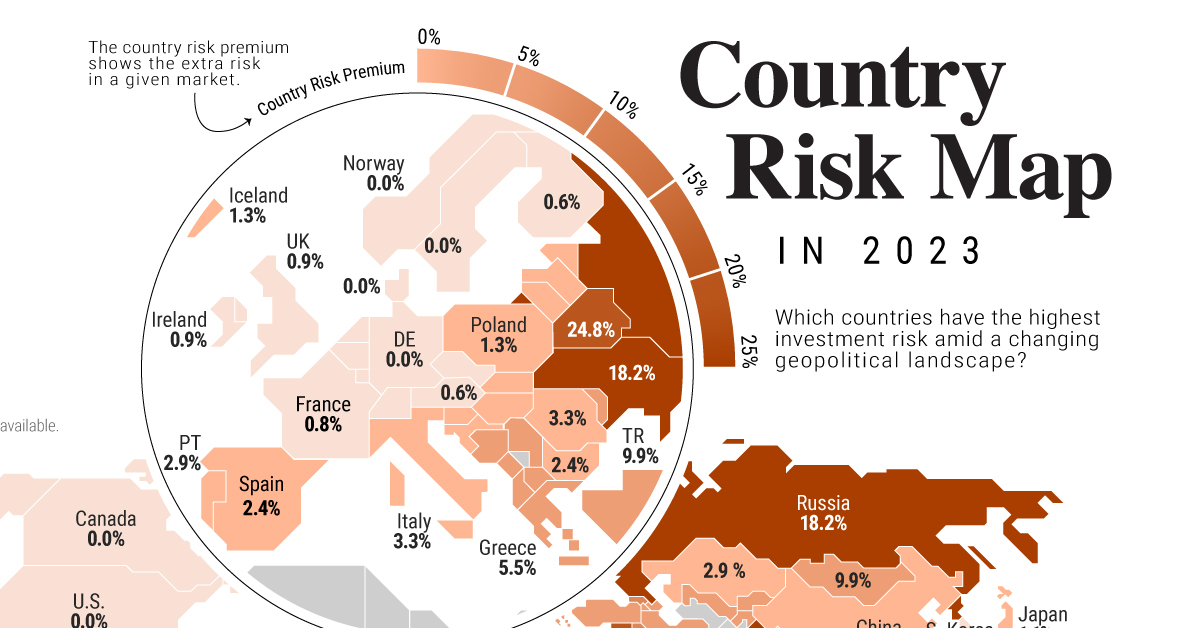
Which Countries Have the Highest Investment Risk?
What is the risk of investing in another country?
Given the rapid growth of emerging economies, and the opportunities this may present to investors, it raises the question: does investment exposure abroad come with risk, and how can that risk be analyzed?
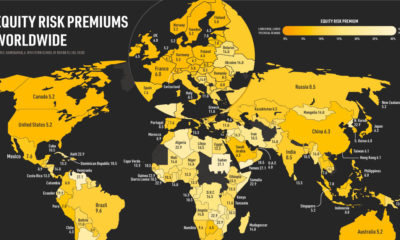
To help answer this question, this graphic shows country risk around the world, based on analysis from Aswath Damodaran at New York University’s Stern School of Business.
The Methodology
For many reasons, there are variations in risk across different countries. These can be influenced by geopolitical factors, such as political risk, whether they are in a stage of early growth, or have stable property rights.
To get a clearer picture of country risk, Damodaran analyzed the following broad factors:
- Political risk: Type of regime, corruption, level of conflict
- Legal risk: Property rights protections, contract rights
- Economic risk: Diversification of economy
In addition, a nation’s default risk was analyzed, which is a common measure used in financial markets. When a nation defaults on its debt, it often leads to market turbulence, and other negative effects that can last for many years.
Together, these factors, along with others, estimate a country risk premium, which is the extra risk in a given market. The U.S. served as baseline for measuring the extra risk of each country.
Country Risk in 2023
Below, we show country risk around the world, from highest to lowest risk as of July, 2023:
| Country | Country Risk Premium |
|---|---|
| 🇧🇾 Belarus | 24.8% |
| 🇱🇧 Lebanon | 24.8% |
| 🇻🇪 Venezuela | 24.8% |
| 🇸🇩 Sudan | 24.8% |
| 🇸🇾 Syria | 24.8% |
| 🇦🇷 Argentina | 18.2% |
| 🇨🇺 Cuba | 18.2% |
| 🇬🇭 Ghana | 18.2% |
| 🇷🇺 Russia | 18.2% |
| 🇱🇰 Sri Lanka | 18.2% |
| 🇺🇦 Ukraine | 18.2% |
| 🇿🇲 Zambia | 18.2% |
| 🇭🇹 Haiti | 18.2% |
| 🇰🇵 North Korea | 18.2% |
| 🇲🇼 Malawi | 18.2% |
| 🇸🇱 Sierra Leone | 18.2% |
| 🇸🇴 Somalia | 18.2% |
| 🇪🇨 Ecuador | 15.2% |
| 🇸🇻 El Salvador | 15.2% |
| 🇱🇦 Laos | 15.2% |
| 🇵🇰 Pakistan | 15.2% |
| 🇸🇷 Suriname | 15.2% |
| 🇱🇷 Liberia | 15.2% |
| 🇲🇲 Myanmar | 15.2% |
| 🇾🇪 Yemen | 15.2% |
| 🇧🇿 Belize | 13.7% |
| 🇨🇬 Congo (Republic of) | 13.7% |
| 🇪🇹 Ethiopia | 13.7% |
| 🇲🇱 Mali | 13.7% |
| 🇲🇿 Mozambique | 13.7% |
| 🇹🇳 Tunisia | 13.7% |
| 🇬🇳 Guinea | 13.7% |
| 🇧🇧 Barbados | 11.4% |
| 🇧🇴 Bolivia | 11.4% |
| 🇧🇫 Burkina Faso | 11.4% |
| 🇬🇦 Gabon | 11.4% |
| 🇮🇶 Iraq | 11.4% |
| 🇲🇻 Maldives | 11.4% |
| 🇳🇬 Nigeria | 11.4% |
| 🇸🇧 Solomon Islands | 11.4% |
| 🇿🇼 Zimbabwe | 11.4% |
| 🇦🇴 Angola | 9.9% |
| 🇧🇦 Bosnia and Herzegovina | 9.9% |
| 🇨🇻 Cape Verde | 9.9% |
| 🇨🇩 Congo (Democratic Republic of) | 9.9% |
| 🇪🇬 Egypt | 9.9% |
| 🇰🇪 Kenya | 9.9% |
| 🇰🇬 Kyrgyzstan | 9.9% |
| 🇲🇩 Moldova | 9.9% |
| 🇲🇳 Mongolia | 9.9% |
| 🇳🇮 Nicaragua | 9.9% |
| 🇳🇪 Niger | 9.9% |
| 🇻🇨 St. Vincent & the Grenadines | 9.9% |
| 🇸🇿 Swaziland | 9.9% |
| 🇹🇯 Tajikistan | 9.9% |
| 🇹🇬 Togo | 9.9% |
| 🇹🇷 Turkey | 9.9% |
| 🇮🇷 Iran | 9.9% |
| 🇲🇬 Madagascar | 9.9% |
| 🇧🇭 Bahrain | 8.4% |
| 🇰🇭 Cambodia | 8.4% |
| 🇨🇲 Cameroon | 8.4% |
| 🇨🇰 Cook Islands | 8.4% |
| 🇨🇷 Costa Rica | 8.4% |
| 🇯🇲 Jamaica | 8.4% |
| 🇵🇬 Papua New Guinea | 8.4% |
| 🇷🇼 Rwanda | 8.4% |
| 🇹🇿 Tanzania | 8.4% |
| 🇺🇬 Uganda | 8.4% |
| 🇬🇲 Gambia | 8.4% |
| 🇬🇼 Guinea-Bissau | 8.4% |
| 🇦🇱 Albania | 6.8% |
| 🇧🇸 Bahamas | 6.8% |
| 🇧🇩 Bangladesh | 6.8% |
| 🇧🇯 Benin | 6.8% |
| 🇫🇯 Fiji | 6.8% |
| 🇭🇳 Honduras | 6.8% |
| 🇯🇴 Jordan | 6.8% |
| 🇲🇪 Montenegro | 6.8% |
| 🇳🇦 Namibia | 6.8% |
| 🇦🇲 Armenia | 5.5% |
| 🇨🇮 Côte d'Ivoire | 5.5% |
| 🇩🇴 Dominican Republic | 5.5% |
| 🇬🇷 Greece | 5.5% |
| 🇲🇰 Macedonia | 5.5% |
| 🇸🇳 Senegal | 5.5% |
| 🇺🇿 Uzbekistan | 5.5% |
| 🇩🇿 Algeria | 5.5% |
| 🇧🇷 Brazil | 4.6% |
| 🇬🇪 Georgia | 4.6% |
| 🇴🇲 Oman | 4.6% |
| 🇷🇸 Serbia | 4.6% |
| 🇿🇦 South Africa | 4.6% |
| 🇸🇽 St. Maarten | 4.6% |
| 🇹🇹 Trinidad and Tobago | 4.6% |
| 🇻🇳 Vietnam | 4.6% |
| 🇦🇿 Azerbaijan | 3.8% |
| 🇨🇾 Cyprus | 3.8% |
| 🇬🇹 Guatemala | 3.8% |
| 🇲🇦 Morocco | 3.8% |
| 🇵🇾 Paraguay | 3.8% |
| 🇸🇭 Sharjah | 3.8% |
| 🇮🇳 India | 3.3% |
| 🇮🇹 Italy | 3.3% |
| 🇲🇺 Mauritius | 3.3% |
| 🇲🇸 Montserrat | 3.3% |
| 🇷🇴 Romania | 3.3% |
| 🇦🇩 Andorra | 2.9% |
| 🇦🇼 Aruba | 2.9% |
| 🇨🇴 Colombia | 2.9% |
| 🇭🇷 Croatia | 2.9% |
| 🇨🇼 Curacao | 2.9% |
| 🇭🇺 Hungary | 2.9% |
| 🇮🇩 Indonesia | 2.9% |
| 🇰🇿 Kazakhstan | 2.9% |
| 🇲🇽 Mexico | 2.9% |
| 🇵🇦 Panama | 2.9% |
| 🇵🇭 Philippines | 2.9% |
| 🇵🇹 Portugal | 2.9% |
| 🇺🇾 Uruguay | 2.9% |
| 🇱🇾 Libya | 2.9% |
| 🇧🇬 Bulgaria | 2.4% |
| 🇵🇪 Peru | 2.4% |
| 🇪🇸 Spain | 2.4% |
| 🇹🇭 Thailand | 2.4% |
| 🇹🇨 Turks and Caicos | 2.4% |
| 🇬🇾 Guyana | 2.4% |
| 🇧🇼 Botswana | 1.8% |
| 🇱🇻 Latvia | 1.8% |
| 🇲🇾 Malaysia | 1.8% |
| 🇸🇮 Slovenia | 1.8% |
| 🇧🇲 Bermuda | 1.3% |
| 🇨🇱 Chile | 1.3% |
| 🇮🇸 Iceland | 1.3% |
| 🇱🇹 Lithuania | 1.3% |
| 🇲🇹 Malta | 1.3% |
| 🇵🇱 Poland | 1.3% |
| 🇸🇰 Slovakia | 1.3% |
| 🇨🇳 China | 1.1% |
| 🇪🇪 Estonia | 1.1% |
| 🇮🇱 Israel | 1.1% |
| 🇯🇵 Japan | 1.1% |
| 🇰🇼 Kuwait | 1.1% |
| 🇸🇦 Saudi Arabia | 1.1% |
| 🇧🇪 Belgium | 0.9% |
| 🇰🇾 Cayman Islands | 0.9% |
| 🇨🇿 Czech Republic | 0.9% |
| 🇭🇰 Hong Kong | 0.9% |
| 🇮🇪 Ireland | 0.9% |
| 🇮🇲 Isle of Man | 0.9% |
| 🇯🇪 Jersey | 0.9% |
| 🇲🇴 Macao | 0.9% |
| 🇶🇦 Qatar | 0.9% |
| 🇹🇼 Taiwan | 0.9% |
| 🇬🇧 UK | 0.9% |
| 🇧🇳 Brunei | 0.9% |
| 🇦🇪 Abu Dhabi | 0.8% |
| 🇫🇷 France | 0.8% |
| 🇬🇬 Guernsey | 0.8% |
| 🇰🇷 Korea | 0.8% |
| 🇦🇪 U.A.E. | 0.8% |
| 🇦🇹 Austria | 0.6% |
| 🇫🇮 Finland | 0.6% |
| 🇦🇺 Australia | 0.0% |
| 🇨🇦 Canada | 0.0% |
| 🇩🇰 Denmark | 0.0% |
| 🇩🇪 Germany | 0.0% |
| 🇱🇮 Liechtenstein | 0.0% |
| 🇱🇺 Luxembourg | 0.0% |
| 🇳🇱 Netherlands | 0.0% |
| 🇳🇿 New Zealand | 0.0% |
| 🇳🇴 Norway | 0.0% |
| 🇸🇬 Singapore | 0.0% |
| 🇸🇪 Sweden | 0.0% |
| 🇨🇭 Switzerland | 0.0% |
| 🇺🇸 U.S. | 0.0% |
As the table above shows, five countries share the highest risk: Belarus, Lebanon, Venezuela, Sudan, and Syria. In Belarus, Russian military forces continue to operate. Venezuela has faced hyperinflation and endemic corruption for many years.
On the other hand, 13 countries had the lowest risk, including several European nations, Singapore, and New Zealand. This is due to factors such as their AAA-rated government bonds, low corruption, and strong property right protections.
What Does This Mean for Investors?
The growth of emerging economies presents opportunities for investors, shaped by demographic influences, rising GDP, and technological advancements seen globally.
Adding to this, diversification across sectors, assets, and geographies may stand to benefit investors more generally.
With this in mind, investments in other countries are exposed to country risks that go beyond, but ultimately influence the long-term performance of stocks, bonds, and other financial assets. Considering these factors, the reward of investing in international companies may come with macroeconomic and country-specific risks.


Markets in a Minute
The Top 5 Reasons Clients Fire a Financial Advisor
Firing an advisor is often driven by more than cost and performance factors. Here are the top reasons clients ‘break up’ with their advisors.

The Top 5 Reasons Clients Fire a Financial Advisor
What drives investors to fire a financial advisor?
From saving for a down payment to planning for retirement, clients turn to advisors to guide them through life’s complex financial decisions. However, many of the key reasons for firing a financial advisor stem from emotional factors, and go beyond purely financial motivations.
We partnered with Morningstar to show the top reasons clients fire an advisor to provide insight on what’s driving investor behavior.
What Drives Firing Decisions?
Here are the top reasons clients terminated their advisor, based on a survey of 184 respondents:
| Reason for Firing | % of Respondents Citing This Reason | Type of Motivation |
|---|---|---|
| Quality of financial advice and services | 32% | Emotion-based reason |
| Quality of relationship | 21% | Emotion-based reason |
| Cost of services | 17% | Financial-based reason |
| Return performance | 11% | Financial-based reason |
| Comfort handling financial issues on their own | 10% | Emotion-based reason |
Numbers may not total 100 due to rounding. Respondents could select more than one answer.
Numbers may not total 100 due to rounding. Respondents could select more than one answer.
While firing an advisor is rare, many of the primary drivers behind firing decisions are also emotionally driven.
Often, advisors were fired due to the quality of the relationship. In many cases, this was due to an advisor not dedicating enough time to fully grasp their personal financial goals. Additionally, wealthier, and more financially literate clients are more likely to fire their advisors—highlighting the importance of understanding the client.
Key Takeaways
Given these driving factors, here are five ways that advisors can build a lasting relationship through recognizing their clients’ emotional needs:
- Understand your clients’ deeper goals
- Reach out proactively
- Act as a financial coach
- Keep clients updated
- Conduct goal-setting exercises on a regular basis
By communicating their value and setting expectations early, advisors can help prevent setbacks in their practice by adeptly recognizing the emotional motivators of their clients.
Markets in a Minute
The Top 5 Reasons Clients Hire a Financial Advisor
Here are the most common drivers for hiring a financial advisor, revealing that investor motivations go beyond just financial factors.

The Top 5 Reasons Clients Hire a Financial Advisor
What drives investors to hire a financial advisor?
From saving for a down payment to planning for retirement, clients turn to advisors to guide them through life’s complex financial decisions. However, many of the key reasons for hiring a financial advisor stem from emotional factors, and go beyond purely financial motivations.
We partnered with Morningstar to show the top reasons clients hire a financial advisor to provide insight on what’s driving investor behavior.
What Drives Hiring Decisions?
Here are the most common reasons for hiring an advisor, based on a survey of 312 respondents.
| Reason for Hiring | % of Respondents Citing This Reason | Type of Motivation |
|---|---|---|
| Specific goals or needs | 32% | Financial-based reason |
| Discomfort handling finances | 32% | Emotion-based reason |
| Behavioral coaching | 17% | Emotion-based reason |
| Recommended by family or friends | 12% | Emotion-based reason |
| Quality of relationship | 10% | Emotion-based reason |
Numbers may not total 100 due to rounding. Respondents could select more than one answer.
While financial factors played an important role in hiring decisions, emotional reasons made up the largest share of total responses.
This illustrates that clients place a high degree of importance on reaching specific goals or needs, and how an advisor communicates with them. Furthermore, clients seek out advisors for behavioral coaching to help them make informed decisions while staying the course.
Key Takeaways
With this in mind, here are five ways advisors can provide value to their clients and grow their practice:
- Address clients’ emotional needs early on
- Demonstrate how you can offer support
- Use ordinary language
- Provide education to help clients stay on track
- Acknowledge that these are issues we all face
By addressing emotional factors, advisors can more effectively help clients’ navigate intricate financial decisions and avoid common behavioral mistakes.

The Top 5 Reasons Clients Fire a Financial Advisor

The Top 5 Reasons Clients Hire a Financial Advisor

Visualizing the Growth of $100, by Asset Class

How Small Investments Make a Big Impact Over Time

What Were the Top Performing Investment Themes of 2023?
-

 Infographics2 years ago
The Top Investment Quotes Every Investor Should Know
-

 Markets in a Minute2 years ago
Mapped: The Growth in U.S. House Prices by State
-

 Markets in a Minute2 years ago
How Closely Related Are Historical Mortgage Rates and Housing Prices?
-

 Infographics2 years ago
A Visual Guide to Stagflation, Inflation, and Deflation
-

 Markets in a Minute1 year ago
Mapped: Global Energy Prices, by Country in 2022
-

 Markets in a Minute2 years ago
Visualizing Historical Oil Prices (1968-2022)
-

 Infographics1 year ago
Visual Guide: The Three Types of Economic Indicators
-

 Markets in a Minute2 years ago
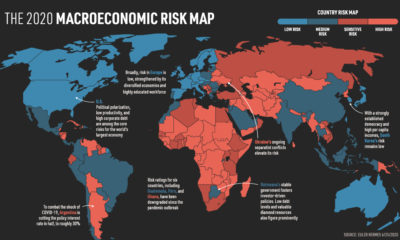
Mapped: Global Macroeconomic Risk, by Country in 2022
