
Markets in a Minute
Dove vs. Hawk: The Financial Conditions Index
This infographic is available as a poster.
This infographic is available as a poster.
Visualizing the Financial Conditions Index
What do financial conditions indicate about the economy? What effects do they have on growth?
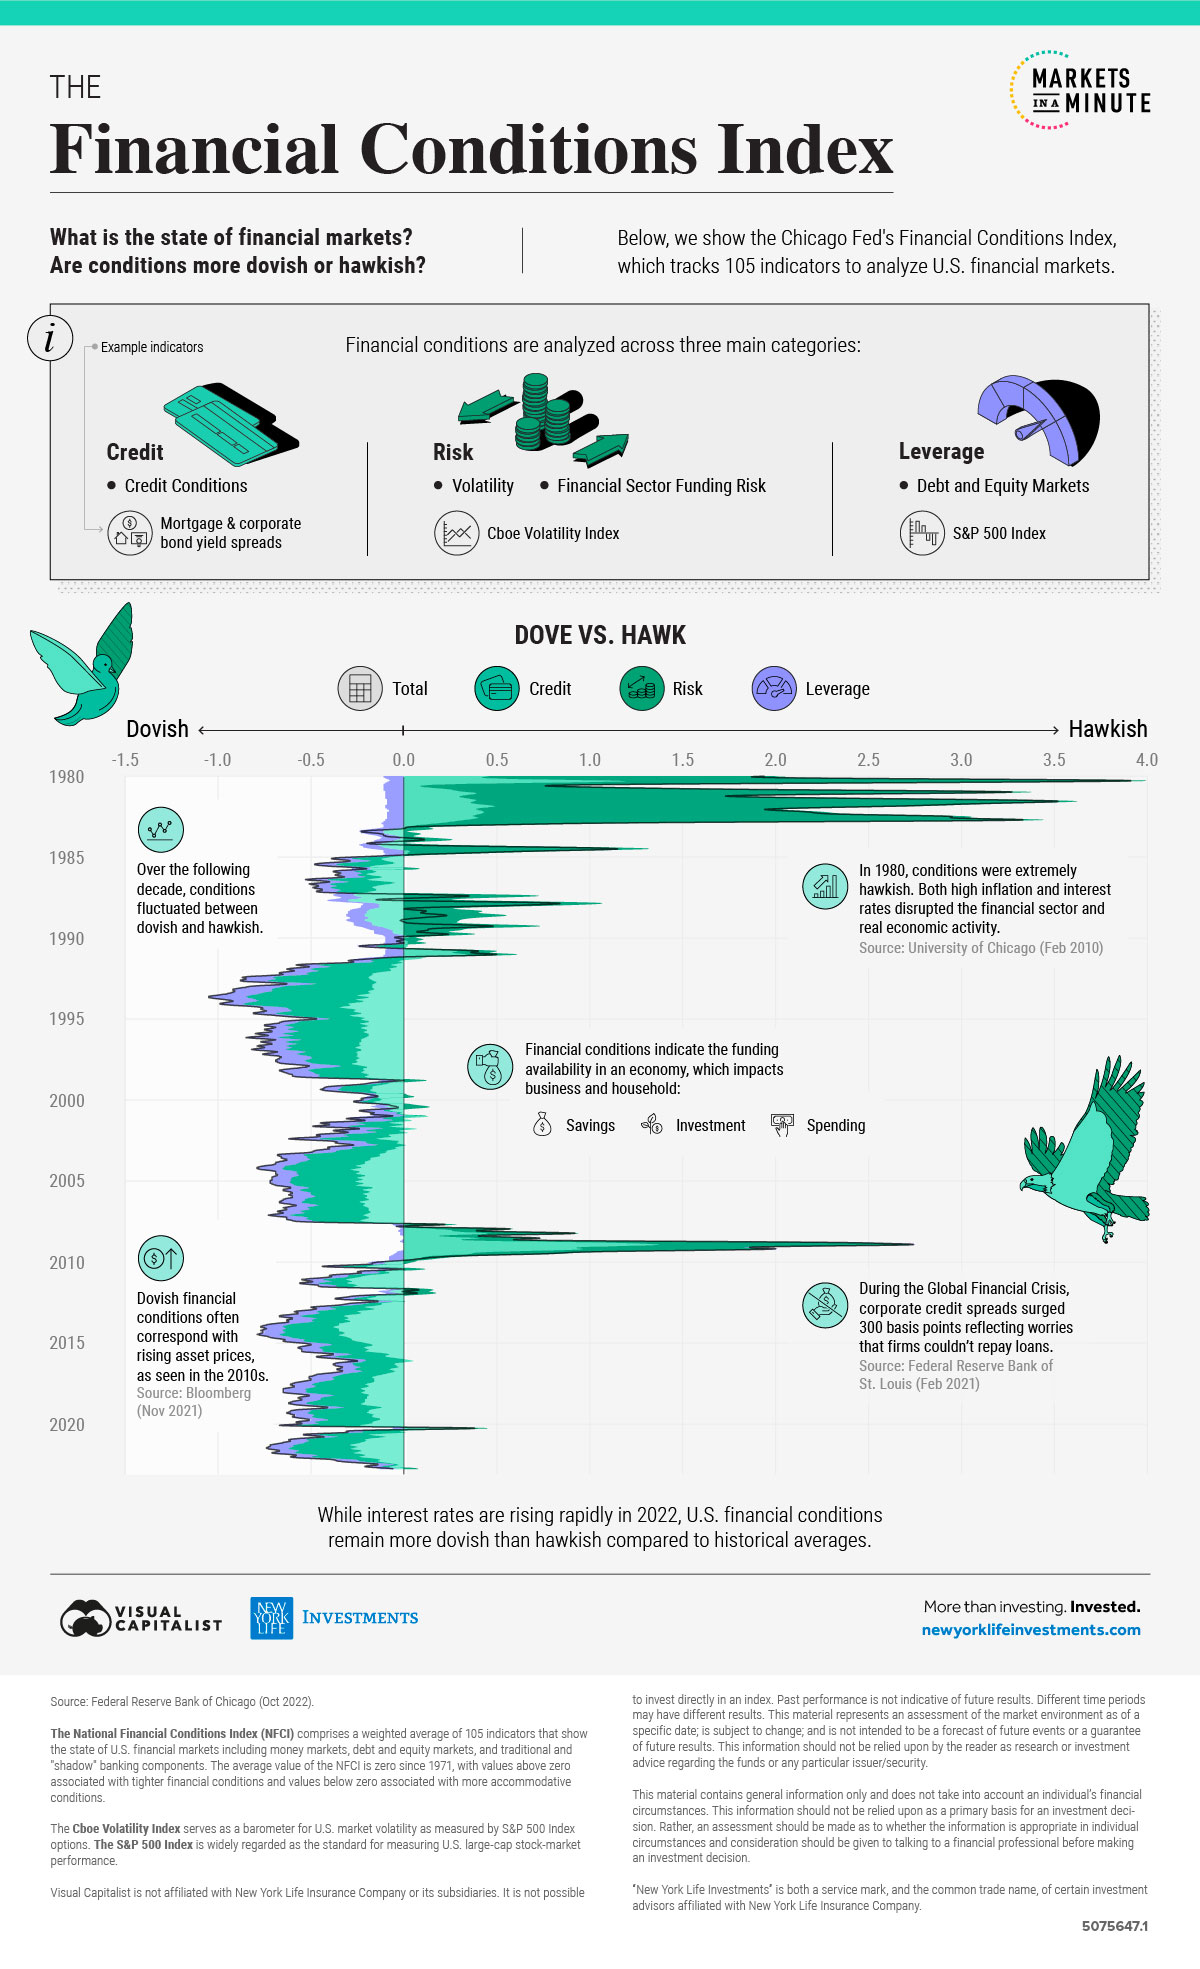
From S&P 500 Index returns to the Cboe Volatility Index (VIX) to a range of credit conditions, the Chicago Fed’s Financial Conditions Index looks at whether financial activity is tighter than the historical average—or more accommodative.
This Markets in a Minute chart from New York Life Investments compares financial conditions in 2022 to the last 40 years as interest rates rise at the fastest rate in decades.
How Is the Financial Conditions Index Measured?
First, the Chicago Fed’s Financial Conditions Index takes 105 weighted average indicators of financial activity and organizes them into three main categories.
Together, the sum of these indicators provide an update on the state of U.S. financial markets.
| Category | Risk | Credit | Leverage |
|---|---|---|---|
| What Does It Measure? | - Volatility - Funding Risk | - Credit Conditions | - Debt and Equity Markets |
| Example Indicator | Cboe Volatility Index | Mortgage spreads, corporate bond yield spreads | S&P 500 Price Index Returns |
For example, low equity market volatility is associated with lower risk and better financial conditions.
Credit market factors, such as mortgage spreads and corporate bond yield spreads, indicate the credit conditions of the economy. Credit spreads are the difference in bond yields (returns) of two different debt securities with the same maturity, but with different credit quality.
In this way, a narrower credit spread often indicates better financial conditions, while a wider credit spread indicates worse conditions. Credit spreads apply to any debt instrument like mortgages or corporate bonds.
Asset prices, as seen in the S&P 500 Index, are part of the leverage category which measures the state of U.S. debt and equity markets. When the index is declining, it can be associated with tighter conditions.
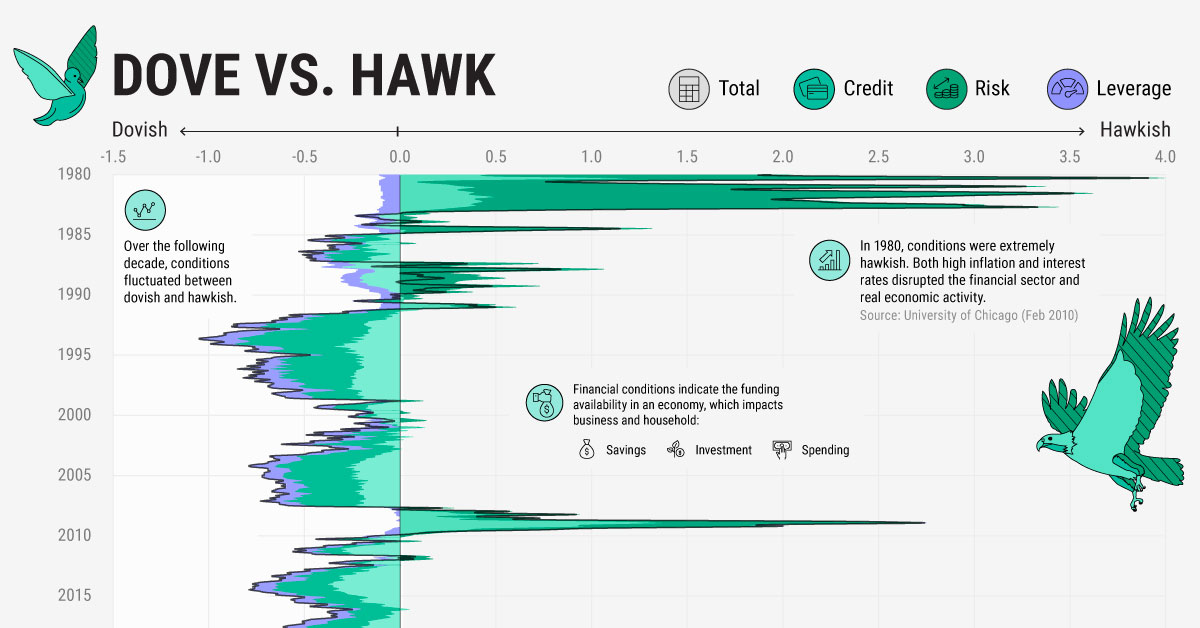
Dove vs. Hawk
Another way to look at the state of financial conditions is through a ‘dovish’ or ‘hawkish’ lens.
When conditions are more accommodative, they can be seen as more dovish. This is when monetary policy favors lower interest rates to boost economic growth and employment.
Hawkish conditions, on the other hand, are characterized by tighter monetary policy. This is seen in higher interest rates to control inflation, but typically at the expense of economic growth, spending, and employment.
The Best of Times & the Worst of Times
When have the best and worst financial conditions taken place in recent history?
Following the recession of 1990, interest rates fell after periods of unprecedented highs in the 1980s. This eased the debt burdens for corporations and households, creating some of the most favorable financial conditions in the last several decades.
Despite the early 1990s being characterized with the most accommodative conditions, the period was marked by slow economic and employment growth.
Interestingly, it was not until the second half of the decade that growth accelerated, amid low inflation and unemployment. Broadly speaking, an increase in private-sector spending and employment helped drive this growth.
| Good Financial Conditions | Bad Financial Conditions |
|---|---|
| Q3 1993 | Q2 1980 |
| Q4 1990 | Q1 1980 |
| Q1 1994 | Q3 1981 |
| Q2 1993 | Q3 1982 |
| Q1 1993 | Q2 1981 |
| Q3 1992 | Q4 1980 |
| Q2 1992 | Q1 1981 |
| Q3 1992 | Q4 1982 |
| Q4 1992 | Q2 1982 |
| Q1 1996 | Q4 1981 |
| Q4 1996 | Q4 2008 |
| Q3 1994 | Q1 2009 |
By contrast, the early 1980s saw the worst financial conditions by far. Interest rates hit historic highs to rein in inflation, and financial conditions were strained.
Historically, tighter financial conditions have been linked to falling asset values and increasing risk premiums. This is the additional return an investor can expect to receive for holding a riskier asset compared to the return from a risk-free asset like a government bond.
During these conditions, economic activity can slow and the net worth of households and nonfinancial companies could decline amid tightened credit conditions.
A Closer Look: 2022 In Context
Against the backdrop of six interest rate hikes and declining equity market performance in 2022, financial markets are facing challenging conditions.
Given these factors, are conditions more hawkish or accommodative?
Compared to historical averages, financial markets still fall on the dovish side. Although conditions have slowly become less accommodative from their recent peak in mid-2021, they remain closer to neutral from a long-term perspective.
Still, corporate bond spreads, key indicators in the Financial Conditions Index, could widen if interest rates and default concerns continue to rise. Higher yields, in tandem with strain on other financial indicators like the VIX and S&P 500 returns, could tilt conditions to become more hawkish looking ahead.


Markets in a Minute
The Top 5 Reasons Clients Fire a Financial Advisor
Firing an advisor is often driven by more than cost and performance factors. Here are the top reasons clients ‘break up’ with their advisors.

The Top 5 Reasons Clients Fire a Financial Advisor
What drives investors to fire a financial advisor?
From saving for a down payment to planning for retirement, clients turn to advisors to guide them through life’s complex financial decisions. However, many of the key reasons for firing a financial advisor stem from emotional factors, and go beyond purely financial motivations.
We partnered with Morningstar to show the top reasons clients fire an advisor to provide insight on what’s driving investor behavior.
What Drives Firing Decisions?
Here are the top reasons clients terminated their advisor, based on a survey of 184 respondents:
| Reason for Firing | % of Respondents Citing This Reason | Type of Motivation |
|---|---|---|
| Quality of financial advice and services | 32% | Emotion-based reason |
| Quality of relationship | 21% | Emotion-based reason |
| Cost of services | 17% | Financial-based reason |
| Return performance | 11% | Financial-based reason |
| Comfort handling financial issues on their own | 10% | Emotion-based reason |
Numbers may not total 100 due to rounding. Respondents could select more than one answer.
Numbers may not total 100 due to rounding. Respondents could select more than one answer.
While firing an advisor is rare, many of the primary drivers behind firing decisions are also emotionally driven.
Often, advisors were fired due to the quality of the relationship. In many cases, this was due to an advisor not dedicating enough time to fully grasp their personal financial goals. Additionally, wealthier, and more financially literate clients are more likely to fire their advisors—highlighting the importance of understanding the client.
Key Takeaways
Given these driving factors, here are five ways that advisors can build a lasting relationship through recognizing their clients’ emotional needs:
- Understand your clients’ deeper goals
- Reach out proactively
- Act as a financial coach
- Keep clients updated
- Conduct goal-setting exercises on a regular basis
By communicating their value and setting expectations early, advisors can help prevent setbacks in their practice by adeptly recognizing the emotional motivators of their clients.
Markets in a Minute
The Top 5 Reasons Clients Hire a Financial Advisor
Here are the most common drivers for hiring a financial advisor, revealing that investor motivations go beyond just financial factors.

The Top 5 Reasons Clients Hire a Financial Advisor
What drives investors to hire a financial advisor?
From saving for a down payment to planning for retirement, clients turn to advisors to guide them through life’s complex financial decisions. However, many of the key reasons for hiring a financial advisor stem from emotional factors, and go beyond purely financial motivations.
We partnered with Morningstar to show the top reasons clients hire a financial advisor to provide insight on what’s driving investor behavior.
What Drives Hiring Decisions?
Here are the most common reasons for hiring an advisor, based on a survey of 312 respondents.
| Reason for Hiring | % of Respondents Citing This Reason | Type of Motivation |
|---|---|---|
| Specific goals or needs | 32% | Financial-based reason |
| Discomfort handling finances | 32% | Emotion-based reason |
| Behavioral coaching | 17% | Emotion-based reason |
| Recommended by family or friends | 12% | Emotion-based reason |
| Quality of relationship | 10% | Emotion-based reason |
Numbers may not total 100 due to rounding. Respondents could select more than one answer.
While financial factors played an important role in hiring decisions, emotional reasons made up the largest share of total responses.
This illustrates that clients place a high degree of importance on reaching specific goals or needs, and how an advisor communicates with them. Furthermore, clients seek out advisors for behavioral coaching to help them make informed decisions while staying the course.
Key Takeaways
With this in mind, here are five ways advisors can provide value to their clients and grow their practice:
- Address clients’ emotional needs early on
- Demonstrate how you can offer support
- Use ordinary language
- Provide education to help clients stay on track
- Acknowledge that these are issues we all face
By addressing emotional factors, advisors can more effectively help clients’ navigate intricate financial decisions and avoid common behavioral mistakes.

The Top 5 Reasons Clients Fire a Financial Advisor

The Top 5 Reasons Clients Hire a Financial Advisor

Visualizing the Growth of $100, by Asset Class

How Small Investments Make a Big Impact Over Time

What Were the Top Performing Investment Themes of 2023?
-

 Infographics2 years ago
The Top Investment Quotes Every Investor Should Know
-

 Markets in a Minute2 years ago
Mapped: The Growth in U.S. House Prices by State
-

 Markets in a Minute2 years ago
How Closely Related Are Historical Mortgage Rates and Housing Prices?
-

 Infographics2 years ago
A Visual Guide to Stagflation, Inflation, and Deflation
-

 Markets in a Minute1 year ago
Mapped: Global Energy Prices, by Country in 2022
-

 Markets in a Minute2 years ago
Visualizing Historical Oil Prices (1968-2022)
-

 Infographics1 year ago
Visual Guide: The Three Types of Economic Indicators
-

 Markets in a Minute2 years ago
Mapped: Global Macroeconomic Risk, by Country in 2022
