
Markets in a Minute
Visualized: The State of the U.S. Labor Market
Visualized: The State of the U.S. Labor Market
The last time the U.S. labor market was this strong was in 1969.
Unemployment fell to 3.3%, incomes were soaring to historic levels, and inflation was rising at a fast clip. Like today, the Federal Reserve was tightening monetary policy to stifle inflation. Yet much of the wage increases were washed out by rising consumer prices.
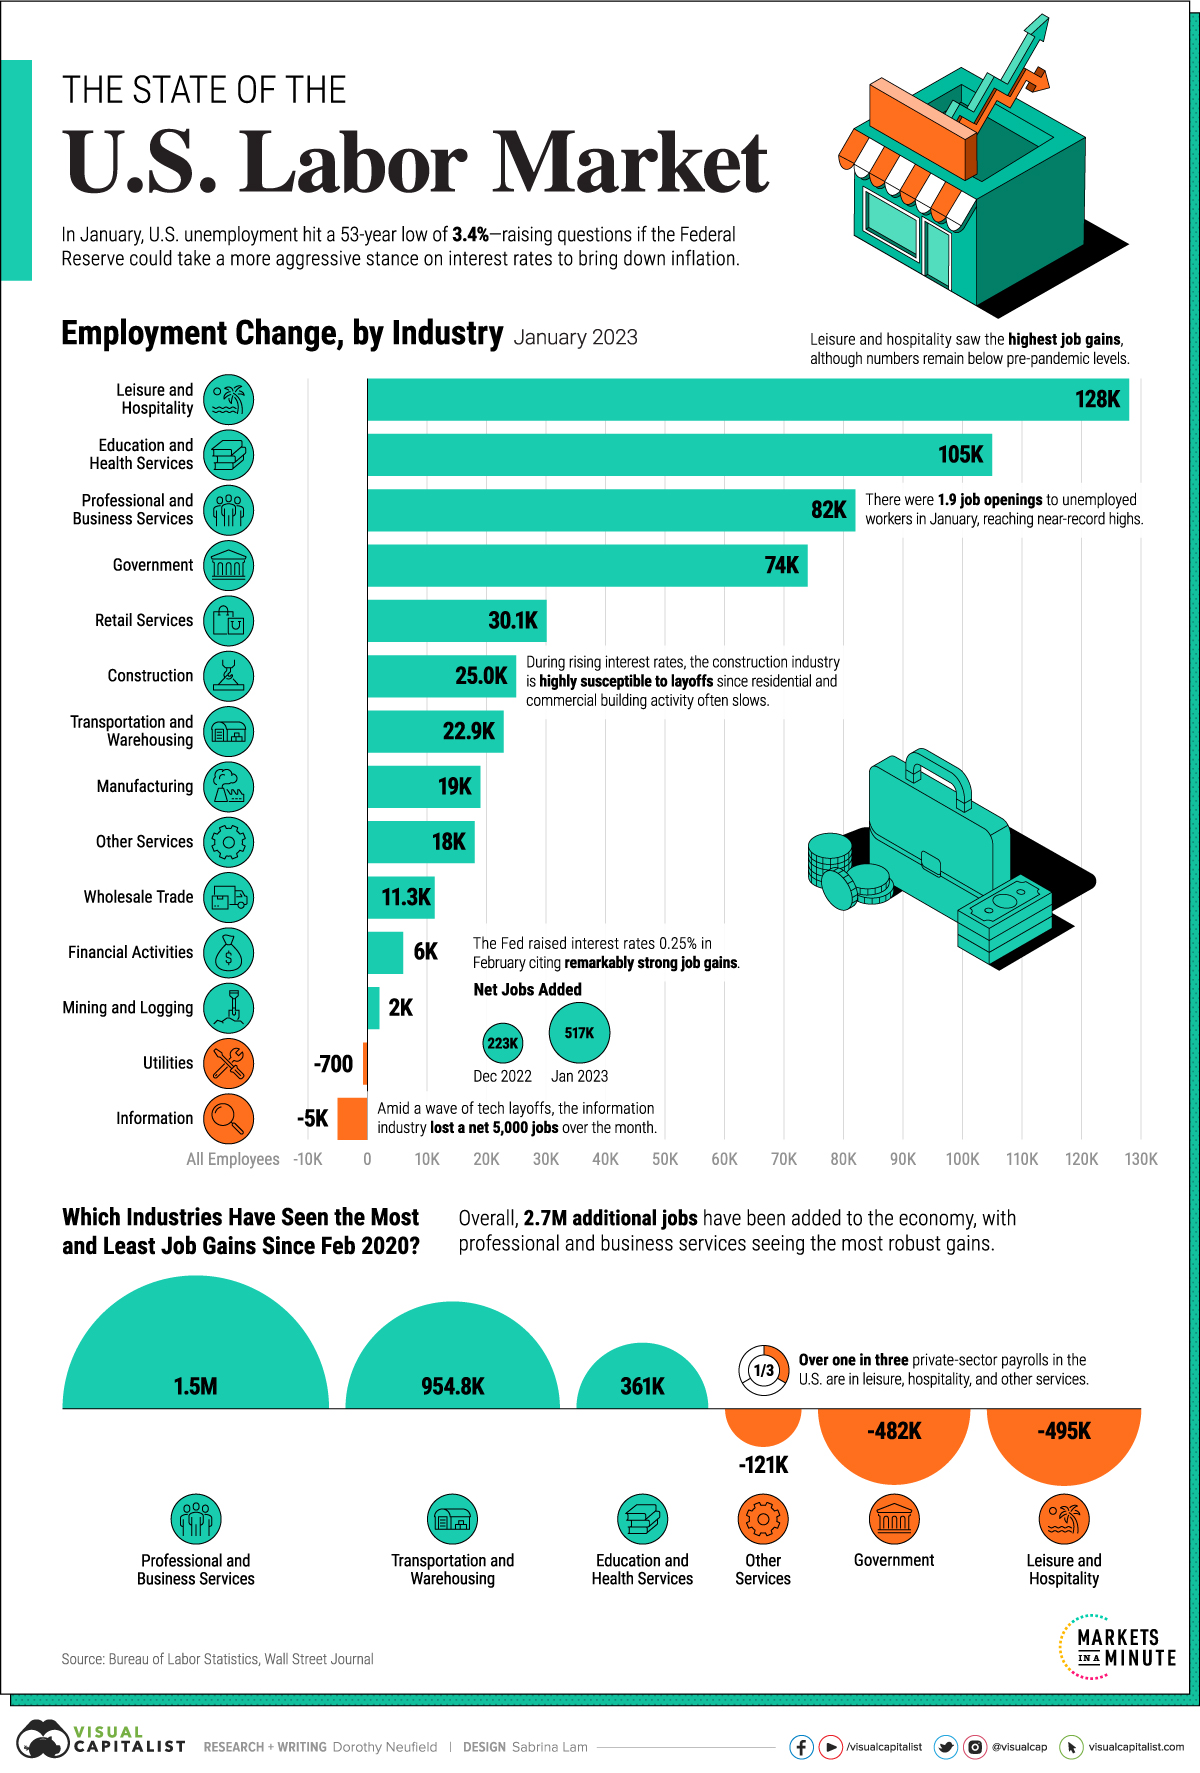
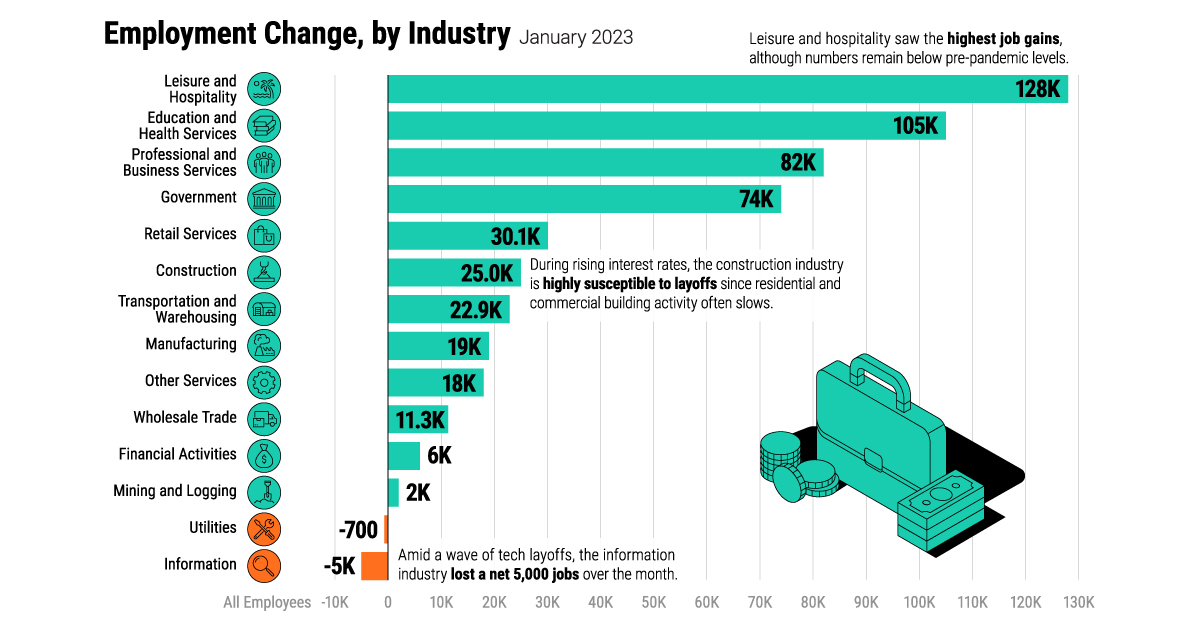
The above graphic looks at the industries driving today’s robust job market using data from the Bureau of Labor Statistics. Later, we look into the impact on inflation, and whether today’s market can be sustained.
What is Driving the U.S. Labor Market?
Broadly, service-led industries witnessed the highest share of job growth in January.
Still, as the table below shows, a key part of the services sector—leisure and hospitality employment—remains under pre-pandemic levels. A similar trend is seen in retail services.
| Rank | Industry | Job Growth Jan 2023 | Job Growth Since 2020 |
|---|---|---|---|
| 1 | Leisure and Hospitality | 128K | -495K |
| 2 | Education and Health Services | 105K | 361K |
| 3 | Professional and Business Services | 82K | 1,475K |
| 4 | Government | 74K | -482K |
| 5 | Retail Services | 30K | -37K |
| 6 | Construction | 25K | 276K |
| 7 | Transportation and Warehousing | 23K | 955K |
| 8 | Manufacturing | 19K | 214K |
| 9 | Other Services | 18K | -121K |
| 10 | Wholesale Trade | 11K | 148K |
| 11 | Financial Activities | 6K | 245K |
| 12 | Mining and Logging | 2K | -55K |
| 13 | Utilities | -1K | 8K |
| 14 | Information | -5K | 211K |
Adding 1.5 million jobs since 2020 is professional and business services, the highest overall. This sector covers legal, accounting, veterinary, engineering and other specialized services.
We are also seeing strong gains in transportation and warehousing. Last year, the sector added an average of 23,000 jobs, totaling almost 955,000 over the course of the pandemic. Today, trucking jobs exceed 2019 levels and warehouse employment is roughly 50% higher.
Although manufacturing hasn’t seen the highest gains, the sector has one of the lowest unemployment rates across job sectors, at 2.4%. Yet the industry faces an acute labor shortage—if every skilled unemployed worker were to fill open job vacancies, a third of jobs in durable manufacturing would remain open.
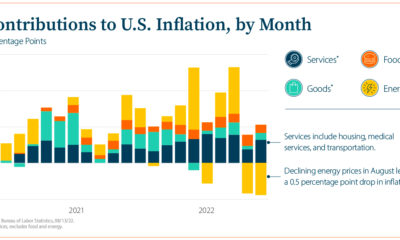
Cooling Wage Growth
Despite rock-bottom unemployment numbers, wage growth is slowing. In January, it fell to 4.4% annually, down from a multi-decade high of 5.9% in March last year.
At the same time, wage growth falls below inflation by about 1%.
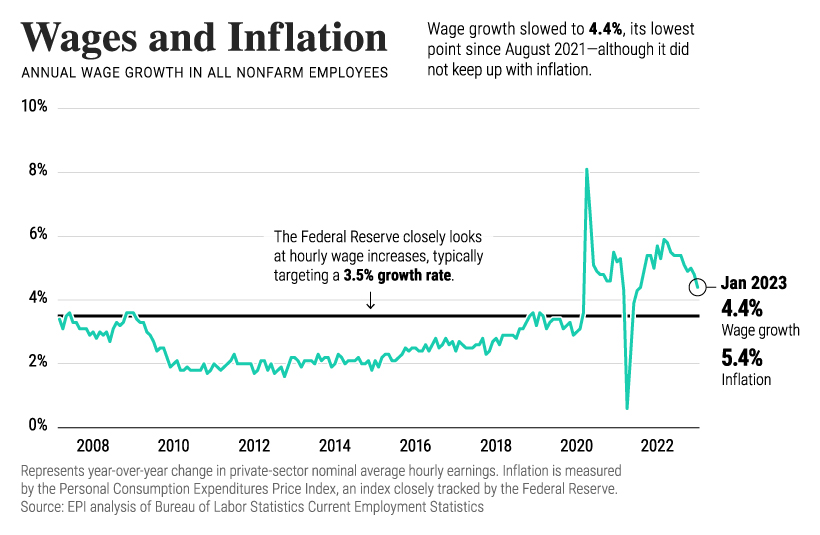
Wage growth is carefully watched by the Federal Reserve. Typically, their annual wage growth target is 3.5% to be compatible with 2% inflation.
In the current environment, this wage growth trend serves as a double-edged sword. As wage growth slows, workers are less likely to see wages keep up with inflation. On the other hand, slower wage growth could help prevent inflation from rising in the first place—and interest rates from climbing higher.
Where is the Job Market Heading?
The question on everyone’s minds is whether today’s job market will stay resilient.
According to Fitch Ratings, slowing aggregate demand in response to higher interest rates will begin to weigh on the U.S. labor market, and the 517,000 new jobs created in January—three times the level expected by analysts— won’t last long.
Eventually, both higher borrowing costs and elevated compensation costs could weigh on corporate profits. On the other hand, the pandemic has changed the labor market. Relief legislation may continue to buoy the job market and workers may also remain scarce as people retire or leave for other reasons.
Given how unemployment serves as a lagging indicator, the material effects in the economy will likely appear before cracks begin to show in the U.S. labor market.


Markets in a Minute
The Top 5 Reasons Clients Fire a Financial Advisor
Firing an advisor is often driven by more than cost and performance factors. Here are the top reasons clients ‘break up’ with their advisors.

The Top 5 Reasons Clients Fire a Financial Advisor
What drives investors to fire a financial advisor?
From saving for a down payment to planning for retirement, clients turn to advisors to guide them through life’s complex financial decisions. However, many of the key reasons for firing a financial advisor stem from emotional factors, and go beyond purely financial motivations.
We partnered with Morningstar to show the top reasons clients fire an advisor to provide insight on what’s driving investor behavior.
What Drives Firing Decisions?
Here are the top reasons clients terminated their advisor, based on a survey of 184 respondents:
| Reason for Firing | % of Respondents Citing This Reason | Type of Motivation |
|---|---|---|
| Quality of financial advice and services | 32% | Emotion-based reason |
| Quality of relationship | 21% | Emotion-based reason |
| Cost of services | 17% | Financial-based reason |
| Return performance | 11% | Financial-based reason |
| Comfort handling financial issues on their own | 10% | Emotion-based reason |
Numbers may not total 100 due to rounding. Respondents could select more than one answer.
Numbers may not total 100 due to rounding. Respondents could select more than one answer.
While firing an advisor is rare, many of the primary drivers behind firing decisions are also emotionally driven.
Often, advisors were fired due to the quality of the relationship. In many cases, this was due to an advisor not dedicating enough time to fully grasp their personal financial goals. Additionally, wealthier, and more financially literate clients are more likely to fire their advisors—highlighting the importance of understanding the client.
Key Takeaways
Given these driving factors, here are five ways that advisors can build a lasting relationship through recognizing their clients’ emotional needs:
- Understand your clients’ deeper goals
- Reach out proactively
- Act as a financial coach
- Keep clients updated
- Conduct goal-setting exercises on a regular basis
By communicating their value and setting expectations early, advisors can help prevent setbacks in their practice by adeptly recognizing the emotional motivators of their clients.
Markets in a Minute
The Top 5 Reasons Clients Hire a Financial Advisor
Here are the most common drivers for hiring a financial advisor, revealing that investor motivations go beyond just financial factors.

The Top 5 Reasons Clients Hire a Financial Advisor
What drives investors to hire a financial advisor?
From saving for a down payment to planning for retirement, clients turn to advisors to guide them through life’s complex financial decisions. However, many of the key reasons for hiring a financial advisor stem from emotional factors, and go beyond purely financial motivations.
We partnered with Morningstar to show the top reasons clients hire a financial advisor to provide insight on what’s driving investor behavior.
What Drives Hiring Decisions?
Here are the most common reasons for hiring an advisor, based on a survey of 312 respondents.
| Reason for Hiring | % of Respondents Citing This Reason | Type of Motivation |
|---|---|---|
| Specific goals or needs | 32% | Financial-based reason |
| Discomfort handling finances | 32% | Emotion-based reason |
| Behavioral coaching | 17% | Emotion-based reason |
| Recommended by family or friends | 12% | Emotion-based reason |
| Quality of relationship | 10% | Emotion-based reason |
Numbers may not total 100 due to rounding. Respondents could select more than one answer.
While financial factors played an important role in hiring decisions, emotional reasons made up the largest share of total responses.
This illustrates that clients place a high degree of importance on reaching specific goals or needs, and how an advisor communicates with them. Furthermore, clients seek out advisors for behavioral coaching to help them make informed decisions while staying the course.
Key Takeaways
With this in mind, here are five ways advisors can provide value to their clients and grow their practice:
- Address clients’ emotional needs early on
- Demonstrate how you can offer support
- Use ordinary language
- Provide education to help clients stay on track
- Acknowledge that these are issues we all face
By addressing emotional factors, advisors can more effectively help clients’ navigate intricate financial decisions and avoid common behavioral mistakes.

The Top 5 Reasons Clients Fire a Financial Advisor

The Top 5 Reasons Clients Hire a Financial Advisor

Visualizing the Growth of $100, by Asset Class

How Small Investments Make a Big Impact Over Time

What Were the Top Performing Investment Themes of 2023?
-

 Infographics2 years ago
The Top Investment Quotes Every Investor Should Know
-

 Markets in a Minute2 years ago
Mapped: The Growth in U.S. House Prices by State
-

 Markets in a Minute2 years ago
How Closely Related Are Historical Mortgage Rates and Housing Prices?
-

 Infographics2 years ago
A Visual Guide to Stagflation, Inflation, and Deflation
-

 Markets in a Minute1 year ago
Mapped: Global Energy Prices, by Country in 2022
-

 Markets in a Minute2 years ago
Visualizing Historical Oil Prices (1968-2022)
-

 Infographics1 year ago
Visual Guide: The Three Types of Economic Indicators
-

 Markets in a Minute2 years ago
Mapped: Global Macroeconomic Risk, by Country in 2022
