
Markets in a Minute
Charted: The Rise of Stock Buybacks Over 20 Years
This infographic is available as a poster.
This infographic is available as a poster.
Chart: The Rise of Stock Buybacks Over 20 Years
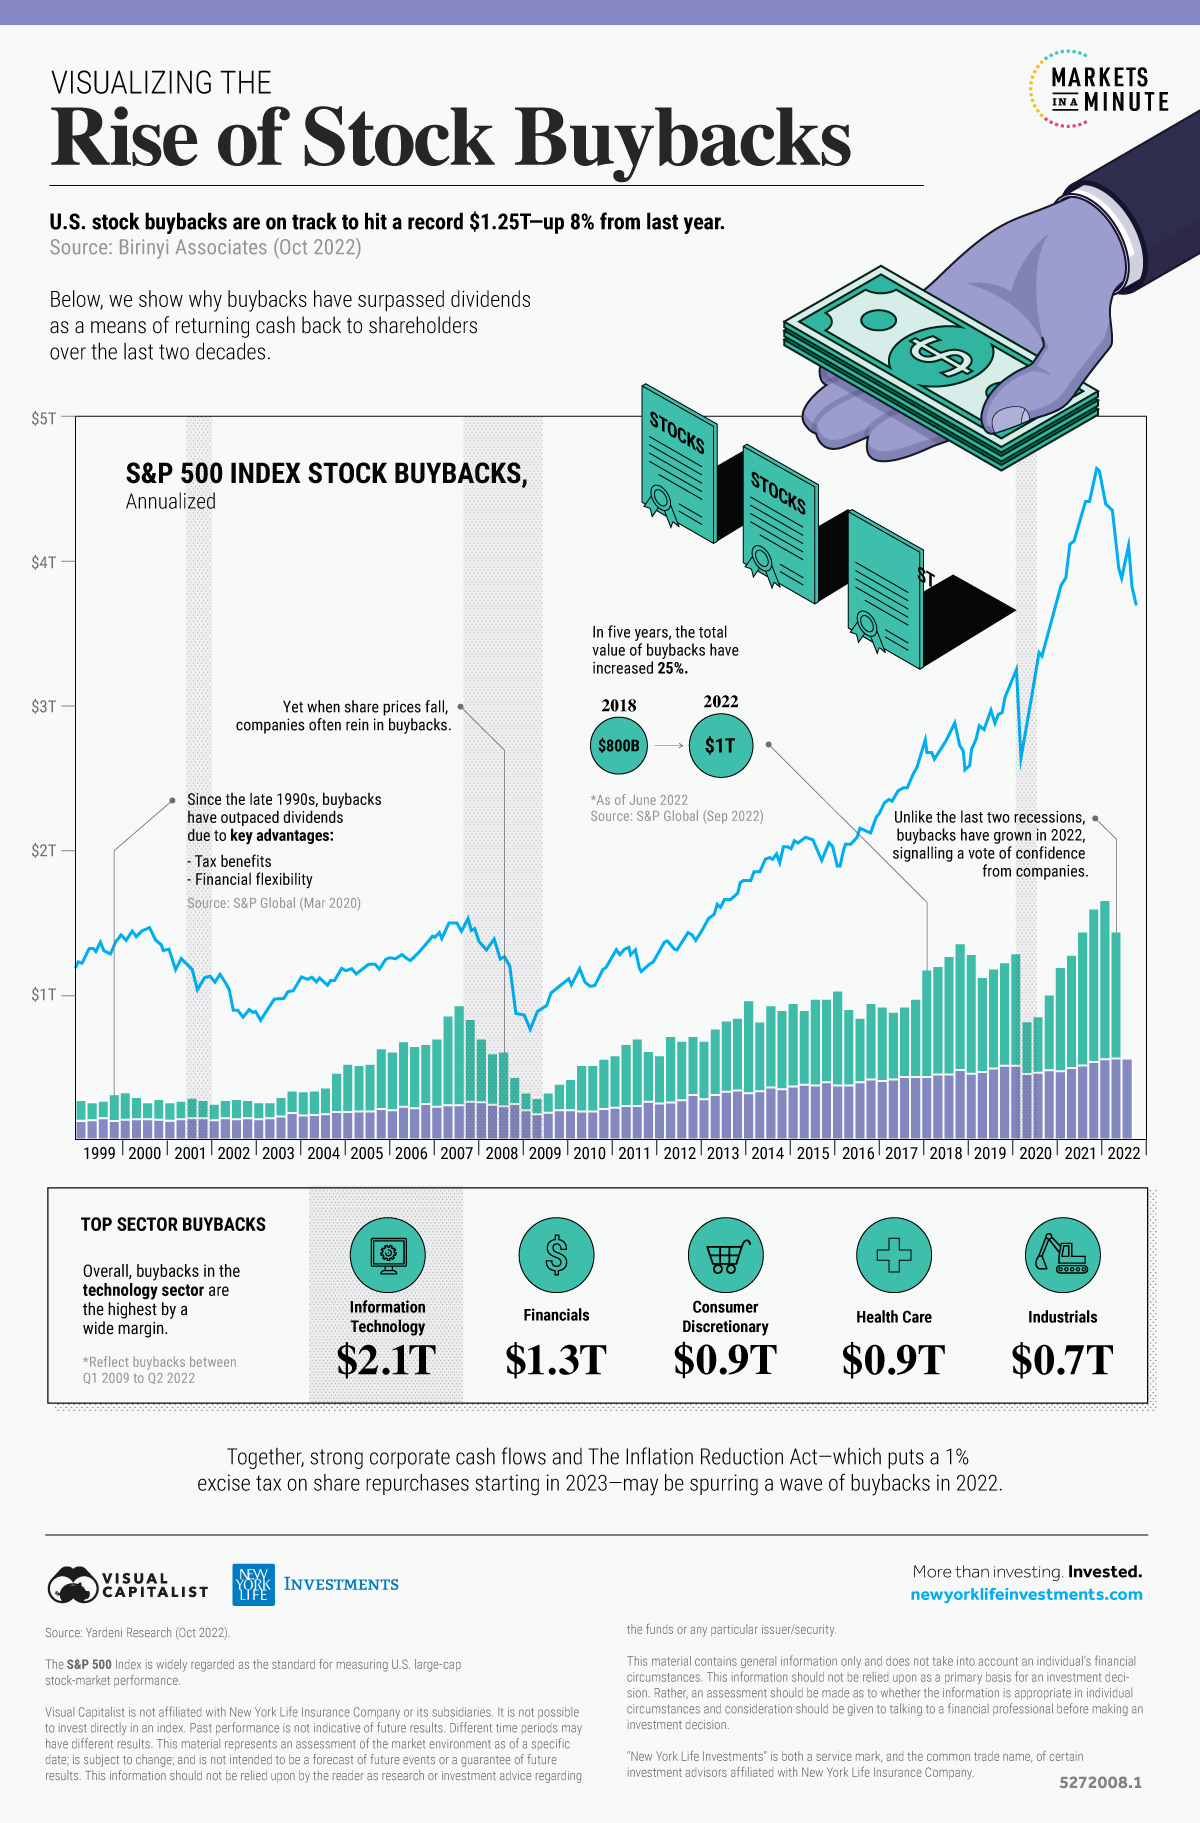
Despite market turbulence, stock buybacks are on track to hit record levels by year-end.
Spurring this wave of buybacks are strong corporate cash flows—sitting near $2 trillion—and a 1% excise tax on buybacks approaching in 2023. This signals a vote of confidence from corporations on their financial health even as a recession looms large.
In this Markets in a Minute from New York Life Investments, we chart the growth of buybacks over the last two decades and the implications for investors looking ahead.
How Stock Buybacks Work
In stock buybacks, corporations buy their own shares from existing shareholders. This reduces the number of shares in the market and boosts earnings per share. Often, this can increase share prices given the rise in earnings growth.
It was not until 1982 that share repurchases became legal, driving wider usage among corporations as a capital allocation tool.
By comparison, dividends are another common form of distributing capital back to shareholders.
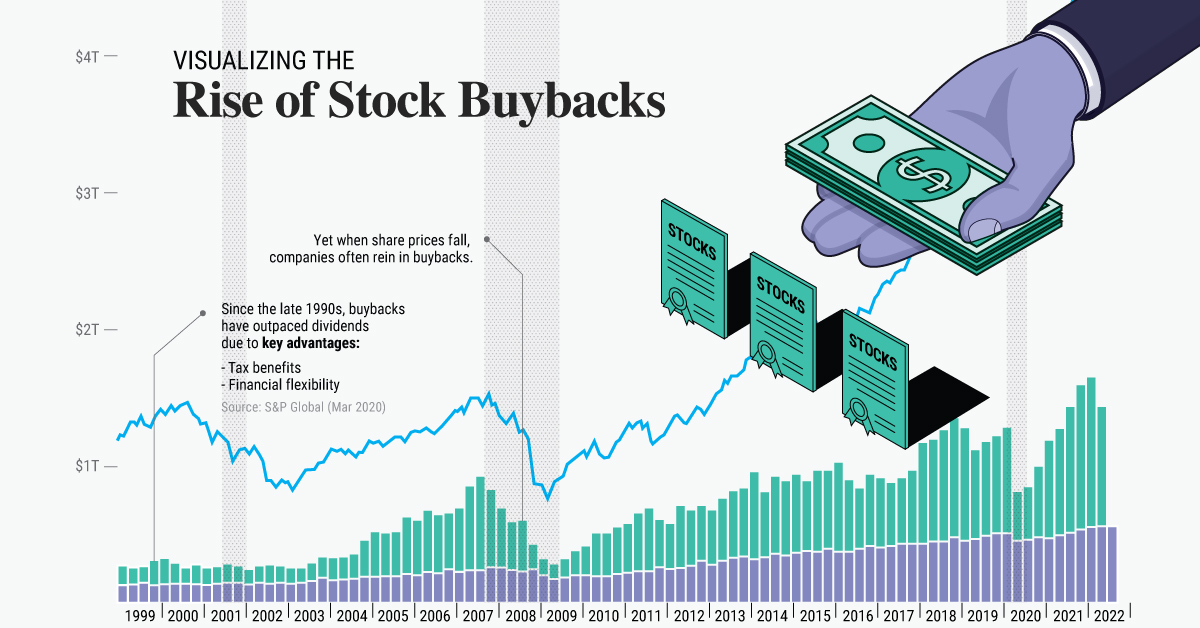
Dividends are bound by strict policies and do not offer the same tax advantages and flexibility as buybacks. While dividends are taxed as income, buybacks are taxed as capital gains—making them a preferential choice for investors. Given these advantages, stock buybacks have outpaced dividends over the last two decades.
In fact, in the third quarter of 2022, an estimated one in five companies in the S&P 500 Index conducted buybacks that in turn increased their earnings per share by at least 4% year-over-year.
Stock Buyback Trends
As the below table shows, stock buybacks in the S&P 500 Index outnumber dividends by about double in 2022:
| Year | S&P 500 Stock Buybacks | S&P 500 Dividends |
|---|---|---|
| 2022* | $1.00T | $0.54T |
| 2021 | $0.88T | $0.51T |
| 2020 | $0.52T | $0.48T |
| 2019 | $0.73T | $0.49T |
| 2018 | $0.81T | $0.46T |
Source: S&P Dow Jones Indices (Sep 2022). *For the 12-months ending June 2022.
However, stock buybacks fluctuate more often than dividends since corporations can turn them on or off. For example, in 2020, buybacks sharply declined given growing financial uncertainty. Meanwhile, companies issued dividends at a steady pace.
In this way, when share prices decline, buybacks typically decrease.
Yet unlike the last two recessions in 2008 and 2020, buybacks have shown notable strength in 2022 in spite of falling share prices.
What Are the Top Sectors for Stock Buybacks?
We can see in the table below that the biggest share repurchasers are in the tech sector, with $2.1 trillion in buybacks since 2009.
| Sector | Cumulative Buybacks Since 2009 | Q2 Buybacks |
|---|---|---|
| Information Technology | $2,060.4B | $72.0B |
| Financials | $1,265.0B | $21.2B |
| Consumer Discretionary | $941.7B | $27.6B |
| Health Care | $929.1B | $17.2B |
| Industrials | $717.6B | $17.4B |
| Consumer Staples | $548.1B | $10.7B |
| Communication Services | $369.6B | $29.4B |
| Energy | $337.9B | $13.4B |
| Materials | $187.0B | $8.7B |
| Utilities | $26.8B | $0.5B |
| Real Estate | $16.9B | $1.1B |
| Total | $7,382.6B | $219.6B |
Source: Yardeni Research (Nov 2022). Represents stock buybacks for S&P 500 Index sectors.
On the other hand, utilities and other capital-intensive sectors tend to spend less on buybacks in contrast to asset-light sectors such as tech and financials.
What is also characteristic to share buybacks is their concentration. As we have seen in the second quarter this year, the top 20% of buybacks make up 47% of all repurchases across the S&P 500 Index.
New Tax On Stock Buybacks
Stock buybacks have drawn criticism for using cash to benefit shareholders instead of boosting production or improving the quality of the business.
In response, beginning in 2023, the Inflation Reduction Act puts a 1% excise tax on buybacks.
What this means is that public companies based in the U.S. must now pay a 1% tax on share repurchases, which could result in millions of additional expenses. Given this new tax rule, corporations may be accelerating buybacks ahead of year-end.
Implications for Investors
As stock buybacks have grown in prominence, it’s worth noting that not all are equal.
When a buyback aligns with a company’s long-term plan, and the company can cover their operational expenses, it can support the stability and growth of the company. When stock prices are volatile, companies can repurchase shares when they are undervalued.
By contrast, if a company takes on excess leverage in order to buyback shares, it can contribute to lower financial resilience. When a company uses a buyback to opportunistically repurchase shares, the boost in share prices may be short-lived.
In addition, it could also prevent capital from being directed to growth initiatives. In this way, it’s important to consider stock buybacks on a case-by-case basis.
With this in mind, investors can look to companies with healthy balance sheets that can weather economic storms. Here, companies that illustrate price discipline and buy back shares at a discount may help build long-term value, providing benefits to investors who stay the course.


Markets in a Minute
The Top 5 Reasons Clients Fire a Financial Advisor
Firing an advisor is often driven by more than cost and performance factors. Here are the top reasons clients ‘break up’ with their advisors.

The Top 5 Reasons Clients Fire a Financial Advisor
What drives investors to fire a financial advisor?
From saving for a down payment to planning for retirement, clients turn to advisors to guide them through life’s complex financial decisions. However, many of the key reasons for firing a financial advisor stem from emotional factors, and go beyond purely financial motivations.
We partnered with Morningstar to show the top reasons clients fire an advisor to provide insight on what’s driving investor behavior.
What Drives Firing Decisions?
Here are the top reasons clients terminated their advisor, based on a survey of 184 respondents:
| Reason for Firing | % of Respondents Citing This Reason | Type of Motivation |
|---|---|---|
| Quality of financial advice and services | 32% | Emotion-based reason |
| Quality of relationship | 21% | Emotion-based reason |
| Cost of services | 17% | Financial-based reason |
| Return performance | 11% | Financial-based reason |
| Comfort handling financial issues on their own | 10% | Emotion-based reason |
Numbers may not total 100 due to rounding. Respondents could select more than one answer.
Numbers may not total 100 due to rounding. Respondents could select more than one answer.
While firing an advisor is rare, many of the primary drivers behind firing decisions are also emotionally driven.
Often, advisors were fired due to the quality of the relationship. In many cases, this was due to an advisor not dedicating enough time to fully grasp their personal financial goals. Additionally, wealthier, and more financially literate clients are more likely to fire their advisors—highlighting the importance of understanding the client.
Key Takeaways
Given these driving factors, here are five ways that advisors can build a lasting relationship through recognizing their clients’ emotional needs:
- Understand your clients’ deeper goals
- Reach out proactively
- Act as a financial coach
- Keep clients updated
- Conduct goal-setting exercises on a regular basis
By communicating their value and setting expectations early, advisors can help prevent setbacks in their practice by adeptly recognizing the emotional motivators of their clients.
Markets in a Minute
The Top 5 Reasons Clients Hire a Financial Advisor
Here are the most common drivers for hiring a financial advisor, revealing that investor motivations go beyond just financial factors.

The Top 5 Reasons Clients Hire a Financial Advisor
What drives investors to hire a financial advisor?
From saving for a down payment to planning for retirement, clients turn to advisors to guide them through life’s complex financial decisions. However, many of the key reasons for hiring a financial advisor stem from emotional factors, and go beyond purely financial motivations.
We partnered with Morningstar to show the top reasons clients hire a financial advisor to provide insight on what’s driving investor behavior.
What Drives Hiring Decisions?
Here are the most common reasons for hiring an advisor, based on a survey of 312 respondents.
| Reason for Hiring | % of Respondents Citing This Reason | Type of Motivation |
|---|---|---|
| Specific goals or needs | 32% | Financial-based reason |
| Discomfort handling finances | 32% | Emotion-based reason |
| Behavioral coaching | 17% | Emotion-based reason |
| Recommended by family or friends | 12% | Emotion-based reason |
| Quality of relationship | 10% | Emotion-based reason |
Numbers may not total 100 due to rounding. Respondents could select more than one answer.
While financial factors played an important role in hiring decisions, emotional reasons made up the largest share of total responses.
This illustrates that clients place a high degree of importance on reaching specific goals or needs, and how an advisor communicates with them. Furthermore, clients seek out advisors for behavioral coaching to help them make informed decisions while staying the course.
Key Takeaways
With this in mind, here are five ways advisors can provide value to their clients and grow their practice:
- Address clients’ emotional needs early on
- Demonstrate how you can offer support
- Use ordinary language
- Provide education to help clients stay on track
- Acknowledge that these are issues we all face
By addressing emotional factors, advisors can more effectively help clients’ navigate intricate financial decisions and avoid common behavioral mistakes.

The Top 5 Reasons Clients Fire a Financial Advisor

The Top 5 Reasons Clients Hire a Financial Advisor

Visualizing the Growth of $100, by Asset Class

How Small Investments Make a Big Impact Over Time

What Were the Top Performing Investment Themes of 2023?
-

 Infographics2 years ago
The Top Investment Quotes Every Investor Should Know
-

 Markets in a Minute2 years ago
Mapped: The Growth in U.S. House Prices by State
-

 Markets in a Minute2 years ago
How Closely Related Are Historical Mortgage Rates and Housing Prices?
-

 Infographics2 years ago
A Visual Guide to Stagflation, Inflation, and Deflation
-

 Markets in a Minute1 year ago
Mapped: Global Energy Prices, by Country in 2022
-

 Infographics3 years ago
The 5 Fastest Growing Industries of the Next Decade
-

 Markets in a Minute2 years ago
Visualizing Historical Oil Prices (1968-2022)
-

 Infographics1 year ago
Visual Guide: The Three Types of Economic Indicators
