
Markets in a Minute
Charted: Unemployment and Recessions Over 70 Years
This infographic is available as a poster.
This infographic is available as a poster.
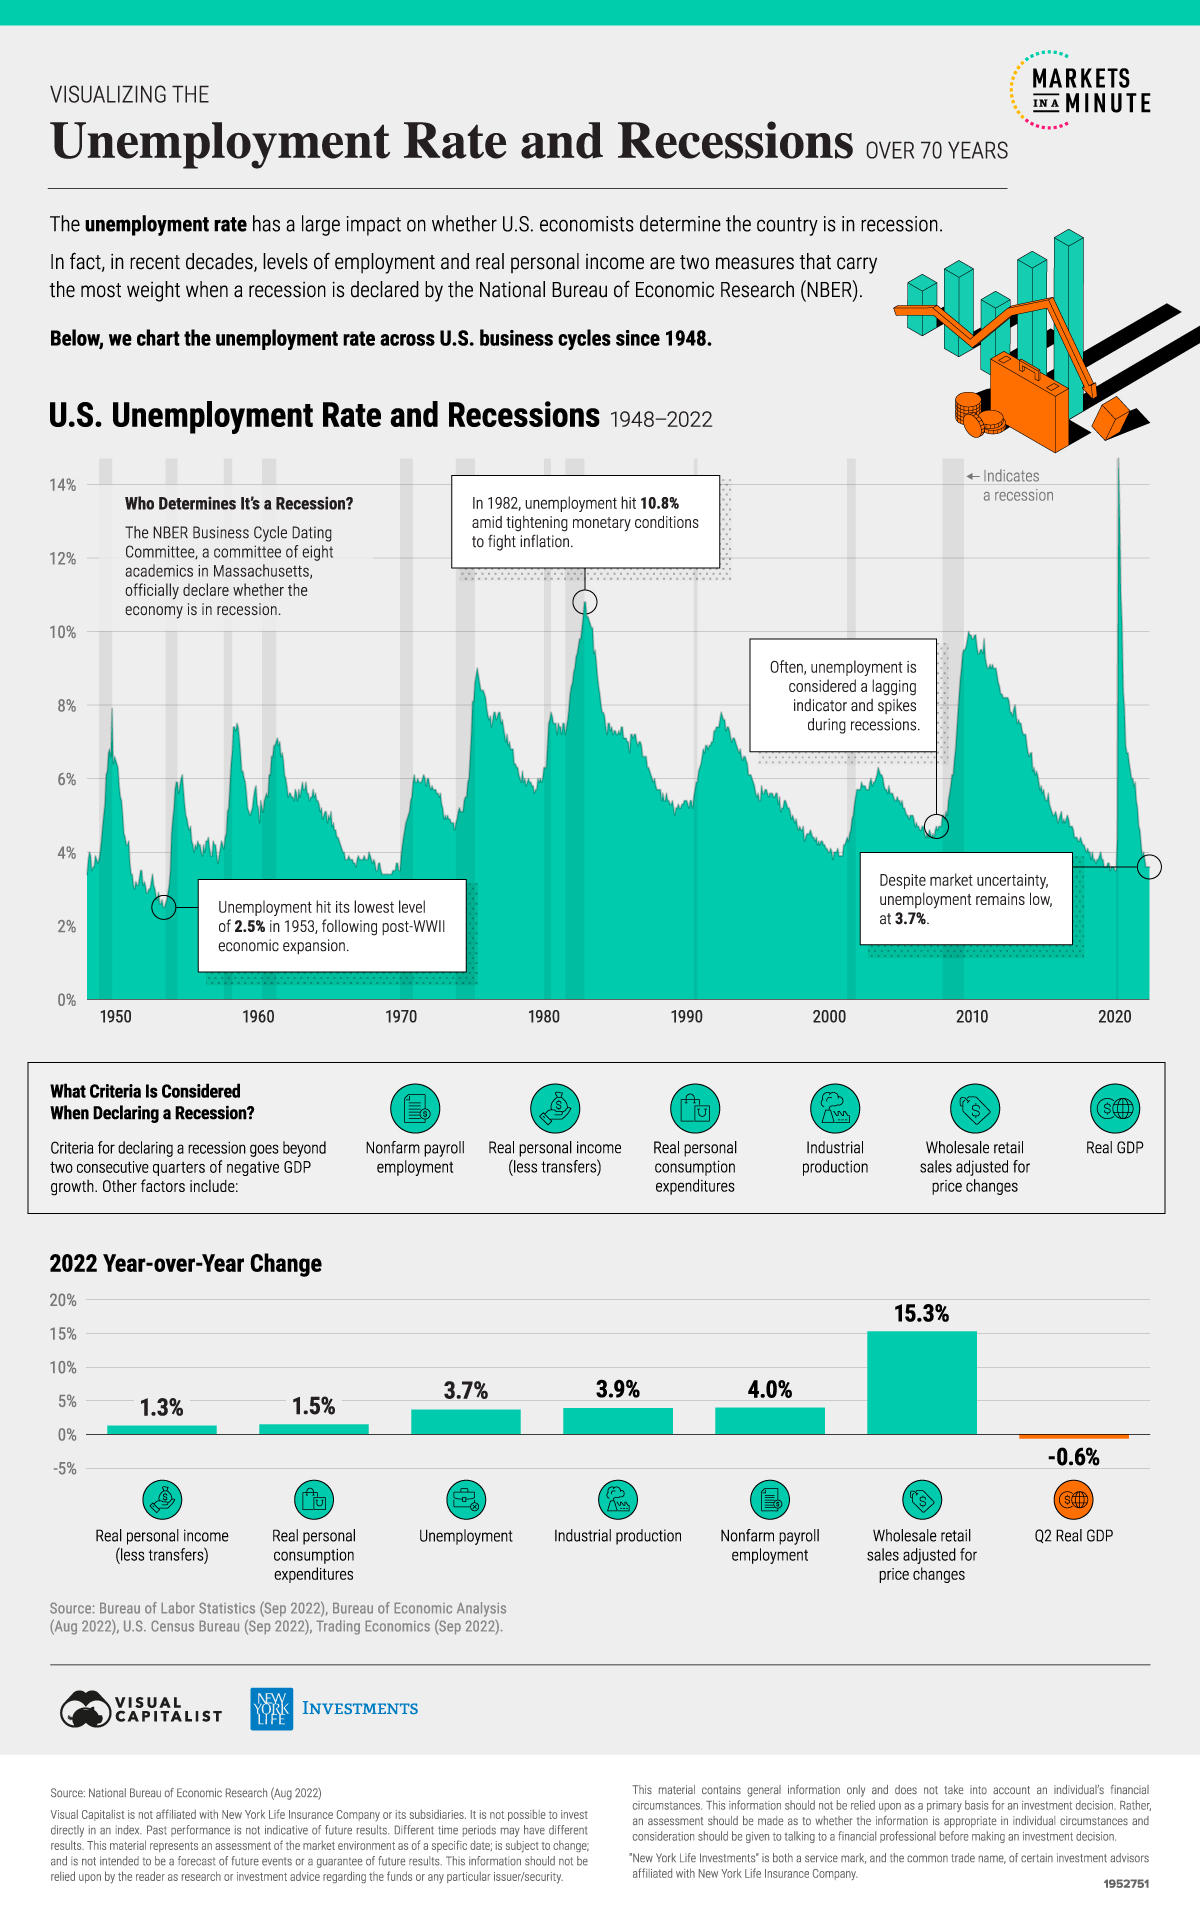
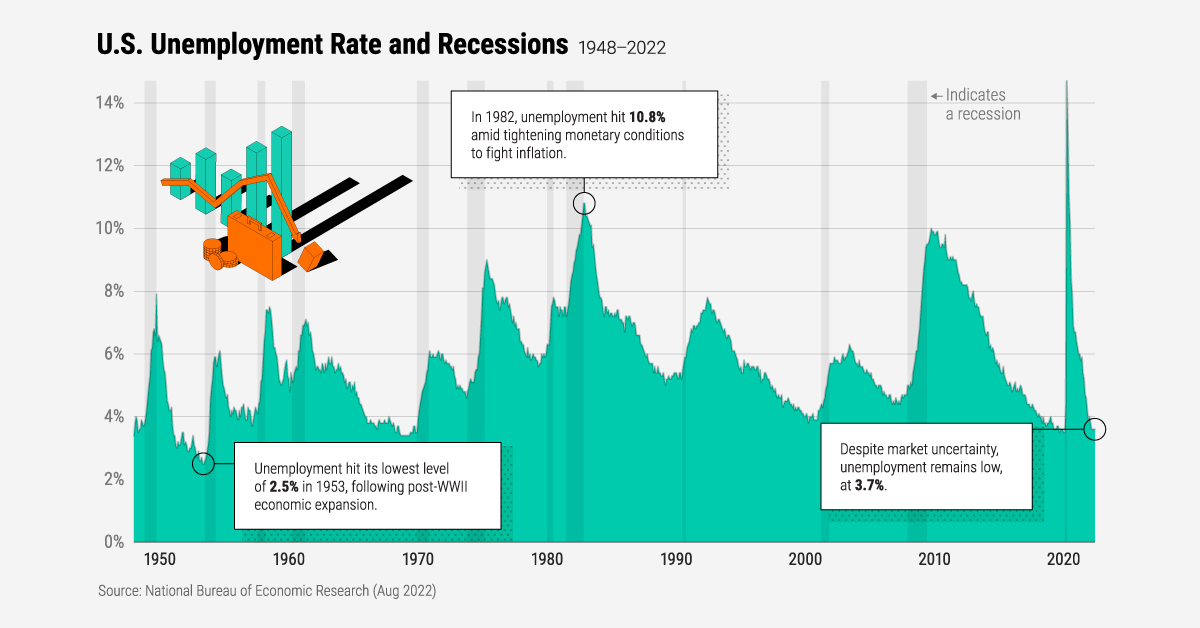
Charting Unemployment and Recessions Over 70 Years
As of August 2022, the U.S. unemployment rate sits at 3.7%, below its 74-year average of 5.5%.
Why does this matter today? Employment factors heavily into whether economists determine the country is in a recession. In fact, in the last several decades, employment-related factors have some of the heaviest weightings when a recession determination is made.
In this Markets in a Minute from New York Life Investments, we look at unemployment and recessions since 1948.
Why Is the Unemployment Rate Important?
To start, let’s look at how unemployment affects the economy.
During low unemployment and a strong labor market, wages often increase. This is a central concern to the Federal Reserve as higher wages could spur more spending and notch up inflation.
To curb inflation, the central bank may increase interest rates. As the economy begins to feel the effects of rising interest rates, it may fall into a recession as the cost of capital increases and consumer spending slows.
Who Determines It’s a Recession?
A committee of eight economists at the National Bureau of Economic Research (NBER) in Massachusetts make the call, although often several months after a recession has happened. As a result, employment data often acts as a lagging indicator.
This committee of academics looks at a number of variables beyond two consecutive quarters of negative GDP growth. Other factors include:
- Nonfarm payroll employment
- Real personal income less transfers
- Real personal consumption expenditures
- Industrial production
- Wholesale retail sales adjusted for price changes
- Real GDP
A widespread decline in economic activity across the economy, as opposed to just one sector, is also considered.
Unemployment and Recessions Over History
Over the last 12 business cycles, the unemployment rate averaged 4.7% at the peak and 8.1% during the trough. The below table shows how the unemployment rate changed over various U.S. business cycles, with data from NBER:
| Peak Month | Unemployment Rate | Trough Month | Unemployment Rate |
|---|---|---|---|
| Nov 1948 | 3.8% | Oct 1949 | 7.9% |
| Jul 1953 | 2.6% | May 1954 | 5.9% |
| Aug 1957 | 4.1% | Apr 1958 | 7.4% |
| Apr 1960 | 5.2% | Feb 1961 | 6.9% |
| Dec 1969 | 3.5% | Nov 1970 | 5.9% |
| Nov 1973 | 4.8% | Mar 1975 | 8.6% |
| Jan 1980 | 6.3% | Jul 1980 | 7.8% |
| Jul 1981 | 7.2% | Nov 1982 | 10.8% |
| Jul 1990 | 5.5% | Mar 1991 | 6.8% |
| Mar 2001 | 4.3% | Nov 2001 | 5.5% |
| Dec 2007 | 5.0% | Jun 2009 | 9.5% |
| Feb 2020 | 3.5% | Apr 2020 | 14.7% |
In 1953, following post-WWII expansion, the unemployment rate fell to 2.6%, near record lows.
During this time, the economy faced strong consumer demand and high inflation after a period of prolonged low interest rates. To combat price pressures, the Federal Reserve increased interest rates in 1954, and the economy fell into recession. By May 1954, the unemployment rate more than doubled.
In 1981, the unemployment rate was high during both the peak of the cycle (7.2%) and the trough (10.8%) by late 1982. This marked the end of the 1970s stagflationary era, characterized by slow growth and high unemployment.
More recently, at the peak of the business cycle in 2020 the unemployment rate stood at 3.5%, closer to levels seen today.
Unemployment Today: A Double-Edged Sword
As of July 2022, the number of job vacancies is at 11.2 million, near record highs.
To reign in the inflationary pressures of the current job market—which saw year-over-year wage increases of 5.2% in both July and August—the Federal Reserve may take a more aggressive stance on interest rate hikes.
The good news is that labor force participation is increasing. As of August, labor force participation was within 1% of pre-pandemic levels, offering relief to the labor market supply. Higher labor force participation could lessen wage growth without unemployment levels having to rise. Since more people are competing for jobs, there is less leverage for salary negotiation.
Going further, one study shows that since the Great Financial Crisis, labor market participation has had a greater influence on wage growth than unemployment levels or job openings.
Against these opposing forces of higher job vacancies and higher labor market participation, the outlook for unemployment, along with its wider effects on the economy, remain unclear.


Markets in a Minute
The Top 5 Reasons Clients Fire a Financial Advisor
Firing an advisor is often driven by more than cost and performance factors. Here are the top reasons clients ‘break up’ with their advisors.

The Top 5 Reasons Clients Fire a Financial Advisor
What drives investors to fire a financial advisor?
From saving for a down payment to planning for retirement, clients turn to advisors to guide them through life’s complex financial decisions. However, many of the key reasons for firing a financial advisor stem from emotional factors, and go beyond purely financial motivations.
We partnered with Morningstar to show the top reasons clients fire an advisor to provide insight on what’s driving investor behavior.
What Drives Firing Decisions?
Here are the top reasons clients terminated their advisor, based on a survey of 184 respondents:
| Reason for Firing | % of Respondents Citing This Reason | Type of Motivation |
|---|---|---|
| Quality of financial advice and services | 32% | Emotion-based reason |
| Quality of relationship | 21% | Emotion-based reason |
| Cost of services | 17% | Financial-based reason |
| Return performance | 11% | Financial-based reason |
| Comfort handling financial issues on their own | 10% | Emotion-based reason |
Numbers may not total 100 due to rounding. Respondents could select more than one answer.
Numbers may not total 100 due to rounding. Respondents could select more than one answer.
While firing an advisor is rare, many of the primary drivers behind firing decisions are also emotionally driven.
Often, advisors were fired due to the quality of the relationship. In many cases, this was due to an advisor not dedicating enough time to fully grasp their personal financial goals. Additionally, wealthier, and more financially literate clients are more likely to fire their advisors—highlighting the importance of understanding the client.
Key Takeaways
Given these driving factors, here are five ways that advisors can build a lasting relationship through recognizing their clients’ emotional needs:
- Understand your clients’ deeper goals
- Reach out proactively
- Act as a financial coach
- Keep clients updated
- Conduct goal-setting exercises on a regular basis
By communicating their value and setting expectations early, advisors can help prevent setbacks in their practice by adeptly recognizing the emotional motivators of their clients.
Markets in a Minute
The Top 5 Reasons Clients Hire a Financial Advisor
Here are the most common drivers for hiring a financial advisor, revealing that investor motivations go beyond just financial factors.

The Top 5 Reasons Clients Hire a Financial Advisor
What drives investors to hire a financial advisor?
From saving for a down payment to planning for retirement, clients turn to advisors to guide them through life’s complex financial decisions. However, many of the key reasons for hiring a financial advisor stem from emotional factors, and go beyond purely financial motivations.
We partnered with Morningstar to show the top reasons clients hire a financial advisor to provide insight on what’s driving investor behavior.
What Drives Hiring Decisions?
Here are the most common reasons for hiring an advisor, based on a survey of 312 respondents.
| Reason for Hiring | % of Respondents Citing This Reason | Type of Motivation |
|---|---|---|
| Specific goals or needs | 32% | Financial-based reason |
| Discomfort handling finances | 32% | Emotion-based reason |
| Behavioral coaching | 17% | Emotion-based reason |
| Recommended by family or friends | 12% | Emotion-based reason |
| Quality of relationship | 10% | Emotion-based reason |
Numbers may not total 100 due to rounding. Respondents could select more than one answer.
While financial factors played an important role in hiring decisions, emotional reasons made up the largest share of total responses.
This illustrates that clients place a high degree of importance on reaching specific goals or needs, and how an advisor communicates with them. Furthermore, clients seek out advisors for behavioral coaching to help them make informed decisions while staying the course.
Key Takeaways
With this in mind, here are five ways advisors can provide value to their clients and grow their practice:
- Address clients’ emotional needs early on
- Demonstrate how you can offer support
- Use ordinary language
- Provide education to help clients stay on track
- Acknowledge that these are issues we all face
By addressing emotional factors, advisors can more effectively help clients’ navigate intricate financial decisions and avoid common behavioral mistakes.

The Top 5 Reasons Clients Fire a Financial Advisor

The Top 5 Reasons Clients Hire a Financial Advisor

Visualizing the Growth of $100, by Asset Class

How Small Investments Make a Big Impact Over Time

What Were the Top Performing Investment Themes of 2023?
-

 Infographics2 years ago
The Top Investment Quotes Every Investor Should Know
-

 Markets in a Minute2 years ago
Mapped: The Growth in U.S. House Prices by State
-

 Markets in a Minute2 years ago
How Closely Related Are Historical Mortgage Rates and Housing Prices?
-

 Infographics2 years ago
A Visual Guide to Stagflation, Inflation, and Deflation
-

 Markets in a Minute1 year ago
Mapped: Global Energy Prices, by Country in 2022
-

 Markets in a Minute2 years ago
Visualizing Historical Oil Prices (1968-2022)
-

 Infographics1 year ago
Visual Guide: The Three Types of Economic Indicators
-

 Markets in a Minute2 years ago
Mapped: Global Macroeconomic Risk, by Country in 2022
