
Markets in a Minute
Mapped: Economic Predictions for 2022 and Beyond


How to use: Arrows on side navigate between 2022 and 2023.

This infographic is available as a poster.
Economic Predictions for 2022 and Beyond
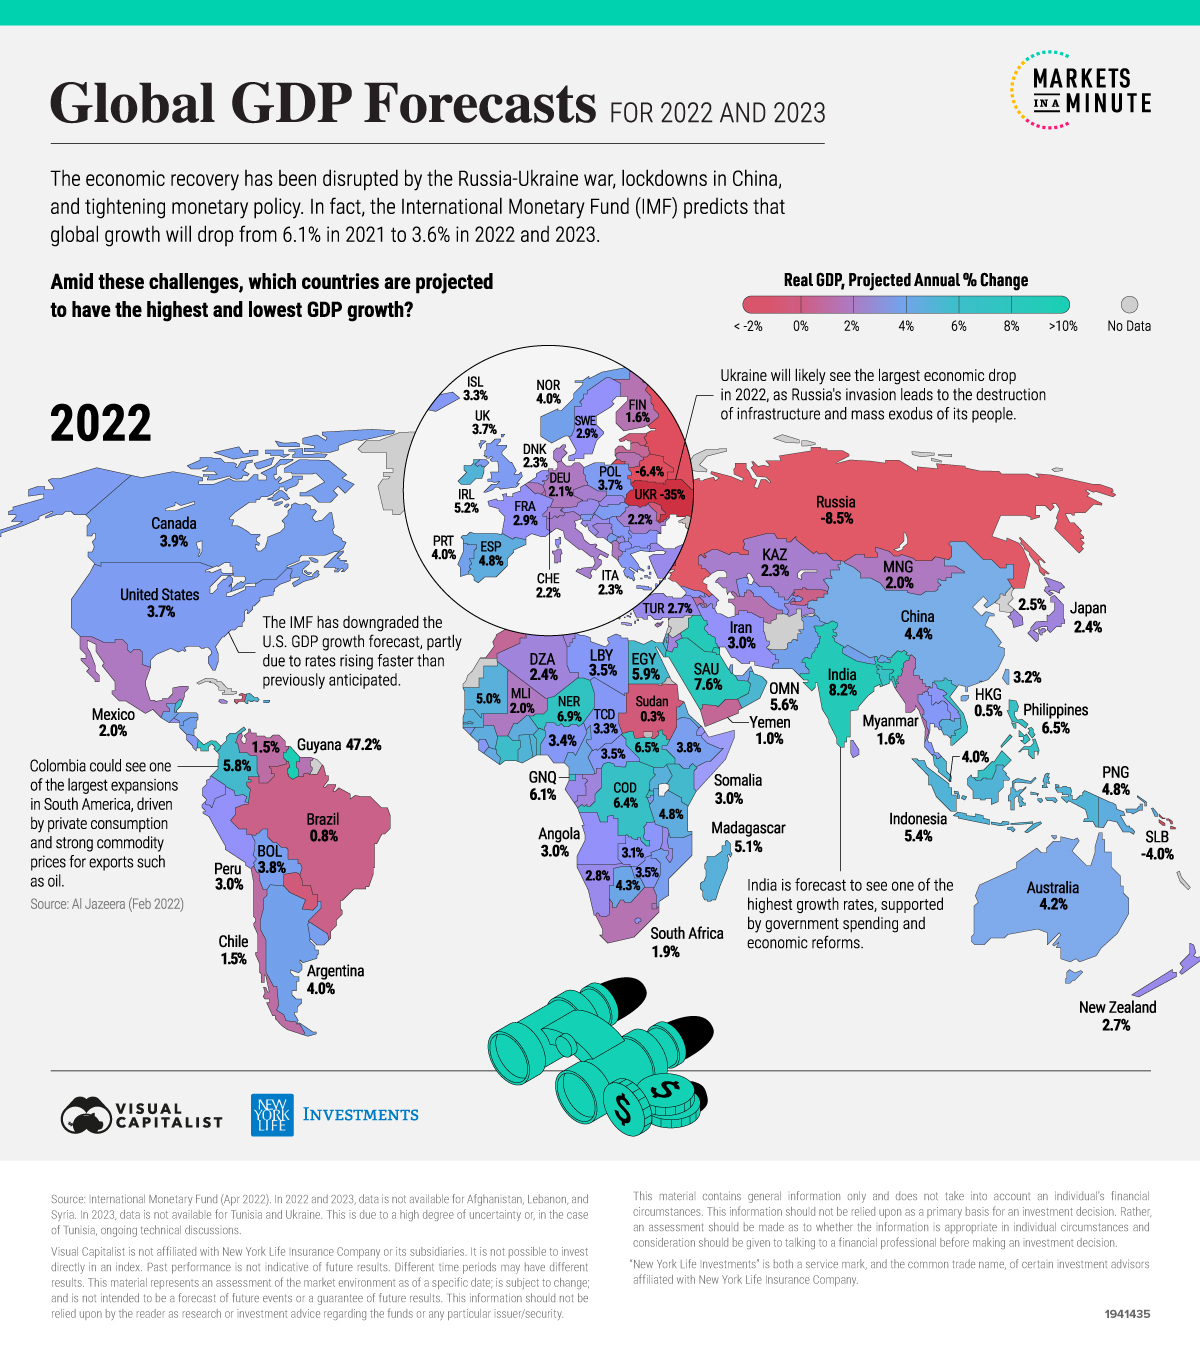
How resilient will countries be in 2022? Economies have to contend with commodity shortages related to the Russia-Ukraine war, supply chain issues due to lockdowns in China, and tightening monetary policy as inflation rises.
In light of these challenges, the International Monetary Fund (IMF) has lowered its economic predictions for 2022 and beyond. The IMF predicts that global GDP growth will slow from 6.1% in 2021 to 3.6% in 2022 and 2023.
In this Markets in a Minute from New York Life Investments, we explore GDP projections by country. It’s the second in a two-part series that explores GDP growth around the world.
GDP Forecasts by Country
Due to the war in Ukraine, the IMF notes that the economic predictions for 2022 and beyond have considerable uncertainty. The projections also assume that the conflict remains confined to Ukraine and that the pandemic’s health and economic consequences lessen during 2022.
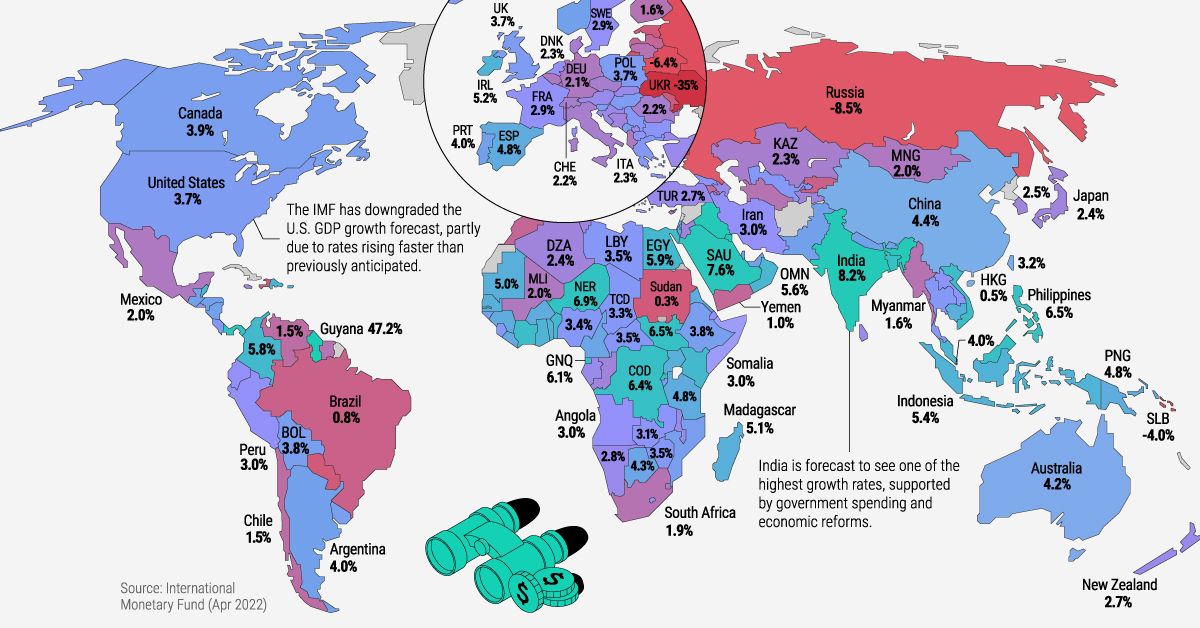
Here are the IMF’s predictions for real GDP growth by country. Unsurprisingly, Ukraine will have the most severe contraction of -35% this year. Russia’s invasion has damaged or destroyed 30% of the nation’s infrastructure, and more than 14 million people have fled their homes.
| Jurisdiction | 2022P | 2023P |
|---|---|---|
| Afghanistan | n/a | n/a |
| Albania | 2.0% | 2.8% |
| Algeria | 2.4% | 2.4% |
| Andorra | 4.5% | 2.7% |
| Angola | 3.0% | 3.3% |
| Antigua and Barbuda | 6.5% | 5.4% |
| Argentina | 4.0% | 3.0% |
| Armenia | 1.5% | 4.0% |
| Aruba | 2.7% | 3.7% |
| Australia | 4.2% | 2.5% |
| Austria | 2.6% | 3.0% |
| Azerbaijan | 2.8% | 2.6% |
| Bahrain | 3.3% | 3.0% |
| Bangladesh | 6.4% | 6.7% |
| Barbados | 11.2% | 4.9% |
| Belarus | -6.4% | 0.4% |
| Belgium | 2.1% | 1.4% |
| Belize | 5.7% | 3.4% |
| Benin | 5.9% | 6.2% |
| Bhutan | 4.4% | 4.5% |
| Bolivia | 3.8% | 3.7% |
| Bosnia and Herzegovina | 2.5% | 2.3% |
| Botswana | 4.3% | 4.2% |
| Brazil | 0.8% | 1.4% |
| Brunei Darussalam | 5.8% | 2.6% |
| Bulgaria | 3.2% | 4.5% |
| Burkina Faso | 4.7% | 5.0% |
| Burundi | 3.6% | 4.6% |
| Cabo Verde | 5.2% | 5.8% |
| Cambodia | 5.1% | 5.9% |
| Cameroon | 4.3% | 4.9% |
| Canada | 3.9% | 2.8% |
| Central African Republic | 3.5% | 3.7% |
| Chad | 3.3% | 3.5% |
| Chile | 1.5% | 0.5% |
| China | 4.4% | 5.1% |
| Colombia | 5.8% | 3.6% |
| Comoros | 3.5% | 3.7% |
| Costa Rica | 3.3% | 3.1% |
| Croatia | 2.7% | 4.0% |
| Côte d'Ivoire | 6.0% | 6.7% |
| Cyprus | 2.1% | 3.5% |
| Czech Republic | 2.3% | 4.2% |
| Democratic Republic of the Congo | 6.4% | 6.9% |
| Denmark | 2.3% | 1.7% |
| Djibouti | 3.0% | 5.0% |
| Dominica | 6.8% | 5.0% |
| Dominican Republic | 5.5% | 5.0% |
| Ecuador | 2.9% | 2.7% |
| Egypt | 5.9% | 5.0% |
| El Salvador | 3.0% | 2.3% |
| Equatorial Guinea | 6.1% | -2.9% |
| Eritrea | 4.7% | 3.6% |
| Estonia | 0.2% | 2.2% |
| Eswatini | 2.1% | 1.8% |
| Ethiopia | 3.8% | 5.7% |
| Fiji | 6.8% | 7.7% |
| Finland | 1.6% | 1.7% |
| France | 2.9% | 1.4% |
| Gabon | 2.7% | 3.4% |
| Georgia | 3.2% | 5.8% |
| Germany | 2.1% | 2.7% |
| Ghana | 5.2% | 5.1% |
| Greece | 3.5% | 2.6% |
| Grenada | 3.6% | 3.6% |
| Guatemala | 4.0% | 3.6% |
| Guinea | 4.8% | 5.8% |
| Guinea-Bissau | 3.8% | 4.5% |
| Guyana | 47.2% | 34.5% |
| Haiti | 0.3% | 1.4% |
| Honduras | 3.8% | 3.5% |
| Hong Kong SAR | 0.5% | 4.9% |
| Hungary | 3.7% | 3.6% |
| Iceland | 3.3% | 2.3% |
| India | 8.2% | 6.9% |
| Indonesia | 5.4% | 6.0% |
| Iraq | 9.5% | 5.7% |
| Ireland | 5.2% | 5.0% |
| Islamic Republic of Iran | 3.0% | 2.0% |
| Israel | 5.0% | 3.5% |
| Italy | 2.3% | 1.7% |
| Jamaica | 2.5% | 3.3% |
| Japan | 2.4% | 2.3% |
| Jordan | 2.4% | 3.1% |
| Kazakhstan | 2.3% | 4.4% |
| Kenya | 5.7% | 5.3% |
| Kiribati | 1.1% | 2.8% |
| Korea | 2.5% | 2.9% |
| Kosovo | 2.8% | 3.9% |
| Kuwait | 8.2% | 2.6% |
| Kyrgyz Republic | 0.9% | 5.0% |
| Lao P.D.R. | 3.2% | 3.5% |
| Latvia | 1.0% | 2.4% |
| Lebanon | n/a | n/a |
| Lesotho | 3.1% | 1.6% |
| Liberia | 4.5% | 5.5% |
| Libya | 3.5% | 4.4% |
| Lithuania | 1.8% | 2.6% |
| Luxembourg | 1.8% | 2.1% |
| Macao SAR | 15.5% | 23.3% |
| Madagascar | 5.1% | 5.2% |
| Malawi | 2.7% | 4.3% |
| Malaysia | 5.6% | 5.5% |
| Maldives | 6.1% | 8.9% |
| Mali | 2.0% | 5.3% |
| Malta | 4.8% | 4.5% |
| Marshall Islands | 2.0% | 3.2% |
| Mauritania | 5.0% | 4.4% |
| Mauritius | 6.1% | 5.6% |
| Mexico | 2.0% | 2.5% |
| Micronesia | -0.5% | 2.8% |
| Moldova | 0.3% | 2.0% |
| Mongolia | 2.0% | 7.0% |
| Montenegro | 3.8% | 4.2% |
| Morocco | 1.1% | 4.6% |
| Mozambique | 3.8% | 5.0% |
| Myanmar | 1.6% | 3.0% |
| Namibia | 2.8% | 3.7% |
| Nauru | 0.9% | 2.0% |
| Nepal | 4.1% | 6.1% |
| Netherlands | 3.0% | 2.0% |
| New Zealand | 2.7% | 2.6% |
| Nicaragua | 3.8% | 2.2% |
| Niger | 6.9% | 7.2% |
| Nigeria | 3.4% | 3.1% |
| North Macedonia | 3.2% | 2.7% |
| Norway | 4.0% | 2.6% |
| Oman | 5.6% | 2.7% |
| Pakistan | 4.0% | 4.2% |
| Palau | 8.1% | 18.8% |
| Panama | 7.5% | 5.0% |
| Papua New Guinea | 4.8% | 4.3% |
| Paraguay | 0.3% | 4.5% |
| Peru | 3.0% | 3.0% |
| Philippines | 6.5% | 6.3% |
| Poland | 3.7% | 2.9% |
| Portugal | 4.0% | 2.1% |
| Puerto Rico | 4.8% | 0.4% |
| Qatar | 3.4% | 2.5% |
| Republic of Congo | 2.4% | 2.7% |
| Romania | 2.2% | 3.4% |
| Russia | -8.5% | -2.3% |
| Rwanda | 6.4% | 7.4% |
| São Tomé and Prìncipe | 1.6% | 2.8% |
| Samoa | 0.0% | 4.0% |
| San Marino | 1.3% | 1.1% |
| Saudi Arabia | 7.6% | 3.6% |
| Senegal | 5.0% | 9.2% |
| Serbia | 3.5% | 4.0% |
| Seychelles | 4.6% | 5.6% |
| Sierra Leone | 3.4% | 4.3% |
| Singapore | 4.0% | 2.9% |
| Slovak Republic | 2.6% | 5.0% |
| Slovenia | 3.7% | 3.0% |
| Solomon Islands | -4.0% | 3.2% |
| Somalia | 3.0% | 3.6% |
| South Africa | 1.9% | 1.4% |
| South Sudan | 6.5% | 5.6% |
| Spain | 4.8% | 3.3% |
| Sri Lanka | 2.6% | 2.7% |
| St. Kitts and Nevis | 10.0% | 4.7% |
| St. Lucia | 9.7% | 6.0% |
| St. Vincent and the Grenadines | 5.0% | 6.4% |
| Sudan | 0.3% | 3.9% |
| Suriname | 1.8% | 2.1% |
| Sweden | 2.9% | 2.7% |
| Switzerland | 2.2% | 1.4% |
| Syria | n/a | n/a |
| Taiwan Province of China | 3.2% | 2.9% |
| Tajikistan | 2.5% | 3.5% |
| Tanzania | 4.8% | 5.2% |
| Thailand | 3.3% | 4.3% |
| The Bahamas | 6.0% | 4.1% |
| The Gambia | 5.6% | 6.2% |
| Timor-Leste | 2.0% | 3.6% |
| Togo | 5.6% | 6.2% |
| Tonga | -1.7% | 3.0% |
| Trinidad and Tobago | 5.5% | 3.0% |
| Tunisia | 2.2% | n/a |
| Turkey | 2.7% | 3.0% |
| Turkmenistan | 1.6% | 2.5% |
| Tuvalu | 3.0% | 3.5% |
| Uganda | 4.9% | 6.5% |
| Ukraine | -35.0% | n/a |
| United Arab Emirates | 4.2% | 3.8% |
| United Kingdom | 3.7% | 1.2% |
| United States | 3.7% | 2.3% |
| Uruguay | 3.9% | 3.0% |
| Uzbekistan | 3.4% | 5.0% |
| Vanuatu | 2.2% | 3.4% |
| Venezuela | 1.5% | 1.5% |
| Vietnam | 6.0% | 7.2% |
| West Bank and Gaza | 4.0% | 3.5% |
| Yemen | 1.0% | 2.5% |
| Zambia | 3.1% | 3.6% |
| Zimbabwe | 3.5% | 3.0% |
Guyana, a country of less than 800,000 people in South America, is forecast to have the highest GDP growth of 47.2% in 2022 and 34.5% in 2023. The country has begun to rapidly develop its offshore oil industry, with oil earnings estimated to make up nearly 40% of its GDP.
In Asia, India is projected to see strong growth of 8.2% in 2022 and 6.9% in 2023. The growth is supported by government spending and economic reforms, such as lowering the corporate tax rate and allowing more foreign direct investment. In fact, foreign direct investment reached a record $84 billion in 2021-22.
Meanwhile, the IMF predicts that GDP growth in the U.S. will hit 3.7% in 2022 and 2.3% in 2023. The Russia-Ukraine war is expected to slow growth in America’s trading partners, reducing their demand for American goods. The central bank has also withdrawn U.S. monetary support faster than expected as rates rise to combat inflation. Even still, the IMF expects that the U.S. will reach its pre-pandemic trend output path by 2022.
Supporting Growth
Certainly, there are a number of risks facing the global economy. Countries with strong fiscal and monetary support, as well as countries with in-demand exports, have some of the best economic predictions for 2022 and beyond.
The IMF also offers countries various recommendations in order to support growth. For instance, central banks can offer clear interest rate guidance to minimize surprises that disrupt the markets. Governments can continue offering targeted fiscal support to vulnerable populations, such as refugees and households most impacted by the pandemic.
Over the longer-term, countries can focus on reskilling their workforce for the digital transformation, investing in renewables for the green transition, and improving the resiliency of global supply chains.


Markets in a Minute
The Top 5 Reasons Clients Fire a Financial Advisor
Firing an advisor is often driven by more than cost and performance factors. Here are the top reasons clients ‘break up’ with their advisors.

The Top 5 Reasons Clients Fire a Financial Advisor
What drives investors to fire a financial advisor?
From saving for a down payment to planning for retirement, clients turn to advisors to guide them through life’s complex financial decisions. However, many of the key reasons for firing a financial advisor stem from emotional factors, and go beyond purely financial motivations.
We partnered with Morningstar to show the top reasons clients fire an advisor to provide insight on what’s driving investor behavior.
What Drives Firing Decisions?
Here are the top reasons clients terminated their advisor, based on a survey of 184 respondents:
| Reason for Firing | % of Respondents Citing This Reason | Type of Motivation |
|---|---|---|
| Quality of financial advice and services | 32% | Emotion-based reason |
| Quality of relationship | 21% | Emotion-based reason |
| Cost of services | 17% | Financial-based reason |
| Return performance | 11% | Financial-based reason |
| Comfort handling financial issues on their own | 10% | Emotion-based reason |
Numbers may not total 100 due to rounding. Respondents could select more than one answer.
Numbers may not total 100 due to rounding. Respondents could select more than one answer.
While firing an advisor is rare, many of the primary drivers behind firing decisions are also emotionally driven.
Often, advisors were fired due to the quality of the relationship. In many cases, this was due to an advisor not dedicating enough time to fully grasp their personal financial goals. Additionally, wealthier, and more financially literate clients are more likely to fire their advisors—highlighting the importance of understanding the client.
Key Takeaways
Given these driving factors, here are five ways that advisors can build a lasting relationship through recognizing their clients’ emotional needs:
- Understand your clients’ deeper goals
- Reach out proactively
- Act as a financial coach
- Keep clients updated
- Conduct goal-setting exercises on a regular basis
By communicating their value and setting expectations early, advisors can help prevent setbacks in their practice by adeptly recognizing the emotional motivators of their clients.
Markets in a Minute
The Top 5 Reasons Clients Hire a Financial Advisor
Here are the most common drivers for hiring a financial advisor, revealing that investor motivations go beyond just financial factors.

The Top 5 Reasons Clients Hire a Financial Advisor
What drives investors to hire a financial advisor?
From saving for a down payment to planning for retirement, clients turn to advisors to guide them through life’s complex financial decisions. However, many of the key reasons for hiring a financial advisor stem from emotional factors, and go beyond purely financial motivations.
We partnered with Morningstar to show the top reasons clients hire a financial advisor to provide insight on what’s driving investor behavior.
What Drives Hiring Decisions?
Here are the most common reasons for hiring an advisor, based on a survey of 312 respondents.
| Reason for Hiring | % of Respondents Citing This Reason | Type of Motivation |
|---|---|---|
| Specific goals or needs | 32% | Financial-based reason |
| Discomfort handling finances | 32% | Emotion-based reason |
| Behavioral coaching | 17% | Emotion-based reason |
| Recommended by family or friends | 12% | Emotion-based reason |
| Quality of relationship | 10% | Emotion-based reason |
Numbers may not total 100 due to rounding. Respondents could select more than one answer.
While financial factors played an important role in hiring decisions, emotional reasons made up the largest share of total responses.
This illustrates that clients place a high degree of importance on reaching specific goals or needs, and how an advisor communicates with them. Furthermore, clients seek out advisors for behavioral coaching to help them make informed decisions while staying the course.
Key Takeaways
With this in mind, here are five ways advisors can provide value to their clients and grow their practice:
- Address clients’ emotional needs early on
- Demonstrate how you can offer support
- Use ordinary language
- Provide education to help clients stay on track
- Acknowledge that these are issues we all face
By addressing emotional factors, advisors can more effectively help clients’ navigate intricate financial decisions and avoid common behavioral mistakes.

The Top 5 Reasons Clients Fire a Financial Advisor

The Top 5 Reasons Clients Hire a Financial Advisor

Visualizing the Growth of $100, by Asset Class

How Small Investments Make a Big Impact Over Time

What Were the Top Performing Investment Themes of 2023?
-

 Infographics2 years ago
The Top Investment Quotes Every Investor Should Know
-

 Markets in a Minute2 years ago
Mapped: The Growth in U.S. House Prices by State
-

 Markets in a Minute2 years ago
How Closely Related Are Historical Mortgage Rates and Housing Prices?
-

 Infographics2 years ago
A Visual Guide to Stagflation, Inflation, and Deflation
-

 Markets in a Minute1 year ago
Mapped: Global Energy Prices, by Country in 2022
-

 Infographics3 years ago
The 5 Fastest Growing Industries of the Next Decade
-

 Markets in a Minute2 years ago
Visualizing Historical Oil Prices (1968-2022)
-

 Infographics1 year ago
Visual Guide: The Three Types of Economic Indicators
