
Markets in a Minute
The Effects of Quantitative Tightening: Less Liquidity, More Volatility
This infographic is available as a poster.
This infographic is available as a poster.
Quantitative Tightening: Less Liquidity, More Volatility
How are interest rate hikes and quantitative tightening affecting markets?
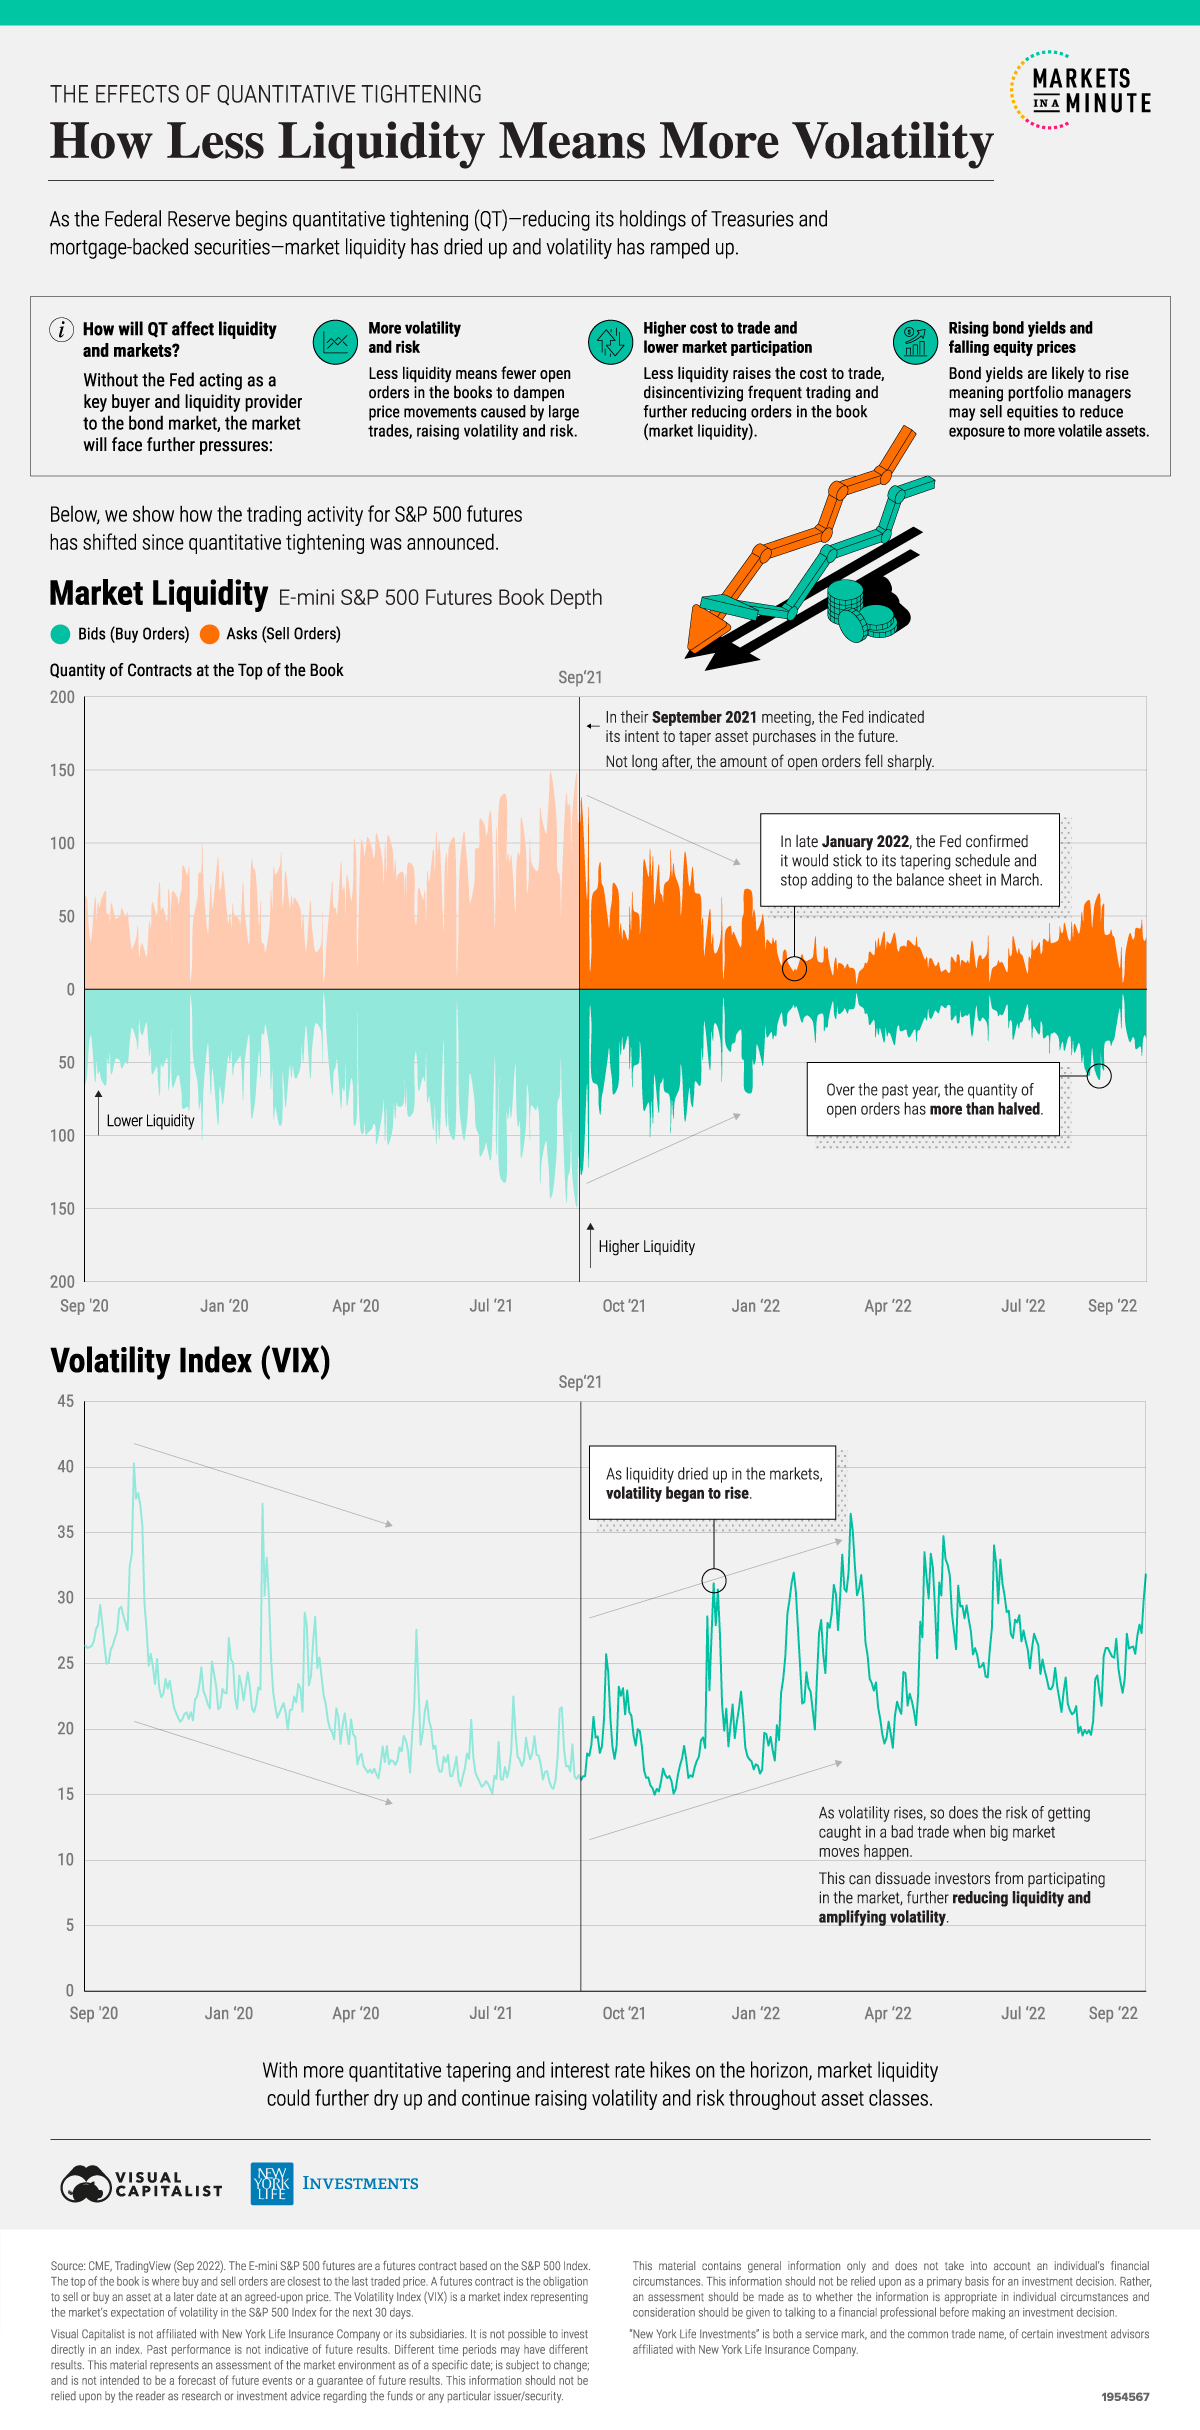
The Federal Reserve’s fast-paced rate hikes and initial reductions of its balance sheet have resulted in liquidity drying up across markets, amplifying volatility and uncertainty.
This Markets in a Minute from New York Life Investments explains how quantitative tightening affects markets, and charts the rise in volatility spurred by the severe decline in S&P 500 futures book depth.
What is Quantitative Tightening (QT)?
Quantitative tightening (QT) is the infamous twin to quantitative easing (QE). For context, quantitative easing is the injection of liquidity into bond markets by the Federal Reserve buying Treasuries and mortgage-backed securities which are added onto the Fed’s balance sheet.
As a result, during periods of quantitative easing, Treasuries and certain mortgage-backed securities have a large-scale buyer providing buy-side liquidity, reducing the impact of sellers in the market. This supports bond prices, and prevents bond yields from rising too quickly.
Quantitative tightening is a reduction of the assets on the Federal Reserve’s balance sheet. This means letting Treasuries mature and not rebuying them, or even selling them on the market. Opposite to quantitative easing, QT removes buy-side liquidity from the market and can result in bond prices falling and yields rising.
How Rate Hikes and Quantitative Tightening Affect Markets
Along with quantitative tightening’s reduction of liquidity from markets, interest rate hikes can also result in less market liquidity.
As interest rates rise, so do borrowing costs for capital. This results in less money being lent out and fewer deals being funded, higher mortgage and other loan rates, and tighter overall purse strings of market participants and everyday consumers. In this way, higher interest rates slow down market and economic activity.
The Fed’s pace of rate hikes in 2022 has been one of the fastest in history, with the Federal Funds rate starting the year at 0.0-0.25% and projected to end the year somewhere between 4.0-4.5%.
| Date | Change in Rates (bps) | Federal Funds Rate |
|---|---|---|
| March 2022 | +25 | 0.25-0.50% |
| May 2022 | +50 | 0.75-1.00% |
| June 2022 | +75 | 1.50-1.75% |
| July 2022 | +75 | 2.25-2.50% |
| September 2022 | +75 | 3.00-3.25% |
Source: Federal Reserve
As rates have continued to rise, the rate of quantitative tightening doubled in September to now let a maximum of $60 billion of Treasuries and $35 billion of mortgage-backed securities roll off its balance sheet without repurchase.
This acceleration in QT could see market liquidity dry up even more, further amplifying volatility.
How Low Liquidity and High Volatility Raise Risk
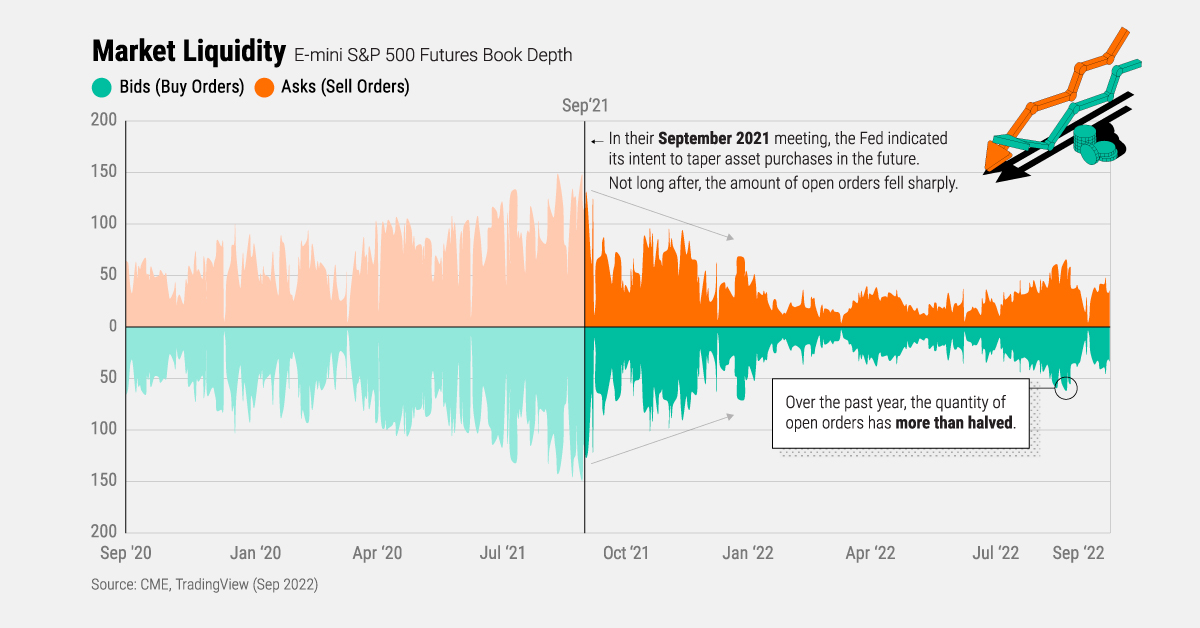
One of the clearest measures of liquidity is a market’s book depth. Book depth is the amount of available buy and sell orders in a market’s order book.
More orders stacked up on either side results in thicker book depth, or deeper liquidity for incoming buy and sell orders to tap into, while less orders on either side result in thinner book depth, especially at the top of the book.
The top of the book is where buy and sell orders are closest to the last traded price:
- $101 – Closest sell orders
- $100 – Current/last traded price
- $99 – Closest buy orders
In the example above, buy orders at $101 and sell orders at $99 are at the top of the order book since they are closest to the last traded price.
As liquidity tightens and book depth thins out, orders at the top of the book become smaller, meaning that prices can move around more easily as big trades come into the market to fill orders at the top of the book.
In this way, tighter liquidity and thinner book depth result in higher volatility, largely raising risk for market participants. This can turn into a self-reinforcing cycle, as investors sit out of the markets to avoid periods of high volatility, resulting in even less liquidity and higher volatility.
Looking Ahead
As book depth has thinned out significantly over the past year, volatility began to rise alongside the market’s uncertainty.
With more rate hikes incoming and the Fed’s QT operations continuing at a faster pace now, market participants may brace for even less liquidity in markets and the possibility for further volatility and heightened risk.


Markets in a Minute
The Top 5 Reasons Clients Fire a Financial Advisor
Firing an advisor is often driven by more than cost and performance factors. Here are the top reasons clients ‘break up’ with their advisors.

The Top 5 Reasons Clients Fire a Financial Advisor
What drives investors to fire a financial advisor?
From saving for a down payment to planning for retirement, clients turn to advisors to guide them through life’s complex financial decisions. However, many of the key reasons for firing a financial advisor stem from emotional factors, and go beyond purely financial motivations.
We partnered with Morningstar to show the top reasons clients fire an advisor to provide insight on what’s driving investor behavior.
What Drives Firing Decisions?
Here are the top reasons clients terminated their advisor, based on a survey of 184 respondents:
| Reason for Firing | % of Respondents Citing This Reason | Type of Motivation |
|---|---|---|
| Quality of financial advice and services | 32% | Emotion-based reason |
| Quality of relationship | 21% | Emotion-based reason |
| Cost of services | 17% | Financial-based reason |
| Return performance | 11% | Financial-based reason |
| Comfort handling financial issues on their own | 10% | Emotion-based reason |
Numbers may not total 100 due to rounding. Respondents could select more than one answer.
Numbers may not total 100 due to rounding. Respondents could select more than one answer.
While firing an advisor is rare, many of the primary drivers behind firing decisions are also emotionally driven.
Often, advisors were fired due to the quality of the relationship. In many cases, this was due to an advisor not dedicating enough time to fully grasp their personal financial goals. Additionally, wealthier, and more financially literate clients are more likely to fire their advisors—highlighting the importance of understanding the client.
Key Takeaways
Given these driving factors, here are five ways that advisors can build a lasting relationship through recognizing their clients’ emotional needs:
- Understand your clients’ deeper goals
- Reach out proactively
- Act as a financial coach
- Keep clients updated
- Conduct goal-setting exercises on a regular basis
By communicating their value and setting expectations early, advisors can help prevent setbacks in their practice by adeptly recognizing the emotional motivators of their clients.
Markets in a Minute
The Top 5 Reasons Clients Hire a Financial Advisor
Here are the most common drivers for hiring a financial advisor, revealing that investor motivations go beyond just financial factors.

The Top 5 Reasons Clients Hire a Financial Advisor
What drives investors to hire a financial advisor?
From saving for a down payment to planning for retirement, clients turn to advisors to guide them through life’s complex financial decisions. However, many of the key reasons for hiring a financial advisor stem from emotional factors, and go beyond purely financial motivations.
We partnered with Morningstar to show the top reasons clients hire a financial advisor to provide insight on what’s driving investor behavior.
What Drives Hiring Decisions?
Here are the most common reasons for hiring an advisor, based on a survey of 312 respondents.
| Reason for Hiring | % of Respondents Citing This Reason | Type of Motivation |
|---|---|---|
| Specific goals or needs | 32% | Financial-based reason |
| Discomfort handling finances | 32% | Emotion-based reason |
| Behavioral coaching | 17% | Emotion-based reason |
| Recommended by family or friends | 12% | Emotion-based reason |
| Quality of relationship | 10% | Emotion-based reason |
Numbers may not total 100 due to rounding. Respondents could select more than one answer.
While financial factors played an important role in hiring decisions, emotional reasons made up the largest share of total responses.
This illustrates that clients place a high degree of importance on reaching specific goals or needs, and how an advisor communicates with them. Furthermore, clients seek out advisors for behavioral coaching to help them make informed decisions while staying the course.
Key Takeaways
With this in mind, here are five ways advisors can provide value to their clients and grow their practice:
- Address clients’ emotional needs early on
- Demonstrate how you can offer support
- Use ordinary language
- Provide education to help clients stay on track
- Acknowledge that these are issues we all face
By addressing emotional factors, advisors can more effectively help clients’ navigate intricate financial decisions and avoid common behavioral mistakes.

The Top 5 Reasons Clients Fire a Financial Advisor

The Top 5 Reasons Clients Hire a Financial Advisor

Visualizing the Growth of $100, by Asset Class

How Small Investments Make a Big Impact Over Time

What Were the Top Performing Investment Themes of 2023?
-

 Infographics2 years ago
The Top Investment Quotes Every Investor Should Know
-

 Markets in a Minute2 years ago
Mapped: The Growth in U.S. House Prices by State
-

 Markets in a Minute2 years ago
How Closely Related Are Historical Mortgage Rates and Housing Prices?
-

 Infographics2 years ago
A Visual Guide to Stagflation, Inflation, and Deflation
-

 Markets in a Minute1 year ago
Mapped: Global Energy Prices, by Country in 2022
-

 Infographics3 years ago
The 5 Fastest Growing Industries of the Next Decade
-

 Markets in a Minute2 years ago
Visualizing Historical Oil Prices (1968-2022)
-

 Infographics1 year ago
Visual Guide: The Three Types of Economic Indicators
