
Markets in a Minute
Mapped: Unemployment Forecasts, by Country in 2023
Mapped: Unemployment Forecasts, by Country in 2023
As 2022 clearly illustrated, the global job market can surprise expectations.
So far, this year is no different. The unemployment rate in six of the G7 countries hovers near the lowest in a century. With an unemployment rate of 3.4%, the U.S. jobless rate hasn’t fallen this low since 1969.
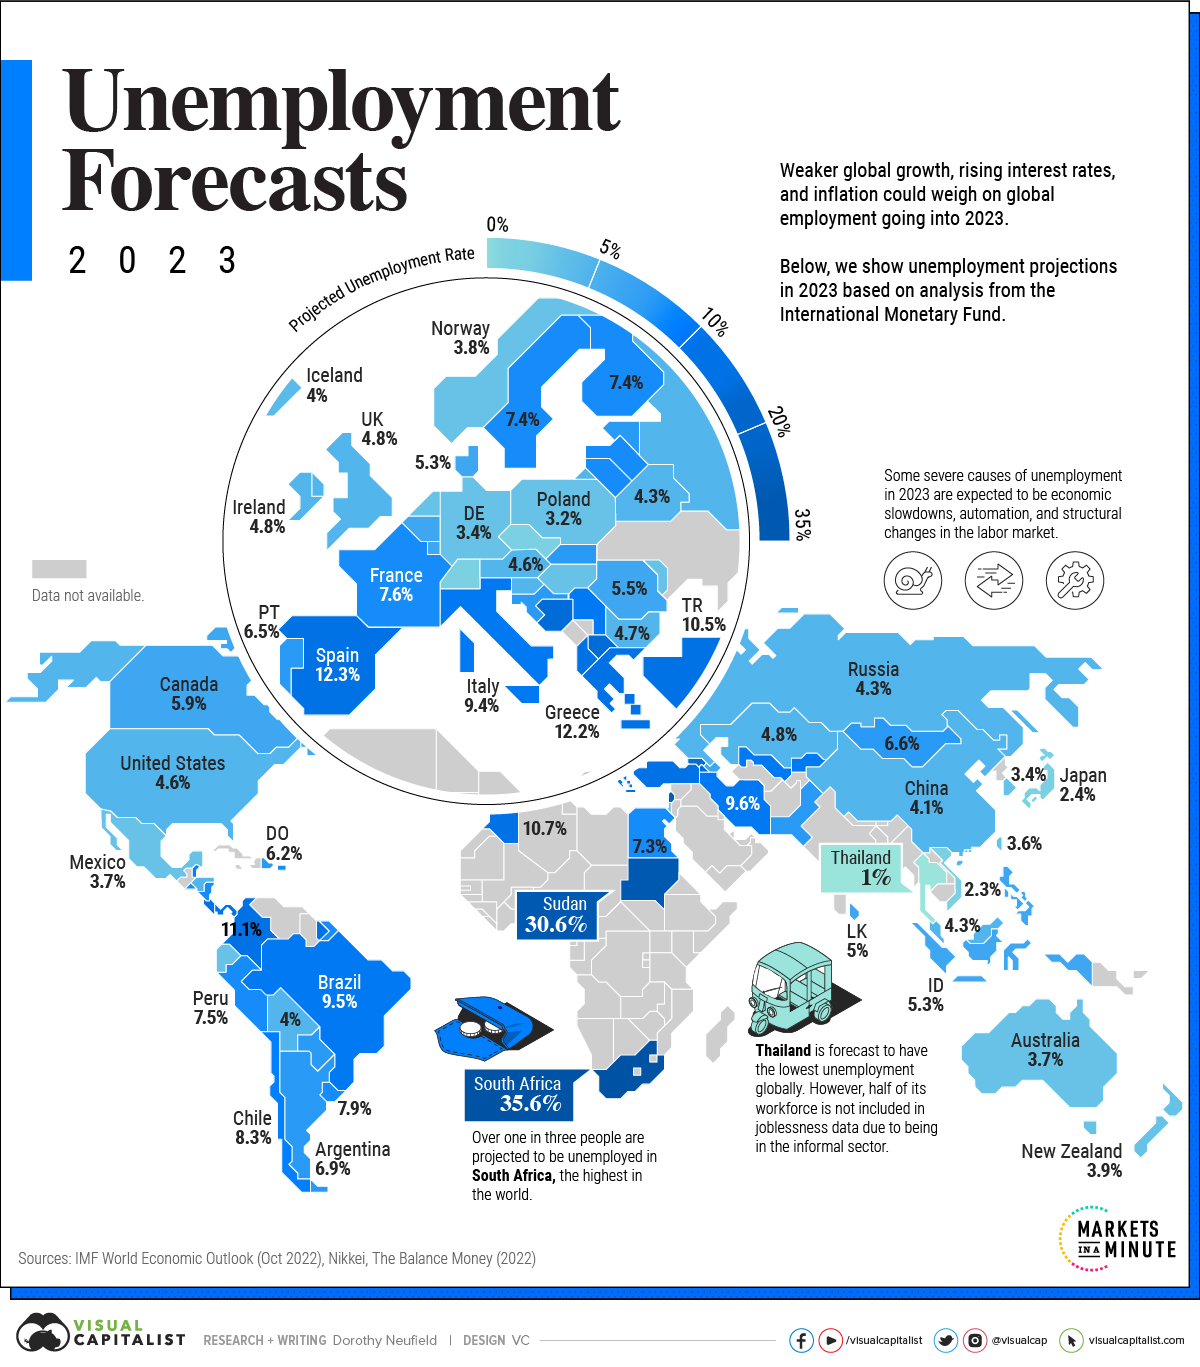
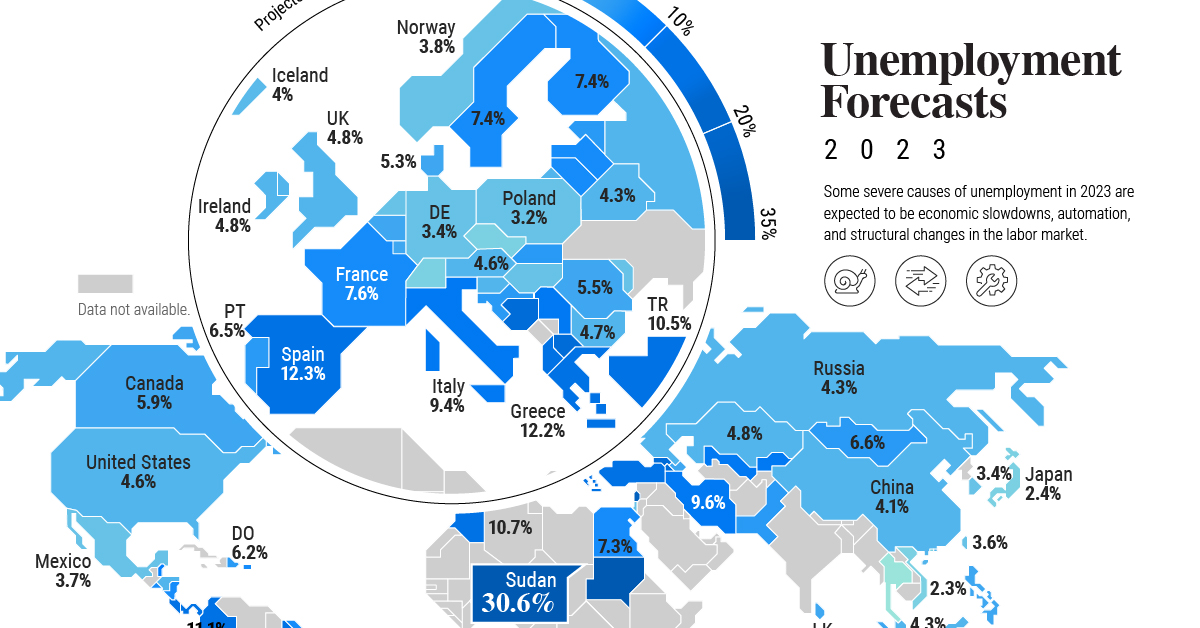
But as some economies navigate a strong labor market against high inflation and hawkish monetary policy, others are facing more challenging conditions. In the above graphic, we map unemployment forecasts in 2023 using data from the IMF’s World Economic Outlook.
Uncertainty Clouds the Surface
Across many countries, the pandemic has made entrenched labor trends worse. It has also altered job market conditions.
South Africa is projected to see the highest jobless rate globally. As the most industrialized nation on the continent, unemployment is estimated to hit 35.6% in 2023. Together, slow economic growth and stringent labor laws have prevented firms from hiring workers. Over the last two decades, unemployment has hovered around 20%.
| Country / Region | 2023 Unemployment Rate (Projected) |
|---|---|
| 🇿🇦 South Africa | 35.6% |
| 🇸🇩 Sudan | 30.6% |
| 🇵🇸 West Bank and Gaza | 25.0% |
| 🇬🇪 Georgia | 19.5% |
| 🇧🇦 Bosnia and Herzegovina | 17.2% |
| 🇦🇲 Armenia | 15.1% |
| 🇲🇰 North Macedonia | 15.0% |
| 🇨🇷 Costa Rica | 13.2% |
| 🇧🇸 The Bahamas | 12.7% |
| 🇪🇸 Spain | 12.3% |
| 🇬🇷 Greece | 12.2% |
| 🇨🇴 Colombia | 11.1% |
| 🇲🇦 Morocco | 10.7% |
| 🇸🇷 Suriname | 10.6% |
| 🇹🇷 Turkiye | 10.5% |
| 🇧🇧 Barbados | 10.0% |
| 🇦🇱 Albania | 10.0% |
| 🇵🇦 Panama | 10.0% |
| 🇷🇸 Serbia | 9.7% |
| 🇮🇷 Iran | 9.6% |
| 🇺🇿 Uzbekistan | 9.5% |
| 🇧🇷 Brazil | 9.5% |
| 🇮🇹 Italy | 9.4% |
| 🇰🇬 Kyrgyz Republic | 9.0% |
| 🇨🇻 Cabo Verde | 8.5% |
| 🇨🇱 Chile | 8.3% |
| 🇧🇿 Belize | 8.0% |
| 🇵🇷 Puerto Rico | 7.9% |
| 🇺🇾 Uruguay | 7.9% |
| 🇦🇼 Aruba | 7.7% |
| 🇫🇷 France | 7.6% |
| 🇵🇪 Peru | 7.5% |
| 🇸🇻 El Salvador | 7.5% |
| 🇸🇪 Sweden | 7.4% |
| 🇫🇮 Finland | 7.4% |
| 🇲🇺 Mauritius | 7.4% |
| 🇪🇬 Egypt | 7.3% |
| 🇱🇻 Latvia | 7.2% |
| 🇳🇮 Nicaragua | 7.2% |
| 🇱🇹 Lithuania | 7.0% |
| 🇦🇷 Argentina | 6.9% |
| 🇪🇪 Estonia | 6.8% |
| 🇧🇳 Brunei Darussalam | 6.8% |
| 🇲🇳 Mongolia | 6.6% |
| 🇭🇷 Croatia | 6.6% |
| 🇨🇾 Cyprus | 6.5% |
| 🇵🇹 Portugal | 6.5% |
| 🇵🇰 Pakistan | 6.4% |
| 🇵🇾 Paraguay | 6.4% |
| 🇸🇰 Slovak Republic | 6.2% |
| 🇩🇴 Dominican Republic | 6.2% |
| 🇨🇦 Canada | 5.9% |
| 🇦🇿 Azerbaijan | 5.8% |
| 🇸🇲 San Marino | 5.7% |
| 🇧🇪 Belgium | 5.6% |
| 🇷🇴 Romania | 5.5% |
| 🇫🇯 Fiji | 5.5% |
| 🇵🇭 Philippines | 5.4% |
| 🇮🇩 Indonesia | 5.3% |
| 🇩🇰 Denmark | 5.3% |
| 🇱🇰 Sri Lanka | 5.0% |
| 🇱🇺 Luxembourg | 5.0% |
| 🇮🇪 Ireland | 4.8% |
| 🇰🇿 Kazakhstan | 4.8% |
| 🇬🇧 United Kingdom | 4.8% |
| 🇧🇬 Bulgaria | 4.7% |
| 🇦🇹 Austria | 4.6% |
| 🇭🇳 Honduras | 4.6% |
| 🇺🇸 U.S. | 4.6% |
| 🇧🇭 Bahrain | 4.4% |
| 🇷🇺 Russia | 4.3% |
| 🇧🇾 Belarus | 4.3% |
| 🇸🇮 Slovenia | 4.3% |
| 🇲🇾 Malaysia | 4.3% |
| 🇨🇳 China | 4.1% |
| 🇮🇸 Iceland | 4.0% |
| 🇧🇴 Bolivia | 4.0% |
| 🇭🇰 Hong Kong SAR | 4.0% |
| 🇳🇱 Netherlands | 3.9% |
| 🇳🇿 New Zealand | 3.9% |
| 🇭🇺 Hungary | 3.8% |
| 🇳🇴 Norway | 3.8% |
| 🇮🇱 Israel | 3.8% |
| 🇪🇨 Ecuador | 3.8% |
| 🇦🇺 Australia | 3.7% |
| 🇲🇽 Mexico | 3.7% |
| 🇹🇼 Taiwan | 3.6% |
| 🇲🇩 Moldova | 3.5% |
| 🇰🇷 South Korea | 3.4% |
| 🇩🇪 Germany | 3.4% |
| 🇲🇹 Malta | 3.3% |
| 🇵🇱 Poland | 3.2% |
| 🇸🇨 Seychelles | 3.0% |
| 🇲🇴 Macao SAR | 2.7% |
| 🇯🇵 Japan | 2.4% |
| 🇨🇭 Switzerland | 2.4% |
| 🇻🇳 Vietnam | 2.3% |
| 🇨🇿 Czech Republic | 2.3% |
| 🇸🇬 Singapore | 2.1% |
| 🇹🇭 Thailand | 1.0% |
In Europe, Bosnia and Herzegovina is estimated to see the highest unemployment rate, at over 17%. It is followed by North Macedonia (15.0%) and Spain (12.7%). These jobless rates are more than double the projections for advanced economies in Europe.
The U.S. is forecast to see an unemployment rate of 4.6%, or 1.2% higher than current levels.
This suggests that today’s labor market strength will ease as U.S. economic indicators weaken. One marker is the Conference Board’s Leading Economic Index, which fell for its tenth straight month in December. Lower manufacturing orders, declining consumer expectations, and shorter work weeks are among the indicators it tracks.
Like the U.S., many advanced countries are witnessing labor market strength, especially in the United Kingdom, Asia, and Europe, although how long it will last is unknown.
A Closer Look at U.S. Numbers
Unlike some declining economic indicators mentioned above, the job market is one of the strongest areas of the global economy. Even as the tech sector reports mass layoffs, unemployment claims in the U.S. fall below recent averages. (It’s worth noting the tech sector makes up just 4% of the workforce).
In 2022, 4.8 million jobs were added, more than double the average seen between 2015-2019. Of course, the pandemic recovery has impacted these figures.
Some analysts suggest that despite a bleaker economic outlook, companies are hesitant to conduct layoffs. At the same time, the labor market is absorbing workers who have lost employment.
Consider the manufacturing sector. Even as the January ISM Purchasing Managers Index posted lower readings, hitting 47.4—a level of 48.7 and below generally indicates a recession—factories are not laying off many workers. Instead, manufacturers are saying they are confident conditions will improve in the second half of the year.
Containing Aftershocks
Today, strong labor markets pose a key challenge for central bankers globally.
This is because the robust job market is contributing to high inflation numbers. Yet despite recent rate increases, the impact has yet to prompt major waves in unemployment. Typically, monetary policy moves like these takes about a year to take peak effect. To combat inflation, monetary policy has been shown to take over three or even four years.
The good news is that inflation can potentially be tamed by other means. Fixing supply-side dynamics, such as preventing supply shortages and improving transportation systems and infrastructure could cool inflation.
As investors closely watch economic data, rising unemployment could come on the heels of higher interest rates, but so far this has yet to unravel.


Markets in a Minute
The Top 5 Reasons Clients Fire a Financial Advisor
Firing an advisor is often driven by more than cost and performance factors. Here are the top reasons clients ‘break up’ with their advisors.

The Top 5 Reasons Clients Fire a Financial Advisor
What drives investors to fire a financial advisor?
From saving for a down payment to planning for retirement, clients turn to advisors to guide them through life’s complex financial decisions. However, many of the key reasons for firing a financial advisor stem from emotional factors, and go beyond purely financial motivations.
We partnered with Morningstar to show the top reasons clients fire an advisor to provide insight on what’s driving investor behavior.
What Drives Firing Decisions?
Here are the top reasons clients terminated their advisor, based on a survey of 184 respondents:
| Reason for Firing | % of Respondents Citing This Reason | Type of Motivation |
|---|---|---|
| Quality of financial advice and services | 32% | Emotion-based reason |
| Quality of relationship | 21% | Emotion-based reason |
| Cost of services | 17% | Financial-based reason |
| Return performance | 11% | Financial-based reason |
| Comfort handling financial issues on their own | 10% | Emotion-based reason |
Numbers may not total 100 due to rounding. Respondents could select more than one answer.
Numbers may not total 100 due to rounding. Respondents could select more than one answer.
While firing an advisor is rare, many of the primary drivers behind firing decisions are also emotionally driven.
Often, advisors were fired due to the quality of the relationship. In many cases, this was due to an advisor not dedicating enough time to fully grasp their personal financial goals. Additionally, wealthier, and more financially literate clients are more likely to fire their advisors—highlighting the importance of understanding the client.
Key Takeaways
Given these driving factors, here are five ways that advisors can build a lasting relationship through recognizing their clients’ emotional needs:
- Understand your clients’ deeper goals
- Reach out proactively
- Act as a financial coach
- Keep clients updated
- Conduct goal-setting exercises on a regular basis
By communicating their value and setting expectations early, advisors can help prevent setbacks in their practice by adeptly recognizing the emotional motivators of their clients.
Markets in a Minute
The Top 5 Reasons Clients Hire a Financial Advisor
Here are the most common drivers for hiring a financial advisor, revealing that investor motivations go beyond just financial factors.

The Top 5 Reasons Clients Hire a Financial Advisor
What drives investors to hire a financial advisor?
From saving for a down payment to planning for retirement, clients turn to advisors to guide them through life’s complex financial decisions. However, many of the key reasons for hiring a financial advisor stem from emotional factors, and go beyond purely financial motivations.
We partnered with Morningstar to show the top reasons clients hire a financial advisor to provide insight on what’s driving investor behavior.
What Drives Hiring Decisions?
Here are the most common reasons for hiring an advisor, based on a survey of 312 respondents.
| Reason for Hiring | % of Respondents Citing This Reason | Type of Motivation |
|---|---|---|
| Specific goals or needs | 32% | Financial-based reason |
| Discomfort handling finances | 32% | Emotion-based reason |
| Behavioral coaching | 17% | Emotion-based reason |
| Recommended by family or friends | 12% | Emotion-based reason |
| Quality of relationship | 10% | Emotion-based reason |
Numbers may not total 100 due to rounding. Respondents could select more than one answer.
While financial factors played an important role in hiring decisions, emotional reasons made up the largest share of total responses.
This illustrates that clients place a high degree of importance on reaching specific goals or needs, and how an advisor communicates with them. Furthermore, clients seek out advisors for behavioral coaching to help them make informed decisions while staying the course.
Key Takeaways
With this in mind, here are five ways advisors can provide value to their clients and grow their practice:
- Address clients’ emotional needs early on
- Demonstrate how you can offer support
- Use ordinary language
- Provide education to help clients stay on track
- Acknowledge that these are issues we all face
By addressing emotional factors, advisors can more effectively help clients’ navigate intricate financial decisions and avoid common behavioral mistakes.

The Top 5 Reasons Clients Fire a Financial Advisor

The Top 5 Reasons Clients Hire a Financial Advisor

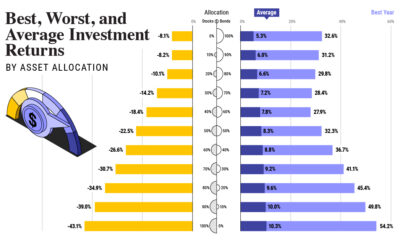
Visualizing the Growth of $100, by Asset Class

How Small Investments Make a Big Impact Over Time

What Were the Top Performing Investment Themes of 2023?
-

 Infographics2 years ago
The Top Investment Quotes Every Investor Should Know
-

 Markets in a Minute2 years ago
Mapped: The Growth in U.S. House Prices by State
-

 Markets in a Minute2 years ago
How Closely Related Are Historical Mortgage Rates and Housing Prices?
-

 Infographics2 years ago
A Visual Guide to Stagflation, Inflation, and Deflation
-

 Markets in a Minute1 year ago
Mapped: Global Energy Prices, by Country in 2022
-

 Markets in a Minute2 years ago
Visualizing Historical Oil Prices (1968-2022)
-

 Infographics1 year ago
Visual Guide: The Three Types of Economic Indicators
-

 Markets in a Minute2 years ago
Mapped: Global Macroeconomic Risk, by Country in 2022
