
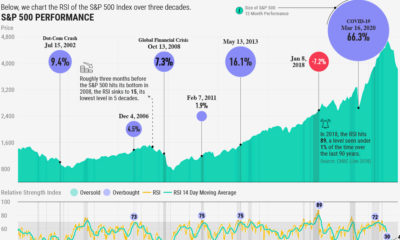

When is the S&P 500 Index considered overbought or oversold? The relative strength index may offer some answers to identifying market trends.
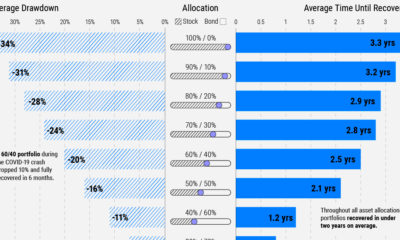

How have bonds historically performed during a bear market? How have different stock and bond allocations performed?


On average, U.S. house prices grew by 18.7% from Q1 2021 to Q1 2022. How has price growth differed by state over various timeframes?

What are the different types of inflation? Which economic forces impact each type? Below, we chart each over modern history.
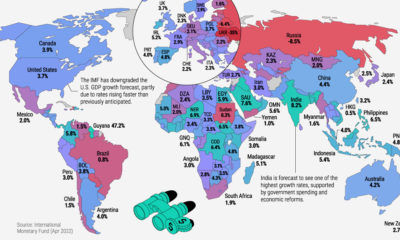

Global GDP growth is forecast to drop from 6.1% in 2021 to 3.6% in 2022. This map shows economic predictions for 2022 and beyond by country.
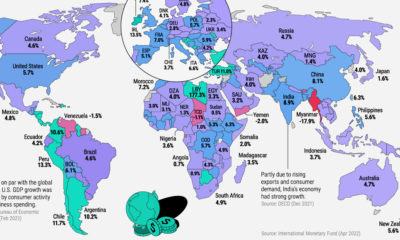

The world economy expanded by 6.1% in 2021. This map shows GDP growth by country amid the COVID-19 recovery.


The real price of oil reached a seven year high amid the Russia-Ukraine war. How have other major events impacted historical oil prices?
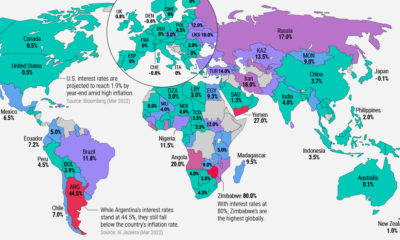

For the vast majority of countries, interest rates are marching upward. Here’s how they break down in 2022.
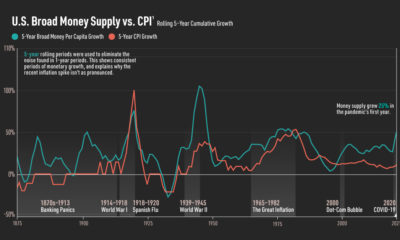

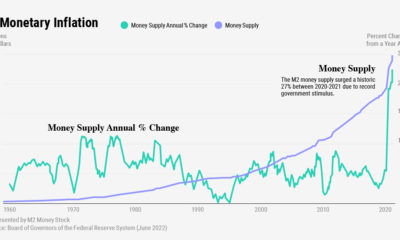
The money supply has surged in recent years. Here is a chart that shows money supply and inflation since 1875.
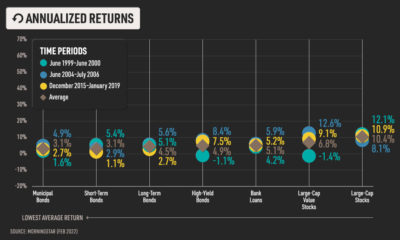

Which asset classes outperformed during the last three periods of interest rate hikes? We look at historical risk and return in this chart.
