
Markets in a Minute
Identifying Trends With the Relative Strength Index
This infographic is available as a poster.
This infographic is available as a poster.
Identifying Market Trends: The Relative Strength Index
What happens when the S&P 500 Index enters oversold territory? Does the market reverse, or continue on this trend?
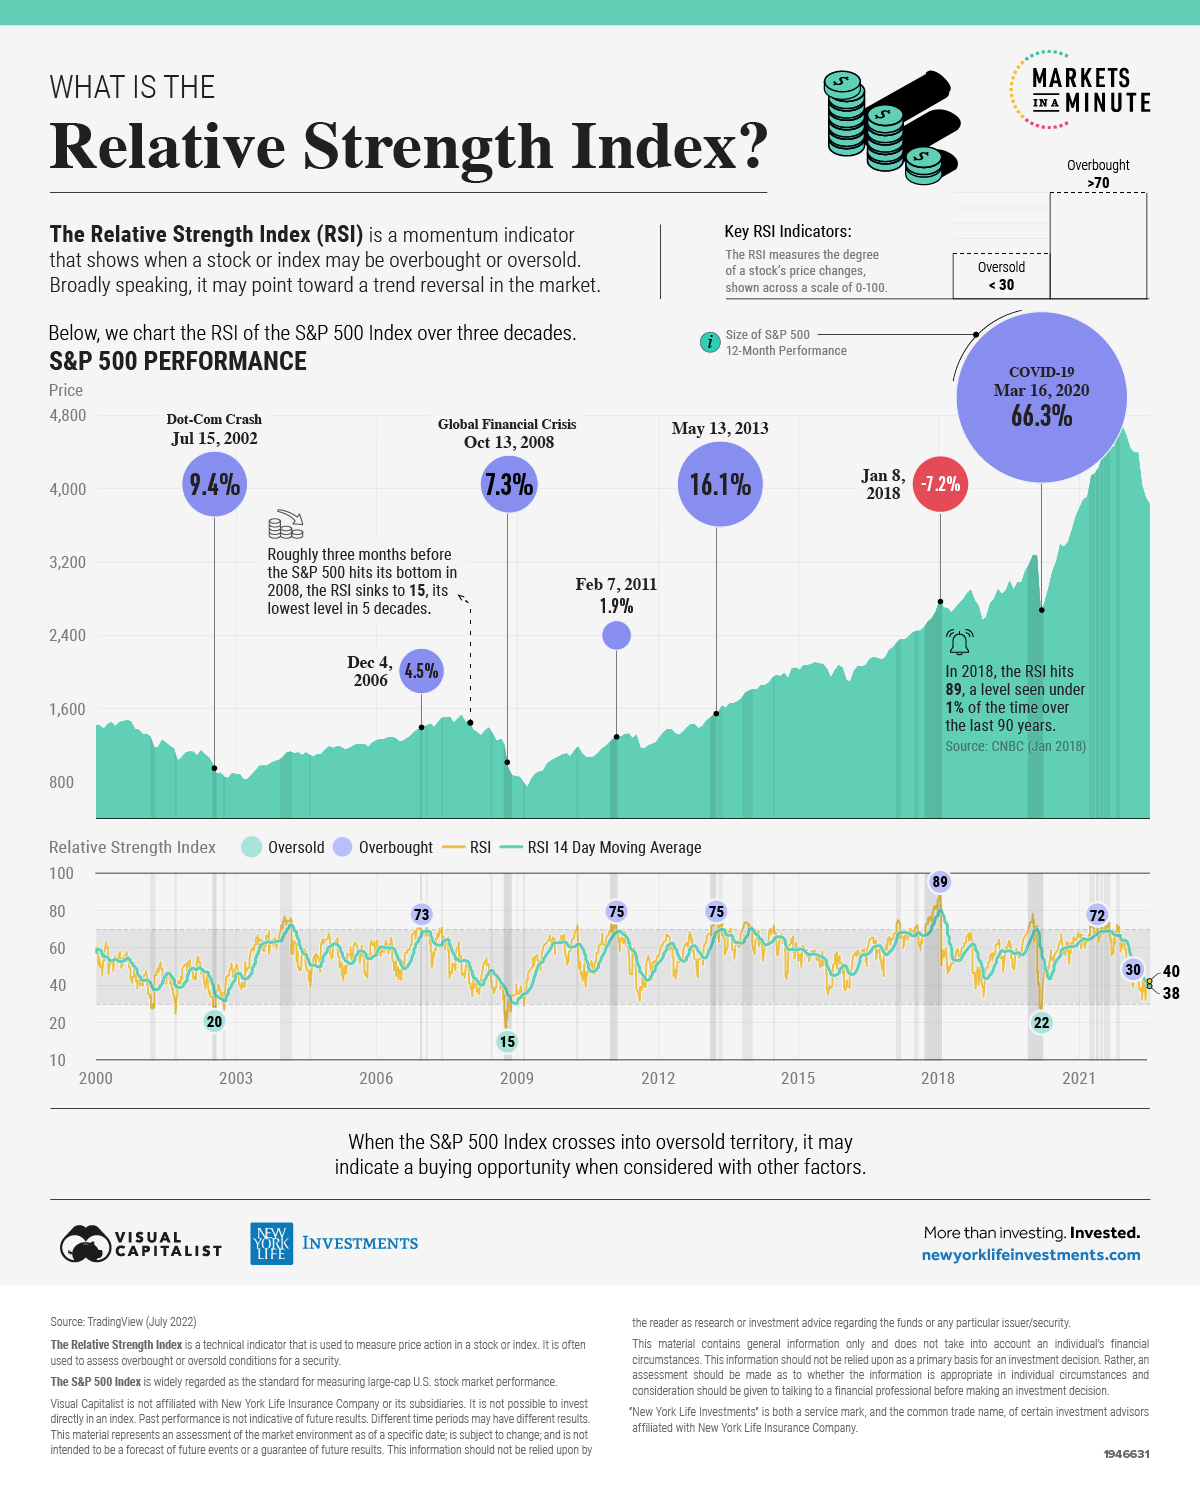
A widely-used momentum indicator, the relative strength index (RSI) may offer some insight. The RSI is an indicator that may show when a stock or index is overbought or oversold during a specific period of time, indicating a potential buying opportunity.
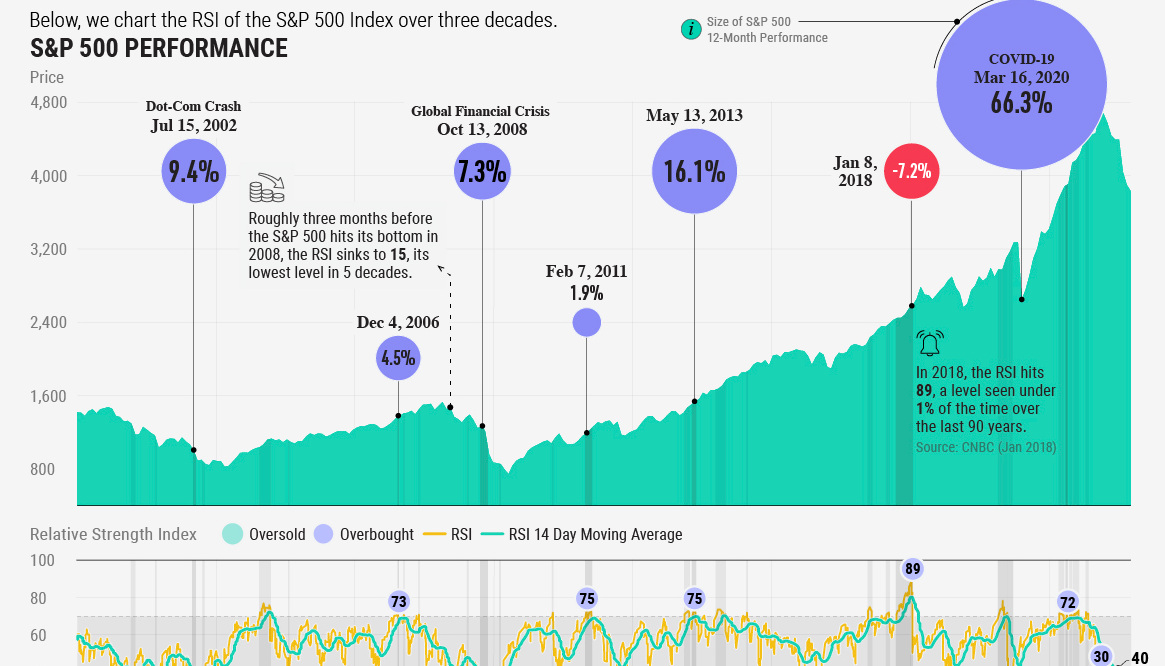
This Markets in a Minute from New York Life Investments looks at the RSI of the S&P 500 Index over the last three decades to show how the market performed after different periods of overbought or oversold conditions
What is the Relative Strength Index?
The RSI measures the scale of price movements of a stock or index. In short, the RSI is used to calculate the average gains of a stock divided by the average losses over a certain time period. These are then tracked across a scale of 0 to 100. Broadly speaking, a stock is considered overbought if it reads 70 or above and it is considered oversold if it is 30 or below.
For example, when the S&P 500 Index has a RSI of 85, an investor may consider it overbought and sell their shares. Conversely, if the RSI hits 25, an investor may buy the S&P 500 thinking the market will bounce back.
The RSI is often used with other indicators to identify market trends.
The Relative Strength Index and S&P 500 Returns
Below, we show the 12-month returns of the S&P 500 Index after key ‘overbought’ or ‘oversold’ conditions in the market as indicated by the RSI:
| Date | RSI | Shiller PE Ratio* | S&P 500 Index 12-Month Return |
|---|---|---|---|
| Jul 15 2002 | 20 | 23 | 9.4% |
| Dec 4 2006 | 73 | 27 | 4.5% |
| Oct 13 2008 | 15 | 16 | 7.3% |
| Feb 7 2011 | 75 | 23 | 1.9% |
| May 13 2013 | 75 | 23 | 16.1% |
| Jan 8 2018 | 89 | 33 | -7.2% |
| Mar 16 2020 | 22 | 25 | 66.3% |
| May 3 2021 | 72 | 37 | 0.0% |
*Measured by the average inflation-adjusted earnings of the S&P over 10 years
As the above table shows, following each period of extremely oversold territory in the RSI, the S&P 500 Index had positive returns.
In fact, the S&P 500 Index had the strongest one-year returns following the COVID-19 crisis of March 2020, with over 66% 12-month returns. During the time of extreme fear, the RSI sank to deeply oversold territory before sharply rebounding.
Interestingly, following periods of extremely overbought conditions in the market there was a range of positive and negative performance. Most recently, before the peak of the last cycle in 2021, the S&P 500 Index spent roughly 9 months in ‘overbought’ territory before declining into 2022.
The Relative Strength Index in 2022
With the economy in uncertain territory, how does the RSI look today?
In early June, following a bleak consumer sentiment announcement, the RSI fell to 30, hovering on oversold territory. Since then, it has risen closer to 40 as consumer sentiment and perspectives on economic conditions have slightly improved.
However, whether or not the RSI will continue on this uptrend remains to be seen.
For the remainder of 2022, market sentiment, which may be shaped by the coming GDP and inflation figures, could push RSI into oversold territory once again. As a bright spot this may be good news—reinforcing a turning point in the market.


Markets in a Minute
The Top 5 Reasons Clients Fire a Financial Advisor
Firing an advisor is often driven by more than cost and performance factors. Here are the top reasons clients ‘break up’ with their advisors.

The Top 5 Reasons Clients Fire a Financial Advisor
What drives investors to fire a financial advisor?
From saving for a down payment to planning for retirement, clients turn to advisors to guide them through life’s complex financial decisions. However, many of the key reasons for firing a financial advisor stem from emotional factors, and go beyond purely financial motivations.
We partnered with Morningstar to show the top reasons clients fire an advisor to provide insight on what’s driving investor behavior.
What Drives Firing Decisions?
Here are the top reasons clients terminated their advisor, based on a survey of 184 respondents:
| Reason for Firing | % of Respondents Citing This Reason | Type of Motivation |
|---|---|---|
| Quality of financial advice and services | 32% | Emotion-based reason |
| Quality of relationship | 21% | Emotion-based reason |
| Cost of services | 17% | Financial-based reason |
| Return performance | 11% | Financial-based reason |
| Comfort handling financial issues on their own | 10% | Emotion-based reason |
Numbers may not total 100 due to rounding. Respondents could select more than one answer.
Numbers may not total 100 due to rounding. Respondents could select more than one answer.
While firing an advisor is rare, many of the primary drivers behind firing decisions are also emotionally driven.
Often, advisors were fired due to the quality of the relationship. In many cases, this was due to an advisor not dedicating enough time to fully grasp their personal financial goals. Additionally, wealthier, and more financially literate clients are more likely to fire their advisors—highlighting the importance of understanding the client.
Key Takeaways
Given these driving factors, here are five ways that advisors can build a lasting relationship through recognizing their clients’ emotional needs:
- Understand your clients’ deeper goals
- Reach out proactively
- Act as a financial coach
- Keep clients updated
- Conduct goal-setting exercises on a regular basis
By communicating their value and setting expectations early, advisors can help prevent setbacks in their practice by adeptly recognizing the emotional motivators of their clients.
Markets in a Minute
The Top 5 Reasons Clients Hire a Financial Advisor
Here are the most common drivers for hiring a financial advisor, revealing that investor motivations go beyond just financial factors.

The Top 5 Reasons Clients Hire a Financial Advisor
What drives investors to hire a financial advisor?
From saving for a down payment to planning for retirement, clients turn to advisors to guide them through life’s complex financial decisions. However, many of the key reasons for hiring a financial advisor stem from emotional factors, and go beyond purely financial motivations.
We partnered with Morningstar to show the top reasons clients hire a financial advisor to provide insight on what’s driving investor behavior.
What Drives Hiring Decisions?
Here are the most common reasons for hiring an advisor, based on a survey of 312 respondents.
| Reason for Hiring | % of Respondents Citing This Reason | Type of Motivation |
|---|---|---|
| Specific goals or needs | 32% | Financial-based reason |
| Discomfort handling finances | 32% | Emotion-based reason |
| Behavioral coaching | 17% | Emotion-based reason |
| Recommended by family or friends | 12% | Emotion-based reason |
| Quality of relationship | 10% | Emotion-based reason |
Numbers may not total 100 due to rounding. Respondents could select more than one answer.
While financial factors played an important role in hiring decisions, emotional reasons made up the largest share of total responses.
This illustrates that clients place a high degree of importance on reaching specific goals or needs, and how an advisor communicates with them. Furthermore, clients seek out advisors for behavioral coaching to help them make informed decisions while staying the course.
Key Takeaways
With this in mind, here are five ways advisors can provide value to their clients and grow their practice:
- Address clients’ emotional needs early on
- Demonstrate how you can offer support
- Use ordinary language
- Provide education to help clients stay on track
- Acknowledge that these are issues we all face
By addressing emotional factors, advisors can more effectively help clients’ navigate intricate financial decisions and avoid common behavioral mistakes.

The Top 5 Reasons Clients Fire a Financial Advisor

The Top 5 Reasons Clients Hire a Financial Advisor

Visualizing the Growth of $100, by Asset Class

How Small Investments Make a Big Impact Over Time

What Were the Top Performing Investment Themes of 2023?
-

 Infographics2 years ago
The Top Investment Quotes Every Investor Should Know
-

 Markets in a Minute2 years ago
Mapped: The Growth in U.S. House Prices by State
-

 Markets in a Minute2 years ago
How Closely Related Are Historical Mortgage Rates and Housing Prices?
-

 Infographics2 years ago
A Visual Guide to Stagflation, Inflation, and Deflation
-

 Markets in a Minute1 year ago
Mapped: Global Energy Prices, by Country in 2022
-

 Markets in a Minute2 years ago
Visualizing Historical Oil Prices (1968-2022)
-

 Infographics1 year ago
Visual Guide: The Three Types of Economic Indicators
-

 Markets in a Minute2 years ago
Mapped: Global Macroeconomic Risk, by Country in 2022
