
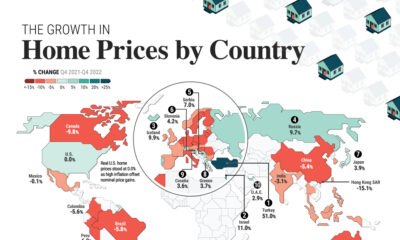

Global house prices were resilient in 2022, rising 6%. We compare nominal and real price growth by country as interest rates surged.
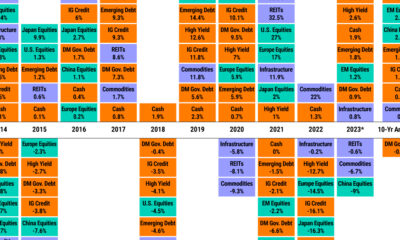

Asset classes vary widely by returns so far in 2023. Which ones are the best-performing, and is a bull market on the horizon?
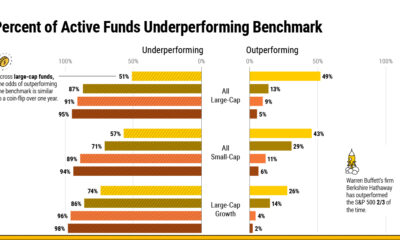

For actively managed funds, the odds of beating the market over the long run are like finding a needle in a haystack.
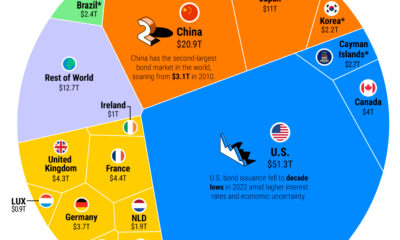

The global bond market stands at $133 trillion in value. Here are the major players in bond markets worldwide.
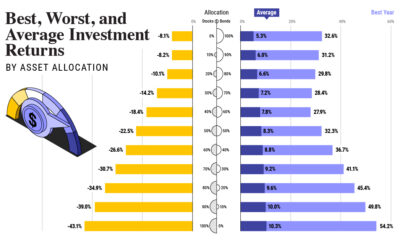

How have investment returns for different portfolio allocations of stocks and bonds compared over the last 90 years?
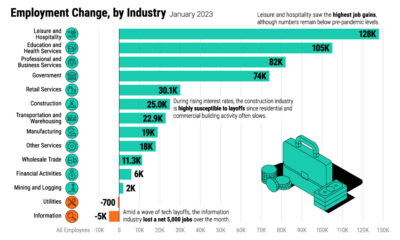

The U.S. labor market is remarkably strong, with a 3.4% unemployment rate. Which sectors are seeing the highest job gains in 2023?
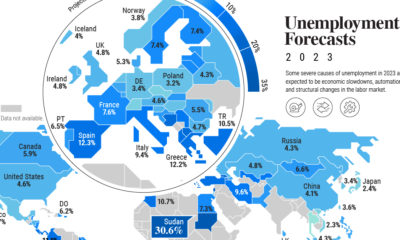

Unemployment is forecast to tick higher in 2023, but so far red-hot labor markets are resisting this trend on a global scale.
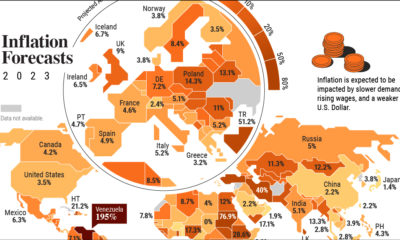

Inflation surged on a global scale in 2022, hitting record-level highs in many countries. Could it finally subside in 2023?
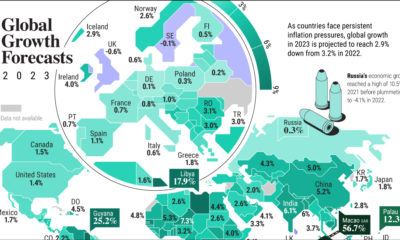

The global economy faces an uncertain future in 2023. This year, GDP growth is projected to be 2.9%—down from 3.2% in 2022.
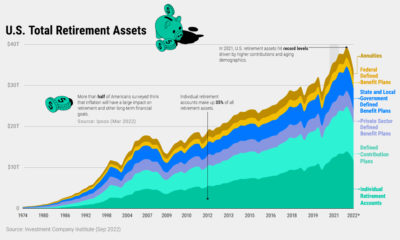

U.S. retirement assets have faced challenging conditions amid market headwinds—but over the last decade these assets have nearly doubled.
