
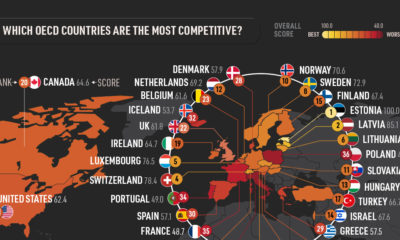

Low taxes encourage investment, while high taxes can drive dollars elsewhere. Which OECD countries have the best international tax competitiveness?
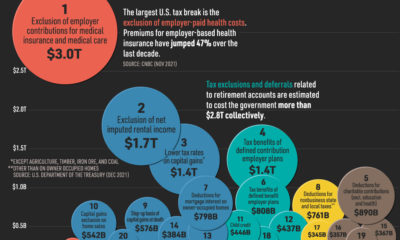

Which tax expenditures, or tax breaks, will lead to the biggest government revenue losses over the next ten years?
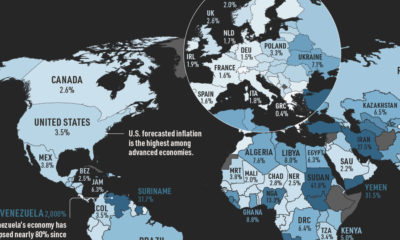

Where is inflation heading in 2022? In this graphic, we show inflation by country using IMF projections of average consumer prices.
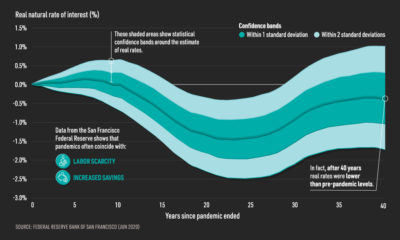

While rate hikes are imminent in the short term, historical data shows that real interest rates tend to decline after pandemics for nearly 40 years.
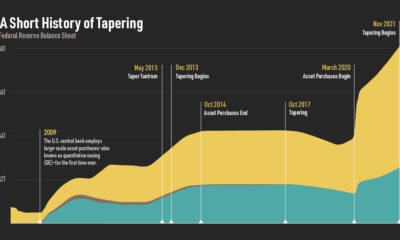

Broadly speaking, Fed tapering is the reversal of quantitative easing. We show the history of Federal Reserve bond tapering and how it works.
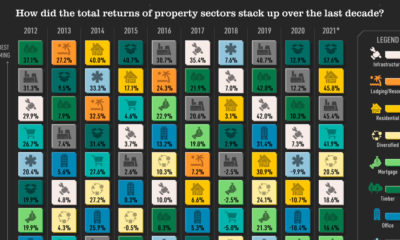

From residential to retail, are there patterns in real estate return on investment? We rank them by sector over the last decade to find out.
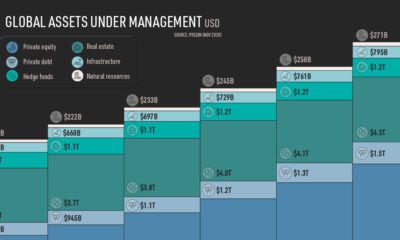

Alternative assets — assets beyond stocks and bonds — are projected to grow by 62% from 2020-2025. Here’s which ones may grow the fastest.
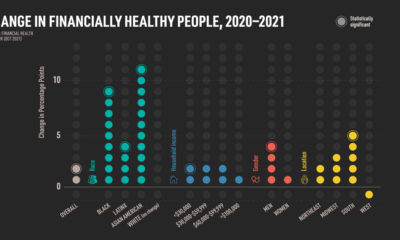

The economic recovery has not been even. We show the increase in Americans' financial health by race, income, gender, and location.
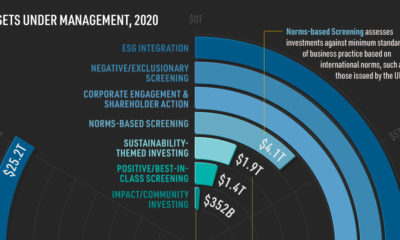

We show the assets under management of various sustainable investing strategies to see which ones are the most and least popular.
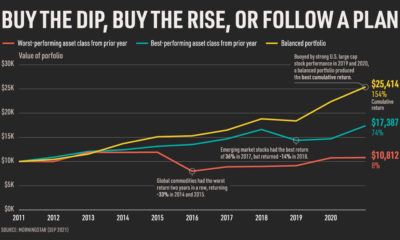

Investors may want to buy the dip when values drop or buy the rise when values climb. We compare these strategies with simply following a plan.
