
Markets in a Minute
Mapped: GDP Growth by Country in 2021


This infographic is available as a poster.
This infographic is available as a poster.
A Recap of GDP Growth by Country in 2021
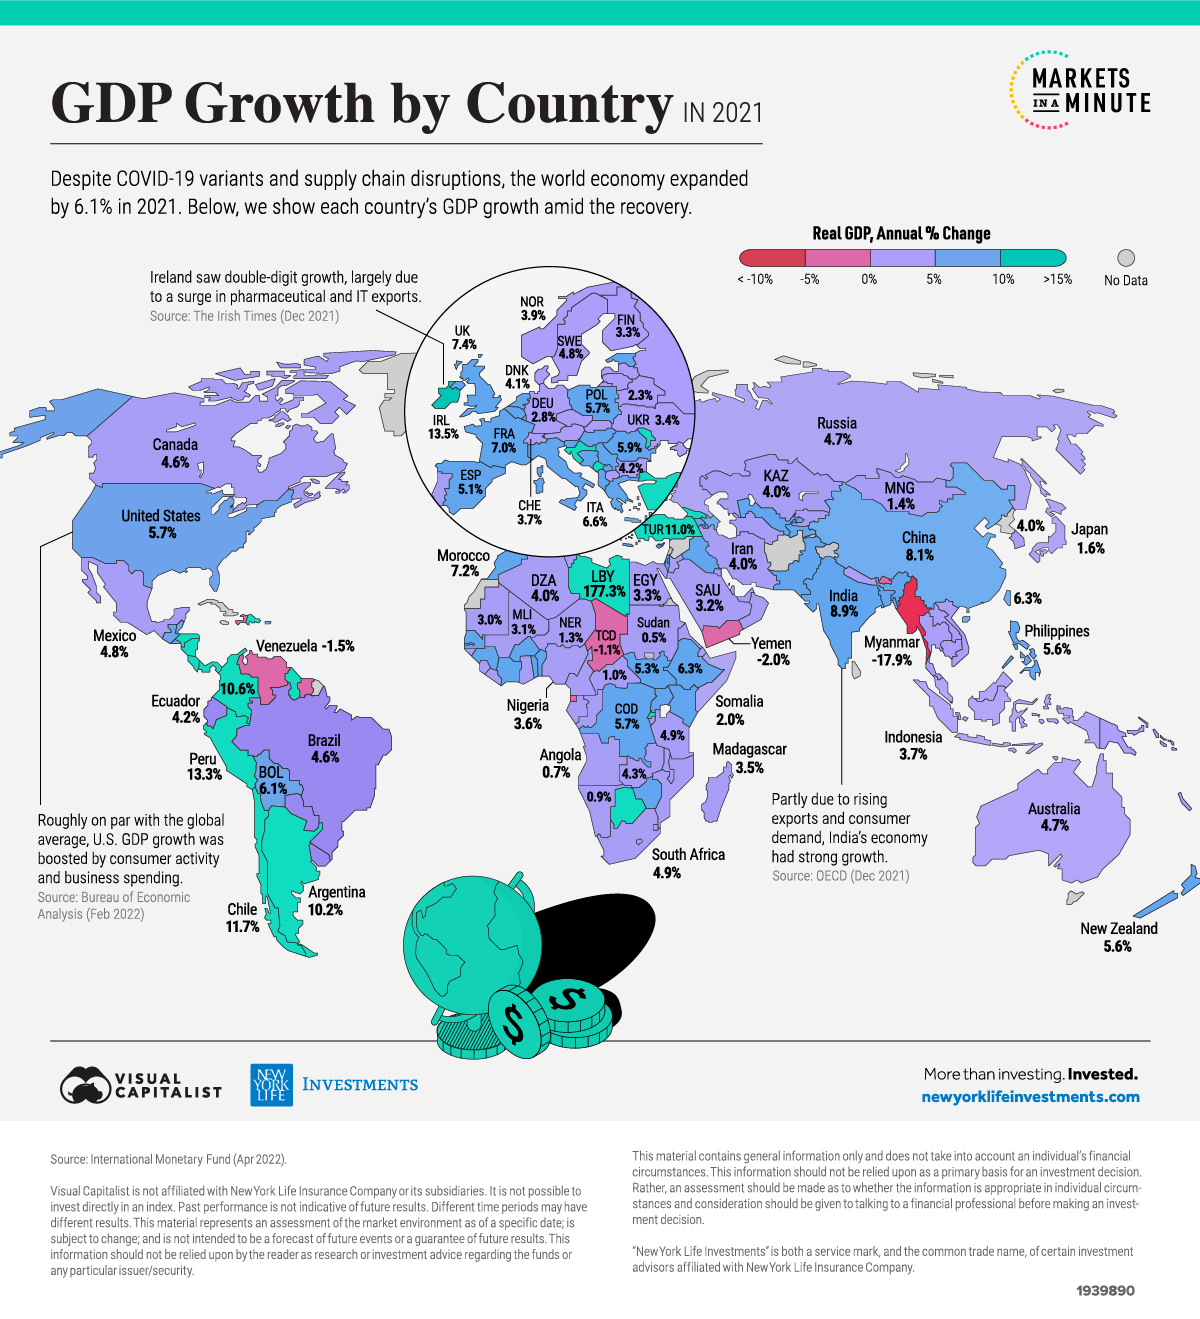
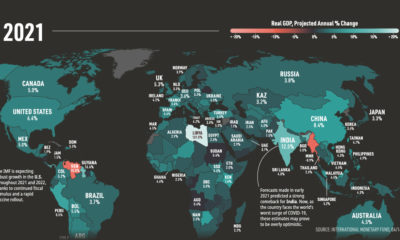
The global economy faced numerous challenges in 2021. While COVID-19 vaccinations became more widely available in some countries, variants led to further waves in the pandemic. While consumer demand began to recover, supply chain disruptions restricted supply.
Despite these and other hurdles, the world economy expanded by 6.1% in 2021. In this Markets in a Minute from New York Life Investments, we explore GDP growth by country to see which countries had the best and worst growth. It’s the first in a two-part series that explores GDP growth around the world.
What is the Base Effect?
Before diving into the data, it’s worth highlighting that 2021’s GDP growth numbers are impacted by the base effect. Whenever growth is shown over a time period, it is being compared to a “base” or starting value. If the base value is abnormally high or low, it can distort the growth figures.
In this case, the year-over-year growth is comparing growth from 2020 to 2021. Since the COVID-19 pandemic caused 2020 GDP growth to be negative in many countries, 2021 GDP growth is measured from a lower starting point. This can make percentage growth appear higher, though in many cases economies were simply recovering from the pandemic slump.
GDP Growth by Country
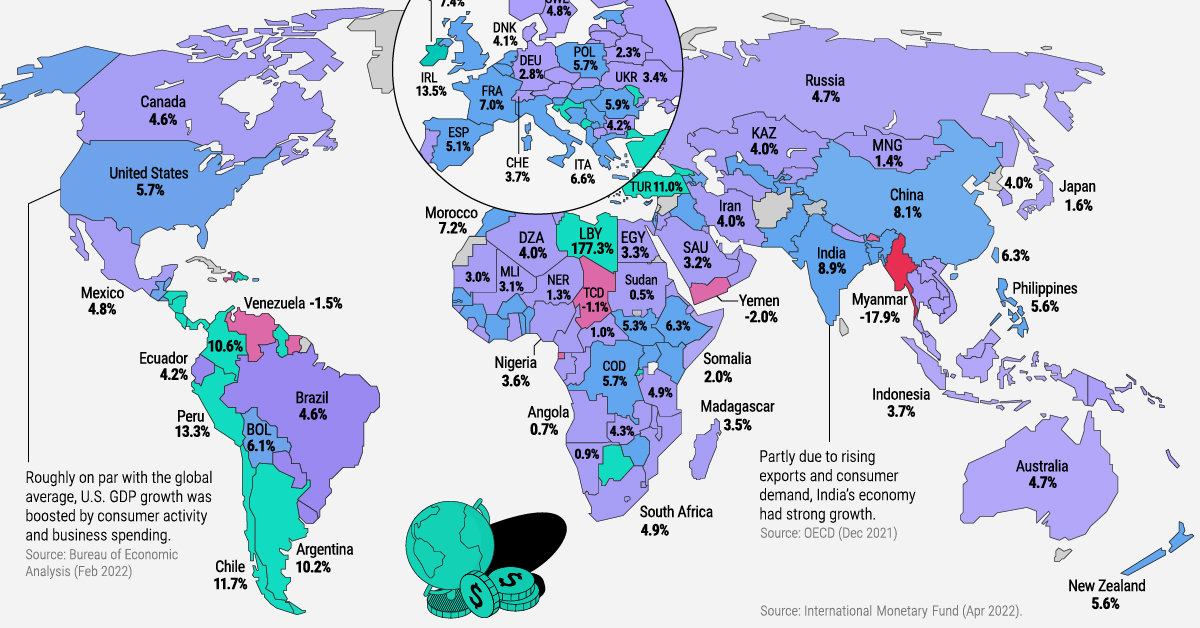
With this in mind, the table below shows real GDP growth by country in 2021, along with a comparison against 2020’s numbers.
Libya experienced the highest growth rate of 177.3%. The country moved toward ending its decade-long conflict, which resulted in a rebound of oil production and economic activity. Rising oil prices have also contributed to the country’s recovery, given the oil and gas sector accounts for 60% of Libya’s GDP. However, caution should be taken with this figure as there is considerable uncertainty against the backdrop of the civil war.
| Country | 2020 | 2021 |
|---|---|---|
| Afghanistan | -2.4% | n/a |
| Albania | -3.5% | 8.5% |
| Algeria | -4.9% | 4.0% |
| Andorra | -11.2% | 8.9% |
| Angola | -5.6% | 0.7% |
| Antigua and Barbuda | -20.2% | 4.8% |
| Argentina | -9.9% | 10.2% |
| Armenia | -7.4% | 5.7% |
| Aruba | -22.3% | 16.8% |
| Australia | -2.2% | 4.7% |
| Austria | -6.7% | 4.5% |
| Azerbaijan | -4.3% | 5.6% |
| Bahrain | -4.9% | 2.2% |
| Bangladesh | 3.5% | 5.0% |
| Barbados | -13.7% | 1.4% |
| Belarus | -0.7% | 2.3% |
| Belgium | -5.7% | 6.3% |
| Belize | -16.7% | 9.8% |
| Benin | 3.8% | 6.6% |
| Bhutan | -2.4% | -3.7% |
| Bolivia | -8.7% | 6.1% |
| Bosnia and Herzegovina | -3.1% | 5.8% |
| Botswana | -8.7% | 12.5% |
| Brazil | -3.9% | 4.6% |
| Brunei Darussalam | 1.1% | -0.7% |
| Bulgaria | -4.4% | 4.2% |
| Burkina Faso | 1.9% | 6.9% |
| Burundi | 0.3% | 2.4% |
| Cabo Verde | -14.8% | 6.9% |
| Cambodia | -3.1% | 2.2% |
| Cameroon | 0.5% | 3.5% |
| Canada | -5.2% | 4.6% |
| Central African Republic | 1.0% | 1.0% |
| Chad | -2.2% | -1.1% |
| Chile | -6.1% | 11.7% |
| China | 2.2% | 8.1% |
| Colombia | -7.0% | 10.6% |
| Comoros | -0.3% | 2.2% |
| Costa Rica | -4.1% | 7.6% |
| Côte d'Ivoire | 2.0% | 6.5% |
| Croatia | -8.1% | 10.4% |
| Cyprus | -5.0% | 5.5% |
| Czech Republic | -5.8% | 3.3% |
| Democratic Republic of the Congo | 1.7% | 5.7% |
| Denmark | -2.1% | 4.1% |
| Djibouti | 1.0% | 4.0% |
| Dominica | -11.0% | 3.7% |
| Dominican Republic | -6.7% | 12.3% |
| Ecuador | -7.8% | 4.2% |
| Egypt | 3.6% | 3.3% |
| El Salvador | -7.9% | 10.3% |
| Equatorial Guinea | -4.9% | -3.5% |
| Eritrea | -0.6% | 2.9% |
| Estonia | -3.0% | 8.3% |
| Eswatini | -1.9% | 3.1% |
| Ethiopia | 6.1% | 6.3% |
| Fiji | -15.2% | -4.0% |
| Finland | -2.3% | 3.3% |
| France | -8.0% | 7.0% |
| Gabon | -1.9% | 0.9% |
| Georgia | -6.8% | 10.4% |
| Germany | -4.6% | 2.8% |
| Ghana | 0.4% | 4.2% |
| Greece | -9.0% | 8.3% |
| Grenada | -13.8% | 5.6% |
| Guatemala | -1.5% | 8.0% |
| Guinea | 6.4% | 4.2% |
| Guinea-Bissau | 1.5% | 3.8% |
| Guyana | 43.5% | 19.9% |
| Haiti | -3.3% | -1.8% |
| Honduras | -9.0% | 12.5% |
| Hong Kong SAR | -6.5% | 6.4% |
| Hungary | -4.7% | 7.1% |
| Iceland | -7.1% | 4.3% |
| India | -6.6% | 8.9% |
| Indonesia | -2.1% | 3.7% |
| Iraq | -15.7% | 5.9% |
| Ireland | 5.9% | 13.5% |
| Islamic Republic of Iran | 1.8% | 4.0% |
| Israel | -2.2% | 8.2% |
| Italy | -9.0% | 6.6% |
| Jamaica | -10.0% | 4.4% |
| Japan | -4.5% | 1.6% |
| Jordan | -1.6% | 2.0% |
| Kazakhstan | -2.6% | 4.0% |
| Kenya | -0.3% | 7.2% |
| Kiribati | -0.5% | 1.5% |
| Korea | -0.9% | 4.0% |
| Kosovo | -5.3% | 9.5% |
| Kuwait | -8.9% | 1.3% |
| Kyrgyz Republic | -8.6% | 3.7% |
| Lao P.D.R. | -0.4% | 2.1% |
| Latvia | -3.8% | 4.7% |
| Lebanon | -22.0% | n/a |
| Lesotho | -6.0% | 2.1% |
| Liberia | -3.0% | 4.2% |
| Libya | -59.7% | 177.3% |
| Lithuania | -0.1% | 4.9% |
| Luxembourg | -1.8% | 6.9% |
| Macao SAR | -54.0% | 18.0% |
| Madagascar | -7.1% | 3.5% |
| Malawi | 0.9% | 2.2% |
| Malaysia | -5.6% | 3.1% |
| Maldives | -33.5% | 33.4% |
| Mali | -1.2% | 3.1% |
| Malta | -8.3% | 9.4% |
| Marshall Islands | -2.4% | -1.5% |
| Mauritania | -1.8% | 3.0% |
| Mauritius | -14.9% | 3.9% |
| Mexico | -8.2% | 4.8% |
| Micronesia | -1.8% | -3.2% |
| Moldova | -8.3% | 13.9% |
| Mongolia | -4.6% | 1.4% |
| Montenegro | -15.3% | 12.4% |
| Morocco | -6.3% | 7.2% |
| Mozambique | -1.2% | 2.2% |
| Myanmar | 3.2% | -17.9% |
| Namibia | -8.5% | 0.9% |
| Nauru | 0.7% | 1.6% |
| Nepal | -2.1% | 2.7% |
| Netherlands | -3.8% | 5.0% |
| New Zealand | -2.1% | 5.6% |
| Nicaragua | -2.0% | 10.3% |
| Niger | 3.6% | 1.3% |
| Nigeria | -1.8% | 3.6% |
| North Macedonia | -6.1% | 4.0% |
| Norway | -0.7% | 3.9% |
| Oman | -2.8% | 2.0% |
| Pakistan | -1.0% | 5.6% |
| Palau | -9.7% | -17.1% |
| Panama | -17.9% | 15.3% |
| Papua New Guinea | -3.5% | 1.7% |
| Paraguay | -0.8% | 4.2% |
| Peru | -11.0% | 13.3% |
| Philippines | -9.6% | 5.6% |
| Poland | -2.5% | 5.7% |
| Portugal | -8.4% | 4.9% |
| Puerto Rico | -3.9% | 1.0% |
| Qatar | -3.6% | 1.5% |
| Republic of Congo | -8.1% | -0.2% |
| Romania | -3.7% | 5.9% |
| Russia | -2.7% | 4.7% |
| Rwanda | -3.4% | 10.2% |
| Samoa | -2.6% | -8.1% |
| San Marino | -6.6% | 5.2% |
| São Tomé and Príncipe | 3.0% | 1.8% |
| Saudi Arabia | -4.1% | 3.2% |
| Senegal | 1.3% | 6.1% |
| Serbia | -0.9% | 7.4% |
| Seychelles | -7.7% | 8.0% |
| Sierra Leone | -2.0% | 3.2% |
| Singapore | -4.1% | 7.6% |
| Slovak Republic | -4.4% | 3.0% |
| Slovenia | -4.2% | 8.1% |
| Solomon Islands | -4.3% | -0.2% |
| Somalia | -0.3% | 2.0% |
| South Africa | -6.4% | 4.9% |
| South Sudan | -6.6% | 5.3% |
| Spain | -10.8% | 5.1% |
| Sri Lanka | -3.6% | 3.6% |
| St. Kitts and Nevis | -14.0% | -3.6% |
| St. Lucia | -20.4% | 6.8% |
| St. Vincent and the Grenadines | -5.3% | -0.5% |
| Sudan | -3.6% | 0.5% |
| Suriname | -15.9% | -3.5% |
| Sweden | -2.9% | 4.8% |
| Switzerland | -2.5% | 3.7% |
| Syria | n/a | n/a |
| Taiwan Province of China | 3.4% | 6.3% |
| Tajikistan | 4.4% | 9.2% |
| Tanzania | 4.8% | 4.9% |
| Thailand | -6.2% | 1.6% |
| The Bahamas | -14.5% | 5.6% |
| The Gambia | -0.2% | 5.6% |
| Timor-Leste | -8.6% | 1.8% |
| Togo | 1.8% | 5.1% |
| Tonga | 0.7% | -0.7% |
| Trinidad and Tobago | -7.4% | -1.0% |
| Tunisia | -9.3% | 3.1% |
| Turkey | 1.8% | 11.0% |
| Turkmenistan | -3.0% | 4.9% |
| Tuvalu | 1.0% | 2.5% |
| Uganda | -1.4% | 5.1% |
| Ukraine | -3.8% | 3.4% |
| United Arab Emirates | -6.1% | 2.3% |
| United Kingdom | -9.3% | 7.4% |
| United States | -3.4% | 5.7% |
| Uruguay | -6.1% | 4.4% |
| Uzbekistan | 1.9% | 7.4% |
| Vanuatu | -5.4% | 0.5% |
| Venezuela | -30.0% | -1.5% |
| Vietnam | 2.9% | 2.6% |
| West Bank and Gaza | -11.3% | 6.0% |
| Yemen | -8.5% | -2.0% |
| Zambia | -2.8% | 4.3% |
| Zimbabwe | -5.3% | 6.3% |
Ireland experienced GDP growth of 13.5% in 2021, driven largely by record-high exports. The country is home to more than 1,500 multinationals, including some of the top tech and pharma companies, due to Ireland’s competitive tax rate. The size of some of these multinationals can result in bloated GDP figures.
In South America, Chile had one of the highest GDP growth rates of 11.7%. The economic recovery was driven by one of the fastest COVID-19 vaccine rollouts in the world, which allowed the economy to almost fully reopen. Household consumption also rose thanks to fiscal support from the government and people withdrawing money from their pensions.
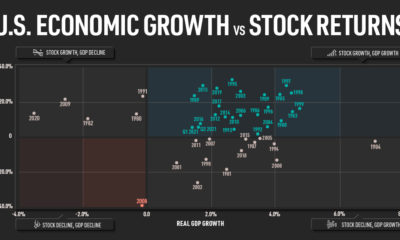
Meanwhile U.S. economic growth was roughly on par with the global average at 5.7%. The reasons for growth were widespread, including an increase in consumer spending, business investment, exports, and new single family home construction.
Looking Ahead
Recovering from the pandemic shutdown, almost all countries saw positive GDP growth in 2021. Some of the strongest growth was seen in countries with fully reopened economies, in-demand exports, and strong fiscal and monetary support.
Now, the world faces a new host of issues including worsening inflation and the Russia-Ukraine war. Which countries are projected to fare the best amid these challenges?
In the second part of this series, we’ll dive into predictions for GDP growth by country in 2022 and beyond.


Markets in a Minute
The Top 5 Reasons Clients Fire a Financial Advisor
Firing an advisor is often driven by more than cost and performance factors. Here are the top reasons clients ‘break up’ with their advisors.

The Top 5 Reasons Clients Fire a Financial Advisor
What drives investors to fire a financial advisor?
From saving for a down payment to planning for retirement, clients turn to advisors to guide them through life’s complex financial decisions. However, many of the key reasons for firing a financial advisor stem from emotional factors, and go beyond purely financial motivations.
We partnered with Morningstar to show the top reasons clients fire an advisor to provide insight on what’s driving investor behavior.
What Drives Firing Decisions?
Here are the top reasons clients terminated their advisor, based on a survey of 184 respondents:
| Reason for Firing | % of Respondents Citing This Reason | Type of Motivation |
|---|---|---|
| Quality of financial advice and services | 32% | Emotion-based reason |
| Quality of relationship | 21% | Emotion-based reason |
| Cost of services | 17% | Financial-based reason |
| Return performance | 11% | Financial-based reason |
| Comfort handling financial issues on their own | 10% | Emotion-based reason |
Numbers may not total 100 due to rounding. Respondents could select more than one answer.
Numbers may not total 100 due to rounding. Respondents could select more than one answer.
While firing an advisor is rare, many of the primary drivers behind firing decisions are also emotionally driven.
Often, advisors were fired due to the quality of the relationship. In many cases, this was due to an advisor not dedicating enough time to fully grasp their personal financial goals. Additionally, wealthier, and more financially literate clients are more likely to fire their advisors—highlighting the importance of understanding the client.
Key Takeaways
Given these driving factors, here are five ways that advisors can build a lasting relationship through recognizing their clients’ emotional needs:
- Understand your clients’ deeper goals
- Reach out proactively
- Act as a financial coach
- Keep clients updated
- Conduct goal-setting exercises on a regular basis
By communicating their value and setting expectations early, advisors can help prevent setbacks in their practice by adeptly recognizing the emotional motivators of their clients.
Markets in a Minute
The Top 5 Reasons Clients Hire a Financial Advisor
Here are the most common drivers for hiring a financial advisor, revealing that investor motivations go beyond just financial factors.

The Top 5 Reasons Clients Hire a Financial Advisor
What drives investors to hire a financial advisor?
From saving for a down payment to planning for retirement, clients turn to advisors to guide them through life’s complex financial decisions. However, many of the key reasons for hiring a financial advisor stem from emotional factors, and go beyond purely financial motivations.
We partnered with Morningstar to show the top reasons clients hire a financial advisor to provide insight on what’s driving investor behavior.
What Drives Hiring Decisions?
Here are the most common reasons for hiring an advisor, based on a survey of 312 respondents.
| Reason for Hiring | % of Respondents Citing This Reason | Type of Motivation |
|---|---|---|
| Specific goals or needs | 32% | Financial-based reason |
| Discomfort handling finances | 32% | Emotion-based reason |
| Behavioral coaching | 17% | Emotion-based reason |
| Recommended by family or friends | 12% | Emotion-based reason |
| Quality of relationship | 10% | Emotion-based reason |
Numbers may not total 100 due to rounding. Respondents could select more than one answer.
While financial factors played an important role in hiring decisions, emotional reasons made up the largest share of total responses.
This illustrates that clients place a high degree of importance on reaching specific goals or needs, and how an advisor communicates with them. Furthermore, clients seek out advisors for behavioral coaching to help them make informed decisions while staying the course.
Key Takeaways
With this in mind, here are five ways advisors can provide value to their clients and grow their practice:
- Address clients’ emotional needs early on
- Demonstrate how you can offer support
- Use ordinary language
- Provide education to help clients stay on track
- Acknowledge that these are issues we all face
By addressing emotional factors, advisors can more effectively help clients’ navigate intricate financial decisions and avoid common behavioral mistakes.

The Top 5 Reasons Clients Fire a Financial Advisor

The Top 5 Reasons Clients Hire a Financial Advisor

Visualizing the Growth of $100, by Asset Class

How Small Investments Make a Big Impact Over Time

What Were the Top Performing Investment Themes of 2023?
-

 Infographics2 years ago
The Top Investment Quotes Every Investor Should Know
-

 Markets in a Minute2 years ago
Mapped: The Growth in U.S. House Prices by State
-

 Markets in a Minute2 years ago
How Closely Related Are Historical Mortgage Rates and Housing Prices?
-

 Infographics2 years ago
A Visual Guide to Stagflation, Inflation, and Deflation
-

 Markets in a Minute1 year ago
Mapped: Global Energy Prices, by Country in 2022
-

 Infographics3 years ago
The 5 Fastest Growing Industries of the Next Decade
-

 Markets in a Minute2 years ago
Visualizing Historical Oil Prices (1968-2022)
-

 Infographics1 year ago
Visual Guide: The Three Types of Economic Indicators
