
Markets in a Minute
Mapped: The Largest Stock Exchanges in the World
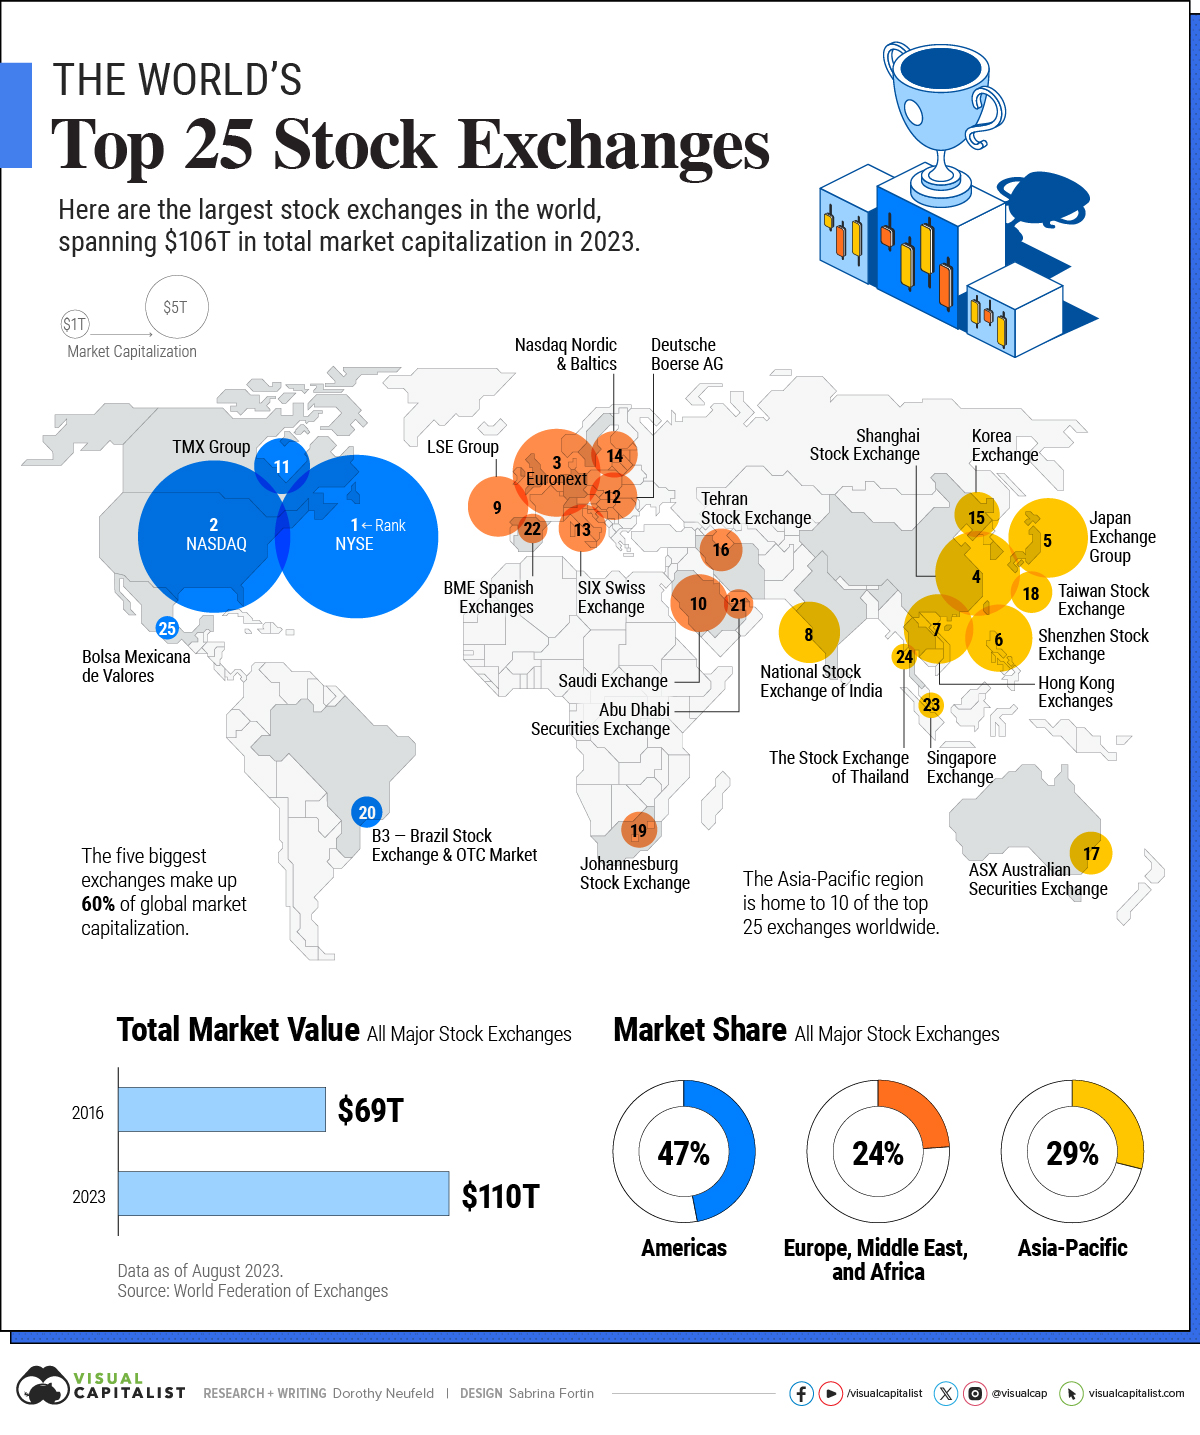
The Largest Stock Exchanges in the World
Today, there are roughly 80 major stock exchanges worth a combined $110.2 trillion in value.
The world’s top two exchanges, the New York Stock Exchange (NYSE) and the Nasdaq, command 42.4% of global market capitalization. Despite the rapid growth of emerging economies, the U.S. continues to lead capital markets by a wide margin—even as countries such as India see considerable growth, surpassing the UK in 2023.
This visualization shows the largest stock exchanges in the world, with data from the World Federation of Exchanges (WFE).
Top Stock Exchanges, by Market Cap
Here are the top 25 largest stock markets covering 96.6% of total stock market capitalization:
| Global Rank | Stock Exchange | Country | Market Cap Aug 2023 |
|---|---|---|---|
| 1 | NYSE | 🇺🇸 U.S. | $25.0T |
| 2 | Nasdaq | 🇺🇸 U.S. | $21.7T |
| 3 | Euronext | 🇳🇱 Netherlands | $7.2T |
| 4 | Shanghai Stock Exchange | 🇨🇳 China | $6.7T |
| 5 | Japan Exchange Group | 🇯🇵 Japan | $5.9T |
| 6 | Shenzhen Stock Exchange | 🇨🇳 China | $4.5T |
| 7 | Hong Kong Exchanges | 🇭🇰 Hong Kong | $4.2T |
| 8 | National Stock Exchange of India | 🇮🇳 India | $3.5T |
| 9 | LSE Group | 🇬🇧 UK | $3.4T |
| 10 | Saudi Exchange | 🇸🇦 Saudi Arabia | $3.1T |
| 11 | TMX Group | 🇨🇦 Canada | $2.9T |
| 12 | Deutsche Boerse AG | 🇩🇪 Germany | $2.1T |
| 13 | SIX Swiss Exchange | 🇨🇭 Switzerland | $2.1T |
| 14 | Nasdaq Nordic and Baltics | 🇸🇪 Sweden, Denmark, Finland and Iceland* | $2.0T |
| 15 | Korea Exchange | 🇰🇷 South Korea | $1.9T |
| 16 | Tehran Stock Exchange | 🇮🇷 Iran | $1.7T |
| 17 | ASX Australian Securities Exchange | 🇦🇺 Australia | $1.7T |
| 18 | Taiwan Stock Exchange | 🇹🇼 Taiwan | $1.6T |
| 19 | Johannesburg Stock Exchange | 🇿🇦 South Africa | $1.2T |
| 20 | B3 - Brazil Stock Exchange and OTC Market | 🇧🇷 Brazil | $0.9T |
| 21 | Abu Dhabi Securities Exchange | 🇦🇪 Abu Dhabi | $0.8T |
| 22 | BME Spanish Exchanges | 🇪🇸 Spain | $0.8T |
| 23 | Singapore Exchange | 🇸🇬 Singapore | $0.6T |
| 24 | The Stock Exchange of Thailand | 🇹🇭 Thailand | $0.6T |
| 25 | Bolsa Mexicana de Valores | 🇲🇽 Mexico | $0.5T |
The NYSE ($25.0 trillion) and the tech-heavy Nasdaq ($21.7 trillion) are home to many of the world’s most valuable firms, from Apple to Nvidia. Since 2016, the NYSE has grown 35.1% while the Nasdaq has ballooned 189.3% in market cap.
The vast majority of companies in the S&P 500 Index, often seen as a barometer for U.S. stock market performance, are traded on these exchanges.
With $7.2 trillion in market cap, Euronext is the world’s third-largest exchange. Since Brexit, the pan-European exchange has attracted more capital and by early 2021, it outranked the London Stock Exchange. Over the last two decades, London’s stock market has fallen from 13% to 4% of the global share.
Ranking fourth is the Shanghai Stock Exchange, at $6.7 trillion in market cap. Beverage giant Kweichow Moutai, ICBC, and PetroChina are the largest companies traded on the exchange.
Like China, as India’s economy has continued to expand, so has its primary stock market. As the twelfth-largest globally, it’s worth $3.5 trillion in market cap, growing over 133% in market value since 2016.
Should You Invest Internationally?
While U.S. stock markets are unmatched in scale in the global arena, investors may look to diversify exposure across the pond.
In fact, by 2050, Goldman Sachs projects that emerging markets’ share of global stock market capitalization will surpass America. Given the strong economic growth of emerging markets, investors may find opportunities in broad market indexes that track these countries through investment vehicles like ETFs or mutual funds.
Yet while international markets may provide opportunities for diversification, they may also present risk given political, regulatory, and economic factors.


Markets in a Minute
The Top 5 Reasons Clients Fire a Financial Advisor
Firing an advisor is often driven by more than cost and performance factors. Here are the top reasons clients ‘break up’ with their advisors.

The Top 5 Reasons Clients Fire a Financial Advisor
What drives investors to fire a financial advisor?
From saving for a down payment to planning for retirement, clients turn to advisors to guide them through life’s complex financial decisions. However, many of the key reasons for firing a financial advisor stem from emotional factors, and go beyond purely financial motivations.
We partnered with Morningstar to show the top reasons clients fire an advisor to provide insight on what’s driving investor behavior.
What Drives Firing Decisions?
Here are the top reasons clients terminated their advisor, based on a survey of 184 respondents:
| Reason for Firing | % of Respondents Citing This Reason | Type of Motivation |
|---|---|---|
| Quality of financial advice and services | 32% | Emotion-based reason |
| Quality of relationship | 21% | Emotion-based reason |
| Cost of services | 17% | Financial-based reason |
| Return performance | 11% | Financial-based reason |
| Comfort handling financial issues on their own | 10% | Emotion-based reason |
Numbers may not total 100 due to rounding. Respondents could select more than one answer.
Numbers may not total 100 due to rounding. Respondents could select more than one answer.
While firing an advisor is rare, many of the primary drivers behind firing decisions are also emotionally driven.
Often, advisors were fired due to the quality of the relationship. In many cases, this was due to an advisor not dedicating enough time to fully grasp their personal financial goals. Additionally, wealthier, and more financially literate clients are more likely to fire their advisors—highlighting the importance of understanding the client.
Key Takeaways
Given these driving factors, here are five ways that advisors can build a lasting relationship through recognizing their clients’ emotional needs:
- Understand your clients’ deeper goals
- Reach out proactively
- Act as a financial coach
- Keep clients updated
- Conduct goal-setting exercises on a regular basis
By communicating their value and setting expectations early, advisors can help prevent setbacks in their practice by adeptly recognizing the emotional motivators of their clients.
Markets in a Minute
The Top 5 Reasons Clients Hire a Financial Advisor
Here are the most common drivers for hiring a financial advisor, revealing that investor motivations go beyond just financial factors.

The Top 5 Reasons Clients Hire a Financial Advisor
What drives investors to hire a financial advisor?
From saving for a down payment to planning for retirement, clients turn to advisors to guide them through life’s complex financial decisions. However, many of the key reasons for hiring a financial advisor stem from emotional factors, and go beyond purely financial motivations.
We partnered with Morningstar to show the top reasons clients hire a financial advisor to provide insight on what’s driving investor behavior.
What Drives Hiring Decisions?
Here are the most common reasons for hiring an advisor, based on a survey of 312 respondents.
| Reason for Hiring | % of Respondents Citing This Reason | Type of Motivation |
|---|---|---|
| Specific goals or needs | 32% | Financial-based reason |
| Discomfort handling finances | 32% | Emotion-based reason |
| Behavioral coaching | 17% | Emotion-based reason |
| Recommended by family or friends | 12% | Emotion-based reason |
| Quality of relationship | 10% | Emotion-based reason |
Numbers may not total 100 due to rounding. Respondents could select more than one answer.
While financial factors played an important role in hiring decisions, emotional reasons made up the largest share of total responses.
This illustrates that clients place a high degree of importance on reaching specific goals or needs, and how an advisor communicates with them. Furthermore, clients seek out advisors for behavioral coaching to help them make informed decisions while staying the course.
Key Takeaways
With this in mind, here are five ways advisors can provide value to their clients and grow their practice:
- Address clients’ emotional needs early on
- Demonstrate how you can offer support
- Use ordinary language
- Provide education to help clients stay on track
- Acknowledge that these are issues we all face
By addressing emotional factors, advisors can more effectively help clients’ navigate intricate financial decisions and avoid common behavioral mistakes.

The Top 5 Reasons Clients Fire a Financial Advisor

The Top 5 Reasons Clients Hire a Financial Advisor

Visualizing the Growth of $100, by Asset Class

How Small Investments Make a Big Impact Over Time

What Were the Top Performing Investment Themes of 2023?
-

 Infographics2 years ago
The Top Investment Quotes Every Investor Should Know
-

 Markets in a Minute2 years ago
Mapped: The Growth in U.S. House Prices by State
-

 Markets in a Minute2 years ago
How Closely Related Are Historical Mortgage Rates and Housing Prices?
-

 Infographics2 years ago
A Visual Guide to Stagflation, Inflation, and Deflation
-

 Markets in a Minute1 year ago
Mapped: Global Energy Prices, by Country in 2022
-

 Markets in a Minute2 years ago
Visualizing Historical Oil Prices (1968-2022)
-

 Infographics1 year ago
Visual Guide: The Three Types of Economic Indicators
-

 Markets in a Minute2 years ago
Mapped: Global Macroeconomic Risk, by Country in 2022
