
Markets in a Minute
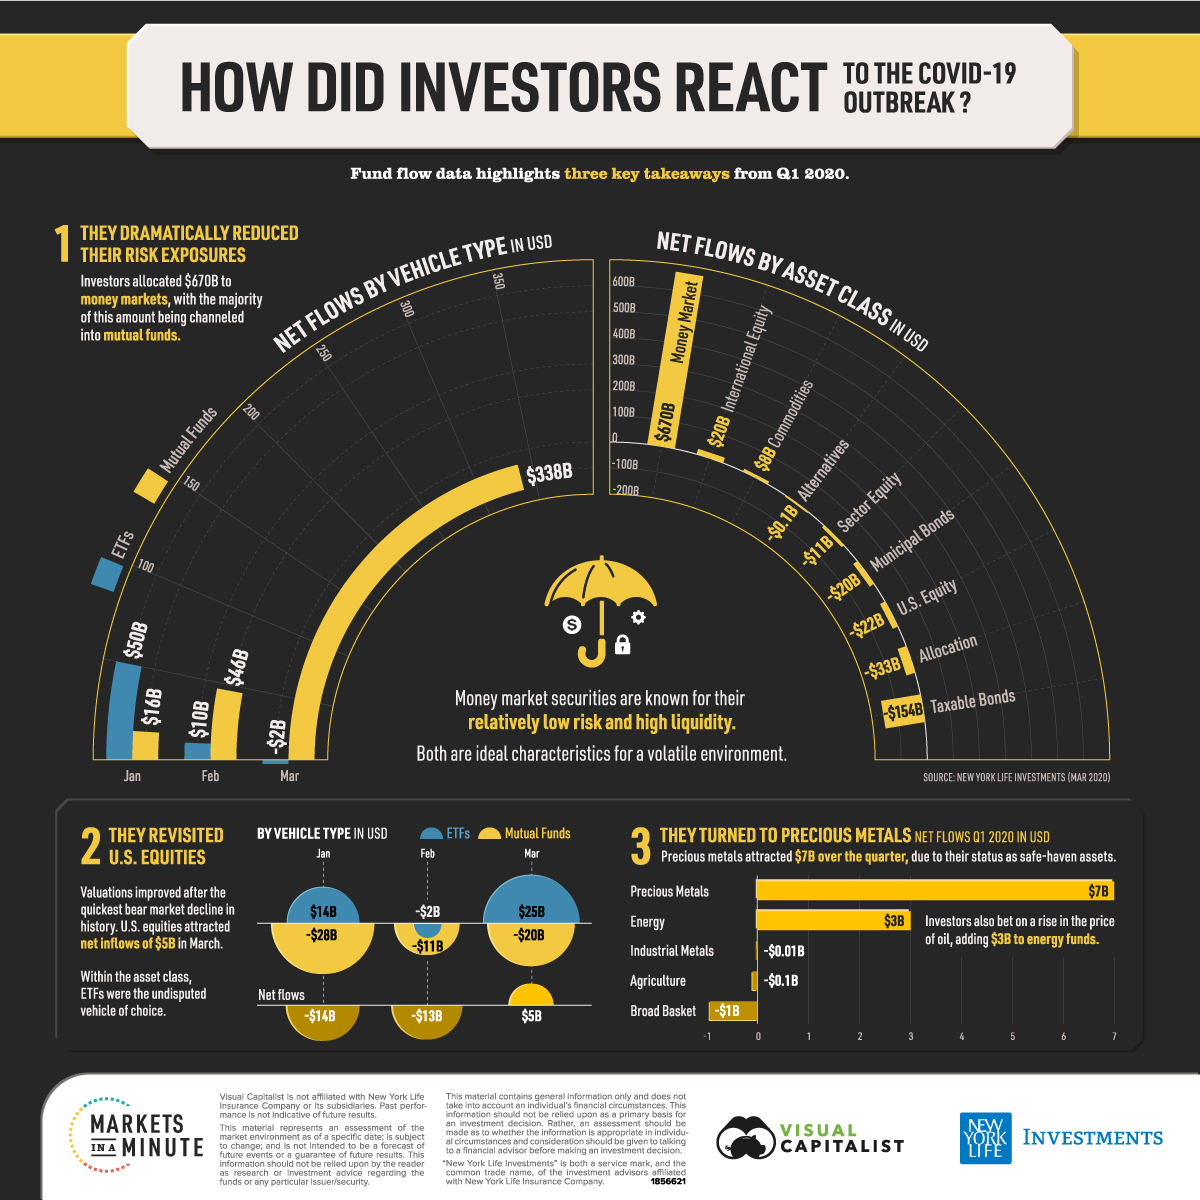
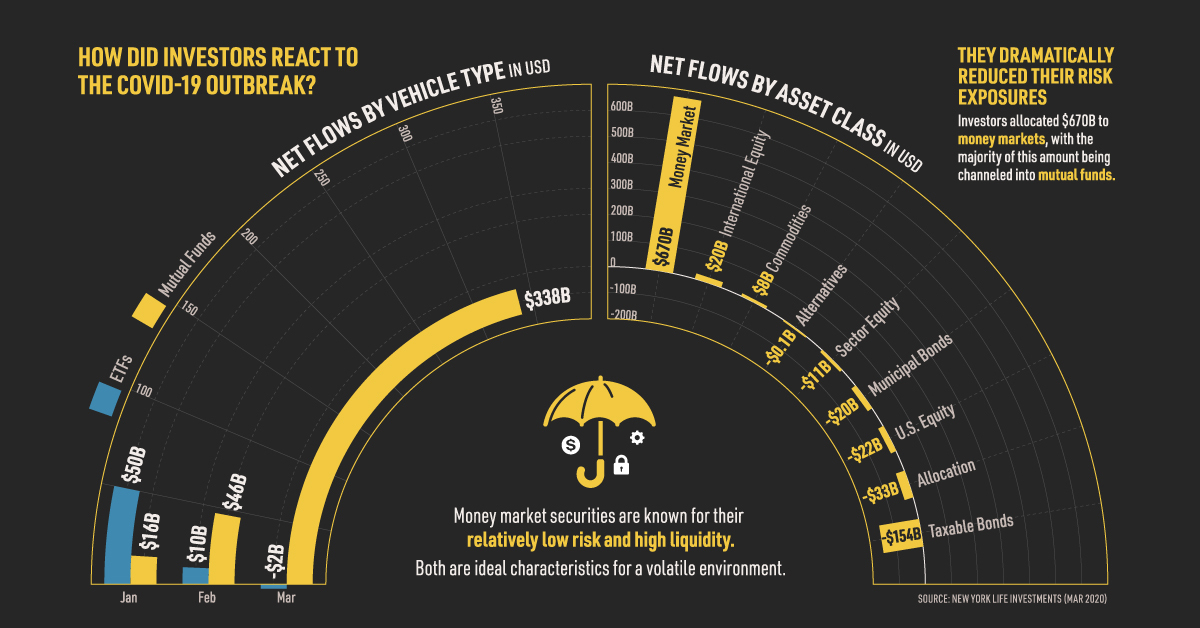
How Did Investors React to the COVID-19 Outbreak?
This Markets in a Minute Chart is available as a poster.
This Markets in a Minute Chart is available as a poster.
How Did Investors React to the COVID-19 Outbreak?
Throughout Q1, investors faced a truly remarkable period of volatility.
For starters, the S&P 500 fell by 30% from its record high in February, achieving the feat in just 22 trading days—the fastest such decline in history. Outside of capital markets, economic damage was abundant. Lockdown orders left entire industries struggling to survive, and unemployment claims across America skyrocketed.
In today’s Markets in a Minute chart from New York Life Investments, we analyze Q1 fund flow data to find out how U.S. investors navigated these highly uncertain times.
Seeking Shelter
A key theme of Q1 2020 was risk aversion, as evidenced by the $670B net inflow to money markets. Money market securities are an ideal investment during volatile periods, thanks to their relatively low risk and high liquidity.
Also of significance was the flow differential between the two main types of investment vehicles. By the end of March, net flows to mutual funds reached $400B, compared to just $58B to ETFs. This difference was fueled by the aforementioned demand for money markets, as mutual funds are the predominant vehicle used to access this asset class.
Below, we break down net flows by asset class, between ETFs and mutual funds:
| Asset Class | ETF Flows | Mutual Funds Flows | Net Flows (Q1 2020) |
|---|---|---|---|
| Money Market | -- | +$670B | +670B |
| International Equity | -$1B | +$21B | +$20B |
| Commodities | +$9B | -$1B | +$8B |
| Alternatives | +$7B | -$7B | -$0.1B |
| Sector Equity | -$4B | -$7B | -$11B |
| Municipal Bonds | +$1B | -$21B | -$20B |
| U.S. Equity | +$37B | -$59B | -$22B |
| Allocation | -$0.2B | -$33B | -$33B |
| Taxable Bonds | +$9B | -$163B | -$154B |
| Total | +$58B | +$400B | +$458B |
Source: New York Life Investments (March 2020)
Taxable bonds fared the worst in terms of net flows, with -$154B pulled from both corporates and governments. This may come as a surprise, as these investments are generally considered to be safer than equities—so why were they sold off in such large amounts?
One trigger was the economic shock of COVID-19, which brought the creditworthiness of many U.S. companies into question. This issue is likely exacerbated by the record levels of corporate debt amassed prior to the disease hitting American shores.
The U.S. government’s rapidly rising fiscal deficit may be another trigger. If the supply of government debt were to overwhelm markets, the value of government bonds would fall, and investors would lose capital. It’s estimated that $4.5T will need to be borrowed to fund the government’s numerous COVID-19 support programs.
U.S. Equities Divided
Although U.S. equities saw net outflows in Q1, a deeper dive into the flow data uncovers a much more nuanced story. For example, with the exception of February, U.S. equity ETFs and mutual funds saw opposing net flows.
| Vehicle Type | January Flows | February Flows | March Flows |
|---|---|---|---|
| ETFs | +$14B | -$2B | +$25B |
| Mutual Funds | -$28B | -$11B | -$20B |
| Total | -$14B | -$13B | +$5B |
Source: New York Life Investments (March 2020)
Overall, ETFs saw net inflows of $37B, while mutual funds saw net outflows of $59B. These findings suggest a strong investor preference for passively-managed products. Breaking down U.S. equity flows by investment style highlights another inequality.
| Investment Style | Net Flows (Q1 2020) |
|---|---|
| Blend | +$27B |
| Growth | -$35B |
| Value | -$14B |
Source: New York Life Investments (March 2020)
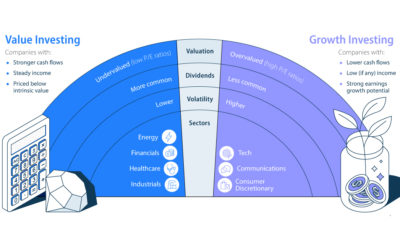
Growth strategies prioritize capital appreciation, while value strategies seek stocks that pay dividends and are trading at a discount. Blend strategies, the only style to attract net inflows in Q1, offer investors a mix of both.
Betting on Oil
Within commodities, investors added $7B to precious metals funds. These inflows were not a surprise, given gold and silver’s status as safe-haven assets.
The only other subcategory to attract net inflows was energy—investors bet on a rise in the price of oil, adding $3B to energy funds over the quarter. Of this amount, $2B was added in March. Since then, oil prices have continued to slide (even falling below zero) due to plummeting demand and oversupply.
What’s in Store for the Rest of 2020?
Volatility is likely to continue throughout 2020. Uncertainty surrounding the duration of the pandemic remains, with countries such as South Korea and China reporting a resurgence in cases. Further questions arise as central banks, including the U.S. Federal Reserve, continue to provide unprecedented levels of stimulus.
Nevertheless, sticking to a long-term investment plan, and avoiding common psychological pitfalls, can help investors prepare for whatever comes next.


Markets in a Minute
The Top 5 Reasons Clients Fire a Financial Advisor
Firing an advisor is often driven by more than cost and performance factors. Here are the top reasons clients ‘break up’ with their advisors.

The Top 5 Reasons Clients Fire a Financial Advisor
What drives investors to fire a financial advisor?
From saving for a down payment to planning for retirement, clients turn to advisors to guide them through life’s complex financial decisions. However, many of the key reasons for firing a financial advisor stem from emotional factors, and go beyond purely financial motivations.
We partnered with Morningstar to show the top reasons clients fire an advisor to provide insight on what’s driving investor behavior.
What Drives Firing Decisions?
Here are the top reasons clients terminated their advisor, based on a survey of 184 respondents:
| Reason for Firing | % of Respondents Citing This Reason | Type of Motivation |
|---|---|---|
| Quality of financial advice and services | 32% | Emotion-based reason |
| Quality of relationship | 21% | Emotion-based reason |
| Cost of services | 17% | Financial-based reason |
| Return performance | 11% | Financial-based reason |
| Comfort handling financial issues on their own | 10% | Emotion-based reason |
Numbers may not total 100 due to rounding. Respondents could select more than one answer.
Numbers may not total 100 due to rounding. Respondents could select more than one answer.
While firing an advisor is rare, many of the primary drivers behind firing decisions are also emotionally driven.
Often, advisors were fired due to the quality of the relationship. In many cases, this was due to an advisor not dedicating enough time to fully grasp their personal financial goals. Additionally, wealthier, and more financially literate clients are more likely to fire their advisors—highlighting the importance of understanding the client.
Key Takeaways
Given these driving factors, here are five ways that advisors can build a lasting relationship through recognizing their clients’ emotional needs:
- Understand your clients’ deeper goals
- Reach out proactively
- Act as a financial coach
- Keep clients updated
- Conduct goal-setting exercises on a regular basis
By communicating their value and setting expectations early, advisors can help prevent setbacks in their practice by adeptly recognizing the emotional motivators of their clients.
Markets in a Minute
The Top 5 Reasons Clients Hire a Financial Advisor
Here are the most common drivers for hiring a financial advisor, revealing that investor motivations go beyond just financial factors.

The Top 5 Reasons Clients Hire a Financial Advisor
What drives investors to hire a financial advisor?
From saving for a down payment to planning for retirement, clients turn to advisors to guide them through life’s complex financial decisions. However, many of the key reasons for hiring a financial advisor stem from emotional factors, and go beyond purely financial motivations.
We partnered with Morningstar to show the top reasons clients hire a financial advisor to provide insight on what’s driving investor behavior.
What Drives Hiring Decisions?
Here are the most common reasons for hiring an advisor, based on a survey of 312 respondents.
| Reason for Hiring | % of Respondents Citing This Reason | Type of Motivation |
|---|---|---|
| Specific goals or needs | 32% | Financial-based reason |
| Discomfort handling finances | 32% | Emotion-based reason |
| Behavioral coaching | 17% | Emotion-based reason |
| Recommended by family or friends | 12% | Emotion-based reason |
| Quality of relationship | 10% | Emotion-based reason |
Numbers may not total 100 due to rounding. Respondents could select more than one answer.
While financial factors played an important role in hiring decisions, emotional reasons made up the largest share of total responses.
This illustrates that clients place a high degree of importance on reaching specific goals or needs, and how an advisor communicates with them. Furthermore, clients seek out advisors for behavioral coaching to help them make informed decisions while staying the course.
Key Takeaways
With this in mind, here are five ways advisors can provide value to their clients and grow their practice:
- Address clients’ emotional needs early on
- Demonstrate how you can offer support
- Use ordinary language
- Provide education to help clients stay on track
- Acknowledge that these are issues we all face
By addressing emotional factors, advisors can more effectively help clients’ navigate intricate financial decisions and avoid common behavioral mistakes.

The Top 5 Reasons Clients Fire a Financial Advisor

The Top 5 Reasons Clients Hire a Financial Advisor

Visualizing the Growth of $100, by Asset Class

How Small Investments Make a Big Impact Over Time

What Were the Top Performing Investment Themes of 2023?
-

 Infographics2 years ago
The Top Investment Quotes Every Investor Should Know
-

 Markets in a Minute2 years ago
Mapped: The Growth in U.S. House Prices by State
-

 Markets in a Minute2 years ago
How Closely Related Are Historical Mortgage Rates and Housing Prices?
-

 Infographics2 years ago
A Visual Guide to Stagflation, Inflation, and Deflation
-

 Markets in a Minute1 year ago
Mapped: Global Energy Prices, by Country in 2022
-

 Markets in a Minute2 years ago
Visualizing Historical Oil Prices (1968-2022)
-

 Infographics1 year ago
Visual Guide: The Three Types of Economic Indicators
-

 Markets in a Minute2 years ago
Mapped: Global Macroeconomic Risk, by Country in 2022
