
Markets in a Minute
The Outperformance of ESG Investing During the COVID-19 Selloff
This Markets in a Minute Chart is available as a poster.
This Markets in a Minute Chart is available as a poster.
ESG Investing During the COVID-19 Selloff
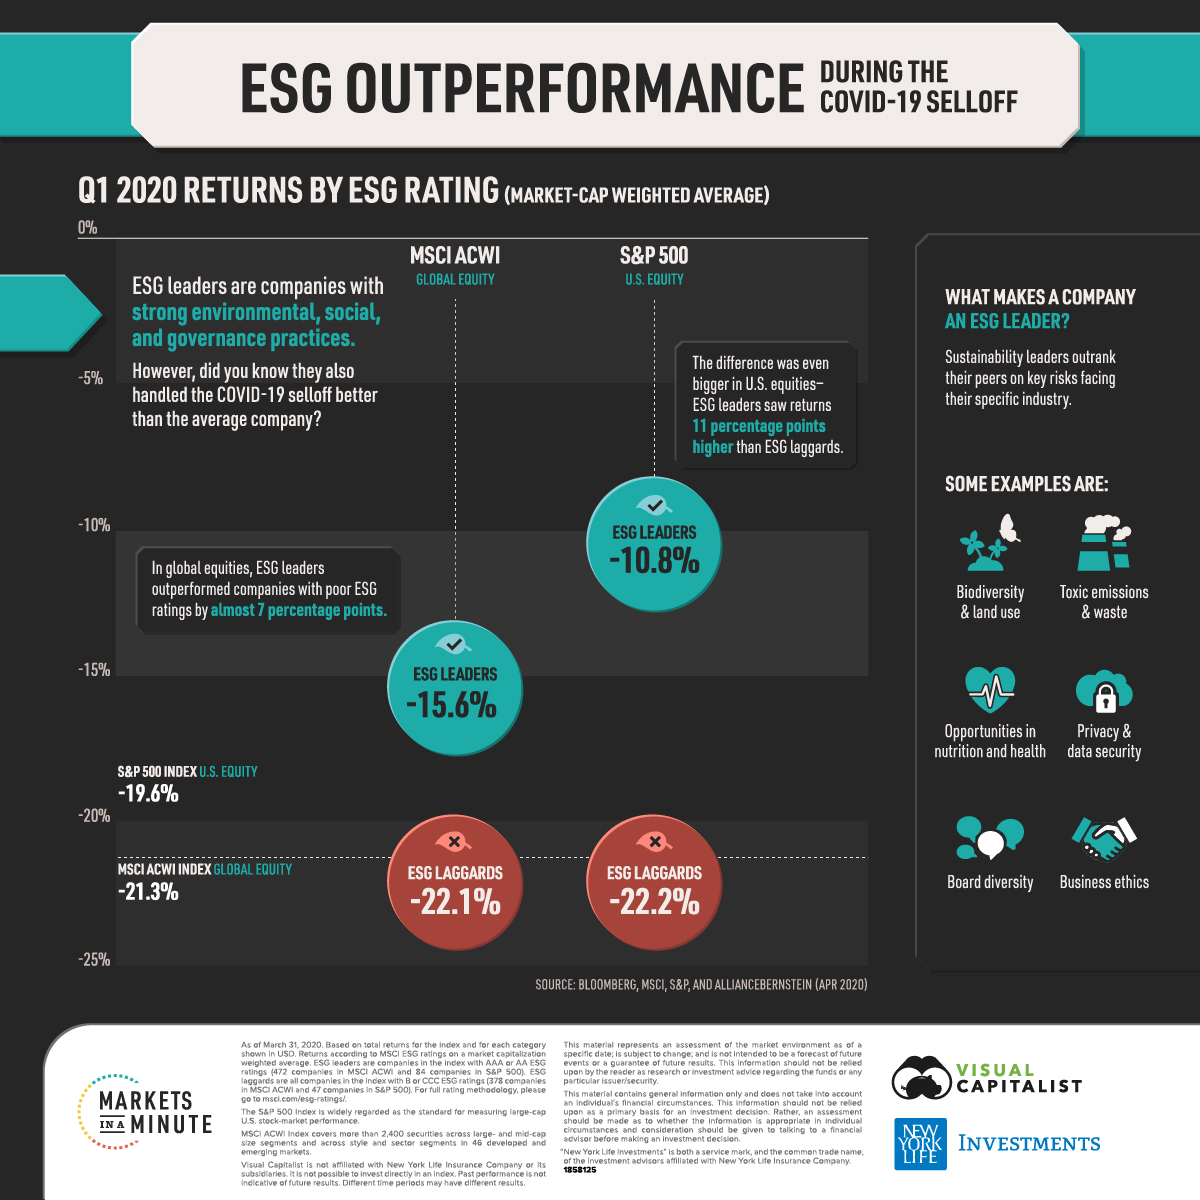
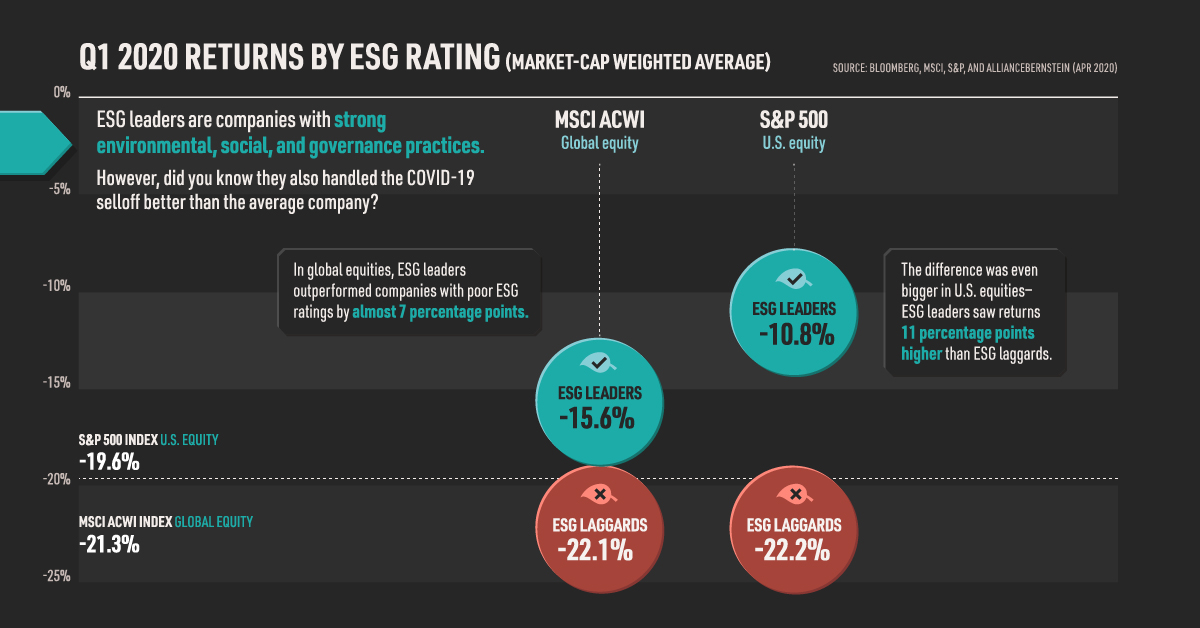
Many investors know that ESG investing considers a company’s environmental, social, and governance practices. While this has the obvious benefit of aligning investments with personal values, it also has the potential to produce above-average returns.
In today’s Markets in a Minute chart from New York Life Investments, we highlight how ESG leaders outperformed both the broader market and ESG laggards during the COVID-19 selloff.
ESG Leader Returns
Amid heightened volatility in the first quarter, sustainable companies were able to provide a level of downside protection.
The following data shows returns by MSCI ESG ratings. These ratings rank a company based on how it performs relative to its peers on industry-specific risks. For example, an oil and gas company may be rated as an ESG leader if it manages issues like toxic emissions and waste better than its competitors.
From January through March 2020, here’s how ESG leaders performed relative to their respective index and ESG laggards:
| ESG Leaders | Index | ESG Laggards | |
|---|---|---|---|
| MSCI ACWI Global Equity | -15.6% | -21.3% | -22.1% |
| S&P 500 U.S. Equity | -10.8% | -19.6% | -22.2% |
Within the MSCI All Country World Index (ACWI), ESG leaders saw losses that were nearly six percentage points smaller than the index. As of March 31, the index contained 472 ESG leaders and 378 ESG laggards. The remaining 1,500+ securities demonstrated average ratings.
The performance difference was even more evident in the S&P 500. ESG leaders had returns that were almost 9 percentage points better than the index, and more than 10 percentage points better than ESG laggards. The index included 84 ESG leaders and 47 ESG laggards. The remaining securities, of which there were about 370, had average ratings.
What could help explain the outperformance of sustainable stocks in this situation?
By their very definition, ESG leaders are better at mitigating serious environmental, social, and governance risks. This means they are more likely to avoid large financial losses and potential bankruptcies. As a result, they tend to provide enhance downside protection during market selloffs. On the other hand, ESG laggards may suffer from higher operational costs, potential litigation costs, and more volatility.
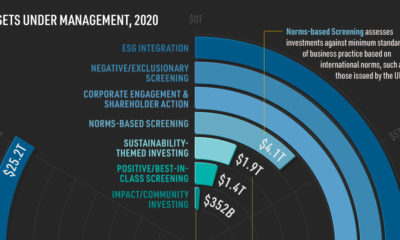
ESG Investing: A Popular Choice
During the COVID-19 selloff, investors dramatically reduced their risk exposures—and this included pouring money into ESG investing strategies. Worldwide ESG fund inflows topped $45 billion, a sharp contrast to the $385 billion in overall fund universe outflows.
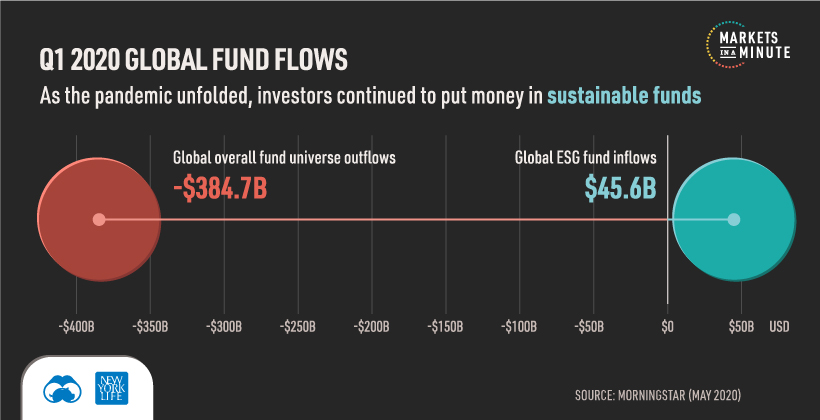
However, this is far from a short-term trend. For the past three years, global assets in sustainable funds have been steadily increasing. The COVID-19 selloff has simply accelerated investor’s shifting preferences for companies that better manage sustainability risks.
Of course, with over 2,500 sustainable funds available globally, the performance of ESG investments can vary. Investors can analyze how a fund chooses companies in order to select a strategy that aligns with their personal views, and maximizes their chances of higher returns.


Markets in a Minute
The Top 5 Reasons Clients Fire a Financial Advisor
Firing an advisor is often driven by more than cost and performance factors. Here are the top reasons clients ‘break up’ with their advisors.

The Top 5 Reasons Clients Fire a Financial Advisor
What drives investors to fire a financial advisor?
From saving for a down payment to planning for retirement, clients turn to advisors to guide them through life’s complex financial decisions. However, many of the key reasons for firing a financial advisor stem from emotional factors, and go beyond purely financial motivations.
We partnered with Morningstar to show the top reasons clients fire an advisor to provide insight on what’s driving investor behavior.
What Drives Firing Decisions?
Here are the top reasons clients terminated their advisor, based on a survey of 184 respondents:
| Reason for Firing | % of Respondents Citing This Reason | Type of Motivation |
|---|---|---|
| Quality of financial advice and services | 32% | Emotion-based reason |
| Quality of relationship | 21% | Emotion-based reason |
| Cost of services | 17% | Financial-based reason |
| Return performance | 11% | Financial-based reason |
| Comfort handling financial issues on their own | 10% | Emotion-based reason |
Numbers may not total 100 due to rounding. Respondents could select more than one answer.
Numbers may not total 100 due to rounding. Respondents could select more than one answer.
While firing an advisor is rare, many of the primary drivers behind firing decisions are also emotionally driven.
Often, advisors were fired due to the quality of the relationship. In many cases, this was due to an advisor not dedicating enough time to fully grasp their personal financial goals. Additionally, wealthier, and more financially literate clients are more likely to fire their advisors—highlighting the importance of understanding the client.
Key Takeaways
Given these driving factors, here are five ways that advisors can build a lasting relationship through recognizing their clients’ emotional needs:
- Understand your clients’ deeper goals
- Reach out proactively
- Act as a financial coach
- Keep clients updated
- Conduct goal-setting exercises on a regular basis
By communicating their value and setting expectations early, advisors can help prevent setbacks in their practice by adeptly recognizing the emotional motivators of their clients.
Markets in a Minute
The Top 5 Reasons Clients Hire a Financial Advisor
Here are the most common drivers for hiring a financial advisor, revealing that investor motivations go beyond just financial factors.

The Top 5 Reasons Clients Hire a Financial Advisor
What drives investors to hire a financial advisor?
From saving for a down payment to planning for retirement, clients turn to advisors to guide them through life’s complex financial decisions. However, many of the key reasons for hiring a financial advisor stem from emotional factors, and go beyond purely financial motivations.
We partnered with Morningstar to show the top reasons clients hire a financial advisor to provide insight on what’s driving investor behavior.
What Drives Hiring Decisions?
Here are the most common reasons for hiring an advisor, based on a survey of 312 respondents.
| Reason for Hiring | % of Respondents Citing This Reason | Type of Motivation |
|---|---|---|
| Specific goals or needs | 32% | Financial-based reason |
| Discomfort handling finances | 32% | Emotion-based reason |
| Behavioral coaching | 17% | Emotion-based reason |
| Recommended by family or friends | 12% | Emotion-based reason |
| Quality of relationship | 10% | Emotion-based reason |
Numbers may not total 100 due to rounding. Respondents could select more than one answer.
While financial factors played an important role in hiring decisions, emotional reasons made up the largest share of total responses.
This illustrates that clients place a high degree of importance on reaching specific goals or needs, and how an advisor communicates with them. Furthermore, clients seek out advisors for behavioral coaching to help them make informed decisions while staying the course.
Key Takeaways
With this in mind, here are five ways advisors can provide value to their clients and grow their practice:
- Address clients’ emotional needs early on
- Demonstrate how you can offer support
- Use ordinary language
- Provide education to help clients stay on track
- Acknowledge that these are issues we all face
By addressing emotional factors, advisors can more effectively help clients’ navigate intricate financial decisions and avoid common behavioral mistakes.

The Top 5 Reasons Clients Fire a Financial Advisor

The Top 5 Reasons Clients Hire a Financial Advisor

Visualizing the Growth of $100, by Asset Class

How Small Investments Make a Big Impact Over Time

What Were the Top Performing Investment Themes of 2023?
-

 Infographics2 years ago
The Top Investment Quotes Every Investor Should Know
-

 Markets in a Minute2 years ago
Mapped: The Growth in U.S. House Prices by State
-

 Markets in a Minute2 years ago
How Closely Related Are Historical Mortgage Rates and Housing Prices?
-

 Infographics2 years ago
A Visual Guide to Stagflation, Inflation, and Deflation
-

 Markets in a Minute1 year ago
Mapped: Global Energy Prices, by Country in 2022
-

 Markets in a Minute2 years ago
Visualizing Historical Oil Prices (1968-2022)
-

 Infographics1 year ago
Visual Guide: The Three Types of Economic Indicators
-

 Markets in a Minute2 years ago
Mapped: Global Macroeconomic Risk, by Country in 2022
