
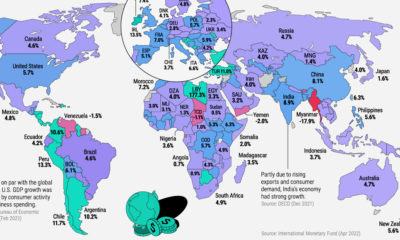

The world economy expanded by 6.1% in 2021. This map shows GDP growth by country amid the COVID-19 recovery.


The real price of oil reached a seven year high amid the Russia-Ukraine war. How have other major events impacted historical oil prices?
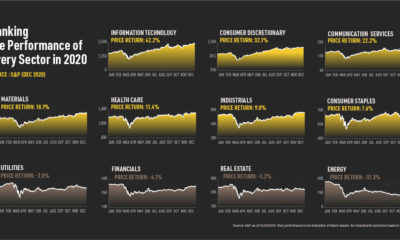

Who were the big winners of 2020? We rank the S&P performance of 11 sectors—and provide possible explanations on why the market had a strong year.

Are 2021 economic projections looking up? As we look back on a historic year, this graphic outlines key growth forecasts for the year ahead.
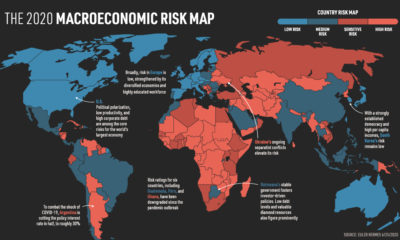

Which countries have the highest macroeconomic risk? This macroeconomic risk map shows how countries are positioned going forward in 2020.
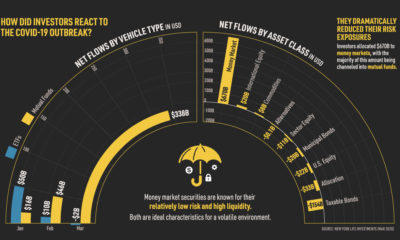

During the COVID-19 outbreak, investors faced a remarkable period of volatility. We analyze fund flow data to see what types of assets they preferred.
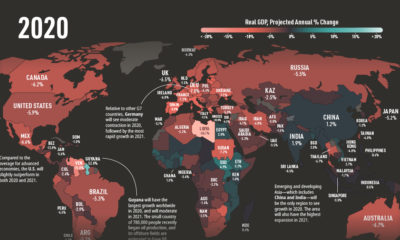

The global economy is projected to contract by 3% in 2020, followed by 5.8% growth in 2021. This animated map shows the IMF's country-level economic forecast.
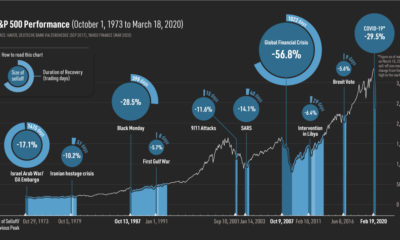

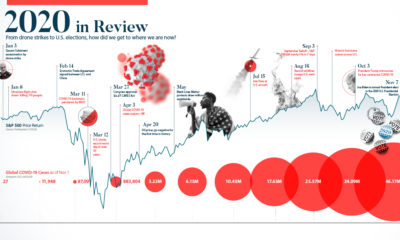
Black swan events like COVID-19 can cause investors to panic. However, markets have historically recovered—and such drops may offer long-term opportunities.


