
Infographics
How Carbon Offsetting Works, and What Investors Should Know

This infographic is available as a poster.
Carbon Offsetting: What Investors Should Know
In 2016, an international treaty known as the Paris Agreement was negotiated by member nations of the UN Framework Convention on Climate Change.
The long-term goal of this agreement is to limit the increase in global temperature to below 3.6°F (2°C) over the next century. Achieving this target will require the world to develop cleaner solutions across all areas of the economy, from energy to transportation.
In this infographic from New York Life Investments, we introduce carbon offsetting, an activity used by both businesses and investment funds that has the potential to accelerate the development of a more climate-friendly economy.
What are GHG Emissions, and Where do They Come From?
Greenhouse gases (GHGs) are a family of gases known to trap heat in the Earth’s atmosphere. The most prevalent among them is carbon dioxide (CO₂), which accounts for 80% of America’s GHG emissions. Common sources of CO₂ include fossil fuel consumption and deforestation.
Businesses are often significant emitters of CO₂, but due to the complexity of their production chains, emissions can be difficult to track. To combat this, a company’s carbon footprint is measured across three scopes:
- Scope 1: These are direct emissions from a company’s operations. An example would be the CO₂ emitted by company-owned factories.
- Scope 2: These are indirect emissions from a company’s operations, such as the pollution generated from purchased electricity.
- Scope 3: These are indirect emissions from the company’s supply chains. Common sources include the extraction of raw materials and business travel.
Although we understand that GHGs are harmful to the planet, our ability to eliminate them is limited by technology and costs. Fortunately, this is where offsetting can help.
How Does Carbon Offsetting Work?
Carbon offsetting is a method of neutralizing one’s emissions by investing in GHG-reducing projects. The benefits of these projects are measured by the amount of CO₂ equivalent (CO₂e) that they avoid or absorb. Then, the company or fund that is engaging in the carbon offsetting project will then receive one carbon credit for every tonne of CO₂e negated.
Below are the three common types of GHG reduction programs.
1. Energy efficiency projects
These projects reduce energy consumption. One example is the distribution of energy-efficient cookstoves in Rwanda, a country where many people rely on firewood and charcoal. By distributing 10,800 cookstoves throughout the country, nearly 60,000 tonnes of CO₂e can be avoided each year.
2. Forestry projects
These projects nurture and protect our CO₂-absorbing forests. One notable example is the Garcia River forest protection program, which ensures the longevity of California’s redwood forests. The program oversees over 9,600 hectares which has been estimated to store almost 80,000 tonnes of CO₂e annually.
3. Renewable energy projects
These projects reduce our dependency on fossil fuels. They are especially effective in economies such as Taiwan, where 75% of electricity capacity relies on fossil fuels. Thanks to its strong coastal winds, Taiwan is able to remove 328,000 tonnes of CO₂e per year with just 62 wind turbines.
How is Offsetting Regulated?
Carbon offsetting in America is primarily a voluntary activity, but some state governments have made it mandatory for significant polluters. Here’s how both markets are regulated.
The Voluntary Market
The voluntary market is regulated by a variety of third-party organizations such as Verra, Gold Standard, and American Carbon.
They conduct audits on GHG reduction projects to ensure each one meets four broad criteria:
- Measurability: The GHG savings of the project must be measurable
- Verifiability: The results of the project must be verified on an annual basis
- Sustainability: Each project should have a minimum lifespan of seven years
- Additionality: GHG reductions of project must be considered in reference to a baseline scenario
Carbon credits are only issued after a project has passed this verification process.
The Mandatory Market
Some U.S. states have introduced carbon offsetting schemes to meet their climate goals. One of the largest is California’s Cap and Trade program which was introduced in 2013.
The program is targeted at businesses that emit over 25,000 tonnes of CO₂e annually, and works by setting a “cap” on total annual emissions. This cap is reduced each year, and overpolluting businesses must acquire carbon credits to offset their excess pollution. These can be purchased from state-administered auctions or from other firms.
Revenues generated from California’s carbon credit auctions are used to fund various GHG reduction projects, including:
- 690,000 acres of land preserved or restored
- 287,000 rebates issued for zero-emission and plug-in hybrid cars
- 108,000 urban tree plantings
- 150,000 energy efficiency projects installed in homes
By 2030, California’s emissions cap is intended to reach 200.5 million tonnes of CO₂e, marking a near 50% reduction from its 2015 level.
What Role can Investors Play?
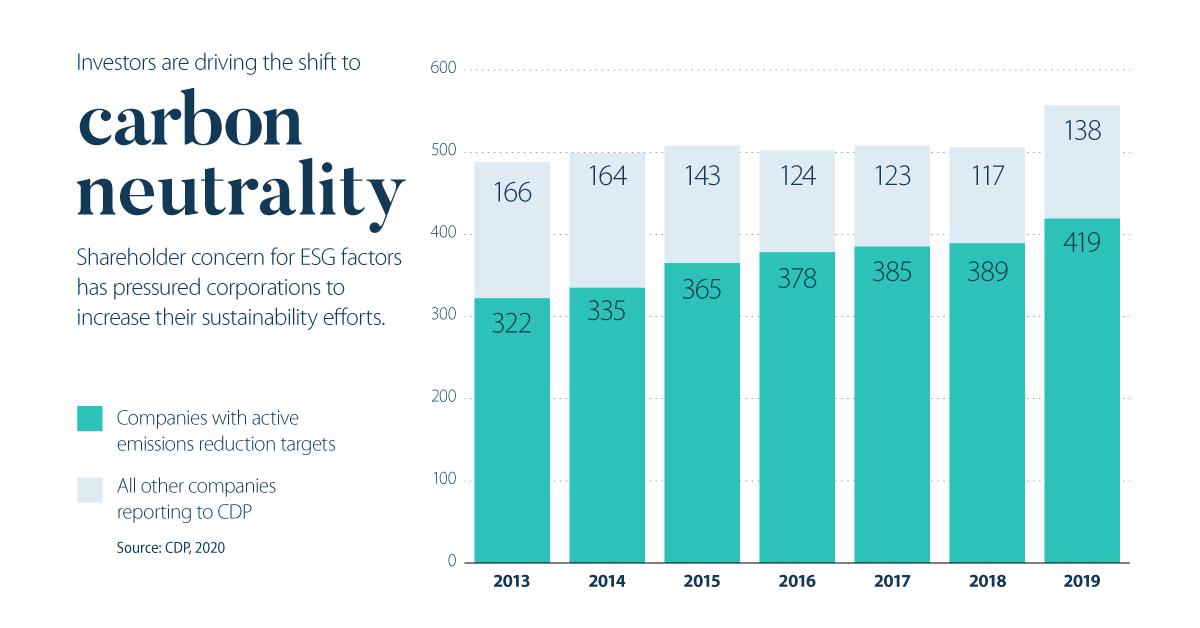
A majority of U.S. investors consider themselves to be values-based, meaning they care about the societal and environmental impacts of their investments. This mentality is increasing the demand for ESG investing and placing pressure on corporations to become more sustainable.
For example, the percentage of S&P 500 firms that publish sustainability reports has risen from just 20% in 2011 to 90% in 2019. More importantly, a growing number of U.S. firms are cooperating with the CDP (formerly the Carbon Disclosure Project) to report their emissions and set formal reduction targets.
| Year | Companies with active emissions reduction targets | All other companies reporting to the CDP | Total |
|---|---|---|---|
| 2013 | 322 | 166 | 488 |
| 2014 | 335 | 164 | 499 |
| 2015 | 365 | 143 | 508 |
| 2016 | 378 | 124 | 502 |
| 2017 | 385 | 123 | 508 |
| 2018 | 389 | 117 | 506 |
| 2019 | 419 | 138 | 557 |
Source: CDP 2020
Some of the world’s largest oil producers are also taking action—a testament to the significance of these shareholder concerns. Royal Dutch Shell announced earlier in 2020 that it intends to fully offset its Scope 1 and 2 emissions.
Does Offsetting Really Help?
Carbon offsetting programs such as the one implemented by California have the potential to generate revenues and encourage innovation. Critics, however, have suggested it has a number of design issues.
One such issue is the fact that California’s carbon credits do not expire. This could allow companies to stockpile credits and ignore future cuts to the emissions cap. Another concern is that the companies covered by California’s cap and trade will simply pass their higher costs to the consumer, although this claim didn’t seem to hold up in a 2016 study conducted by UCLA.
Other inefficiencies within the program may exist, but its benefits are hard to ignore. By the end of 2019, the revenue generated from California’s carbon credit auctions totaled $12.5 billion. Of this amount, over $5 billion has been invested in GHG reduction projects to date.


Infographics
The 20 Most Common Investment Mistakes, in One Chart
Here are the top investment mistakes to avoid, from emotionally driven investing to paying too much in fees.
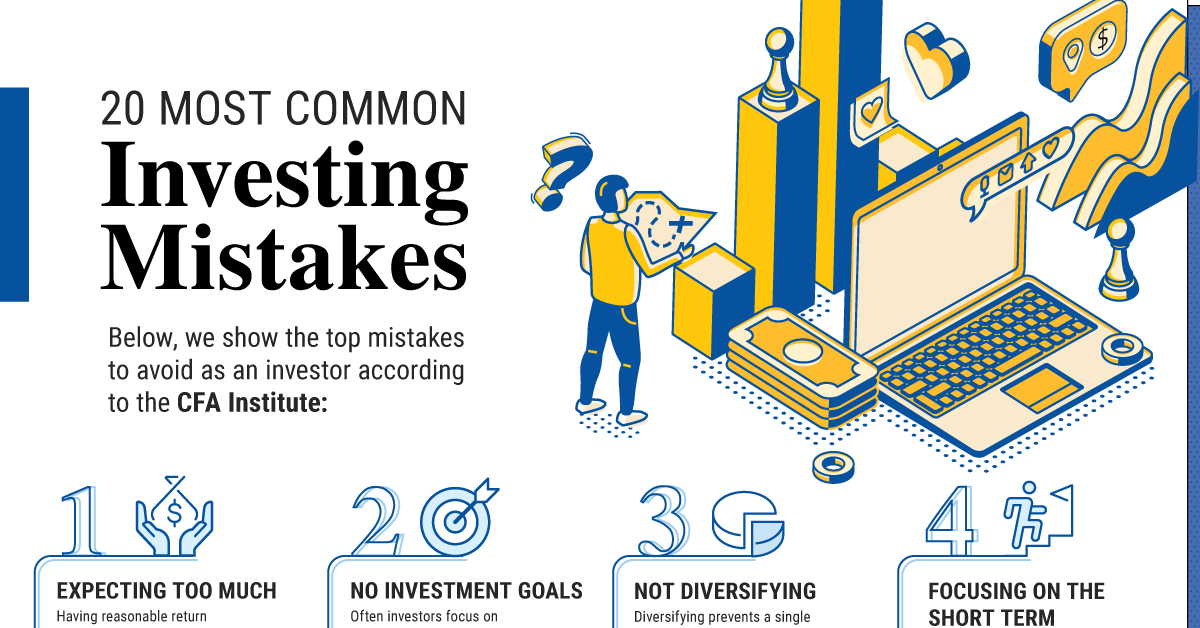
The 20 Most Common Investment Mistakes
No one is immune to errors, including the best investors in the world.
Fortunately, investment mistakes can provide valuable lessons over time, providing investors an opportunity to gain insights on investing—and build more resilient portfolios.
This graphic shows the top 20 mistakes to watch out for, according to the CFA Institute.
20 Investment Mistakes to Avoid
From emotionally driven investment decisions to paying too much on fees, here are some mistakes that investors commonly make:
| Top 20 Mistakes | Description |
|---|---|
| 1. Expecting Too Much | Having reasonable return expectations helps investors keep a long-term view without reacting emotionally. |
| 2. No Investment Goals | Often investors focus on short-term returns or the latest investment craze instead of their long-term investment goals. |
| 3. Not Diversifying | Diversifying prevents a single stock from drastically impacting the value of your portfolio. |
| 4. Focusing on the Short Term | It’s easy to focus on the short term, but this can make investors second-guess their original strategy and make careless decisions. |
| 5. Buying High and Selling Low | Investor behavior during market swings often hinders overall performance. |
| 6. Trading Too Much | One study shows that the most active traders underperformed the U.S. stock market by 6.5% on average annually. Source: The Journal of Finance |
| 7. Paying Too Much in Fees | Fees can meaningfully impact your overall investment performance, especially over the long run. |
| 8. Focusing Too Much on Taxes | While tax-loss harvesting can boost returns, making a decision solely based on its tax consequences may not always be merited. |
| 9. Not Reviewing Investments Regularly | Review your portfolio quarterly or annually to make sure you’re staying on track or if your portfolio is in need of rebalancing. |
| 10. Misunderstanding Risk | Too much risk can take you out of your comfort zone, but too little risk may result in lower returns that do not reach your financial goals. Recognize the right balance for your personal situation. |
| 11. Not Knowing Your Performance | Often, investors don’t actually know the performance of their investments. Review your returns to track if you are meeting your investment goals factoring in fees and inflation. |
| 12. Reacting to the Media | Negative news in the short-term can trigger fear, but remember to focus on the long run. |
| 13. Forgetting About Inflation | Historically, inflation has averaged 4% annually. Value of $100 at 4% Annual Inflation After 1 Year: $96 After 20 Years: $44 |
| 14. Trying to Time the Market | Market timing is extremely hard. Staying in the market can generate much higher returns versus trying to time the market perfectly. |
| 15. Not Doing Due Diligence | Check the credentials of your advisor through sites like BrokerCheck, which shows their employment history and complaints. |
| 16. Working With the Wrong Advisor | Taking the time to find the right advisor is worth it. Vet your advisor carefully to ensure your goals are aligned. |
| 17. Investing With Emotions | Although it can be challenging, remember to stay rational during market fluctuations. |
| 18. Chasing Yield | High-yielding investments often carry the highest risk. Carefully assess your risk profile before investing in these types of assets. |
| 19. Neglecting to Start | Consider two people investing $200 monthly assuming a 7% annual rate of return until the age of 65. If one person started at age 25, their end portfolio would be $520K, but if the other started at 35 it would total about $245K. |
| 20. Not Controlling What You Can | While no one can predict the market, investors can control small contributions over time, which can have powerful outcomes. |
For instance, not properly diversifying can expose you to higher risk. Holding one concentrated position can drastically impact the value of your portfolio when prices fluctuate.
In fact, one study shows that the optimal diversification for a large-cap portfolio is holding 15 stocks. In this way, it helps capture the highest possible return relative to risk. When it came to a small-cap portfolio, the number of stocks rose to 26 for optimal risk reduction.
It’s worth noting that one size does not fit all, and seeking financial advice can help you find the right balance based on your financial goals.
Another common mistake is trading too much. Since each trade can rake up fees, this can impact your overall portfolio performance. A separate study showed that the most active traders saw the worst returns, underperforming the U.S. stock market by 6.5% on average annually.
Finally, it’s important to carefully monitor your investments regularly as market conditions change, factoring in fees and inflation. This will let you know if your investments are on track, or if you need to adjust based on changing personal circumstances or other factors.
Controlling What You Can
To help avoid these mistakes, investors can remember to stay rational and focus on their long-term goals. Building a solid portfolio often involves assessing the following factors:
- Financial goals
- Current income
- Spending habits
- Market environment
- Expected returns
With these factors in mind, investors can avoid focusing on short-term market swings, and control what they can. Making small investments over the long run can have powerful effects, with the potential to accumulate significant wealth simply by investing consistently over time.
Infographics
Visual Guide: The Three Types of Economic Indicators
From GDP to interest rates, this infographic shows key economic indicators for navigating the massive U.S. economy.
View the high resolution version of this infographic. Buy the poster.
A Visual Guide to Economic Indicators
Economic indicators provide insight on the state of financial markets.
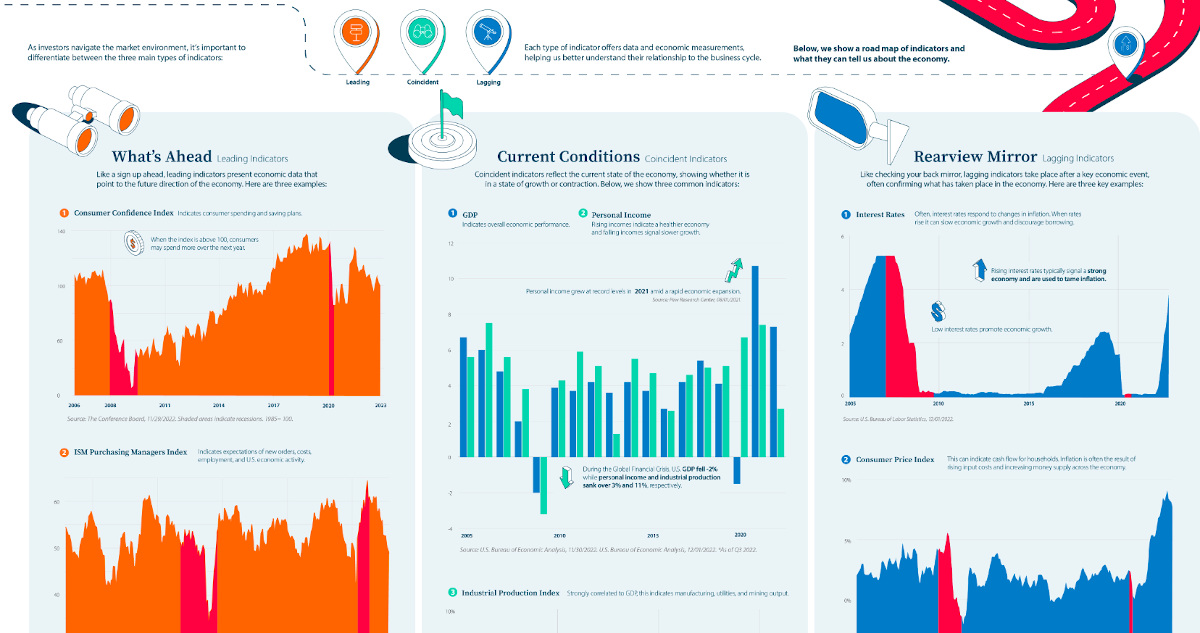
Each type of indicator offers data and economic measurements, helping us better understand their relationship to the business cycle. As investors navigate the market environment, it’s important to differentiate between the three main types of indicators:
- Leading
- Coincident
- Lagging
The above infographic from New York Life Investments shows a road map of indicators and what they can tell us about the economy.
What’s Ahead: Leading Indicators
Leading indicators present economic data that point to the future direction of the economy like a sign up ahead. Here are three examples.
1. Consumer Confidence Index
This key measure indicates consumer spending and saving plans. When the index is above 100, consumers may spend more over the next year. In December, the index jumped to 108 up from 101 in November. This was in part due to lower inflation expectations and improving job prospects.
In the December survey, 48% indicated that the job market remained strong, highlighting the strength of employment opportunities and likely influencing sentiment towards spending in the future.
2. ISM Purchasing Managers Index
The ISM Purchasing Managers Index indicates expectations of new orders, costs, employment, and U.S. economic activity in the manufacturing sector. The following table shows how the index is broken down based on select measures:
| Index | Nov 2022 | Oct 2022 | Percentage Point Change | Direction | Trend (Months) |
|---|---|---|---|---|---|
| Manufacturing PMI | 49.0 | 50.2 | -1.2 | Contracting | 1 |
| New Orders | 47.2 | 49.2 | -2.0 | Contracting | 3 |
| Employment | 48.4 | 50.0 | -1.6 | Contracting | 1 |
| Prices | 43.0 | 46.6 | -3.6 | Decreasing | 2 |
| Imports | 46.6 | 50.8 | -4.2 | Contracting | 1 |
| Manufacturing Sector | Contracting | 1 |
For instance, in November the index fell into its first month of contraction since May 2020. Falling new orders signal that demand has weakened while contracting employment figures indicate lower output across the sector.
3. S&P 500 Index
The S&P 500 Index indicates the economy’s direction since forward-looking performance is factored into prices. In this way, the S&P 500 Index can represent investor confidence as the index often serves as a proxy for U.S. equity markets. In 2022, returns for the index are roughly -20% year-to-date.
Current Conditions: Coincident Indicators
Coincident indicators reflect the current state of the economy, showing whether it is in a state of growth or contraction.
1. GDP
GDP indicates overall economic performance. Typically it serves as the most comprehensive gauge of the economy since it tracks output across all sectors. In the third quarter of 2022, real U.S. GDP increased 2.9% on an annual basis. That compares to 2.7% for the same period in 2021.
2. Personal Income
Rising incomes indicate a healthier economy and falling incomes signal slower growth. Personal income grew at record levels in 2021 to 7.4% annually amid a rapid economic expansion.
This year, U.S. personal income has grown at a slower pace, at 2.7% on an annual basis as of the third quarter.
3. Industrial Production Index
Strongly correlated to GDP, the industrial production index indicates manufacturing, utilities, and mining output. Below, we show trends in industrial production and how they correspond with GDP and personal income indicators.
| Date | U.S. GDP | Personal Income | Industrial Production |
|---|---|---|---|
| 2022* | 7.3% | 2.7% | 4.7% |
| 2021 | 10.7% | 7.4% | 4.9% |
| 2020 | -1.5% | 6.7% | -7.0% |
| 2019 | 4.1% | 5.1% | -0.7% |
| 2018 | 5.4% | 5.0% | 3.2% |
| 2017 | 4.2% | 4.6% | 1.4% |
| 2016 | 2.7% | 2.6% | -2.0% |
| 2015 | 3.7% | 4.7% | -1.4% |
| 2014 | 4.2% | 5.5% | 3.0% |
| 2013 | 3.6% | 1.3% | 2.0% |
| 2012 | 4.2% | 5.1% | 3.0% |
| 2011 | 3.7% | 5.9% | 3.2% |
| 2010 | 3.9% | 4.3% | 5.5% |
| 2009 | -2.0% | -3.2% | -11.4% |
| 2008 | 2.0% | 3.8% | -3.5% |
| 2007 | 4.8% | 5.6% | 2.5% |
| 2006 | 6.0% | 7.5% | 2.3% |
| 2005 | 6.7% | 5.6% | 3.3% |
*As of Q3 2022.
As the above table shows, factory production collapsed following the 2008 financial crisis, a key indicator for the depth of an economic downturn. Meanwhile, personal income sank over -3% while GDP fell -2%.
Despite economic uncertainty in 2022, industrial production remains positive, at a 4.7% growth rate, albeit somewhat slower than 2021 levels.
Rearview Mirror: Lagging Indicators
Like checking your back mirror, lagging indicators take place after a key economic event, often confirming what has taken place in the economy. Here are three key examples.
1. Interest Rates
Often, interest rates respond to changes in inflation. When rates rise it can slow economic growth and discourage borrowing. Rising interest rates typically signal a strong economy and are used to tame inflation. On the other hand, low interest rates promote economic growth.
Following years of record-low interest rates, the Federal Funds rate increased at the fastest rate in decades over 2022, jumping from 0.25% in March to 4.25% in December as inflation accelerated.
2. Consumer Price Index
This inflation measure can indicate cash flow for households. Inflation is often the result of rising input costs and increasing money supply across the economy.
Sometimes, inflation can reach a peak after an expansion has ended as rising demand in an economy has pushed up prices. In November, U.S. inflation reached 7.1% annually amid supply chain disruptions and price pressures across food prices, medical prices, and housing costs.
| Year | Inflation Rate | Annual Change |
|---|---|---|
| 2022* | 7.1% | 2.4% |
| 2021 | 4.7% | 3.5% |
| 2020 | 1.2% | -0.6% |
| 2019 | 1.8% | -0.6% |
| 2018 | 2.4% | 0.3% |
| 2017 | 2.1% | 0.9% |
| 2016 | 1.3% | 1.1% |
| 2015 | 0.1% | -1.5% |
| 2014 | 1.6% | 0.2% |
| 2013 | 1.5% | -0.6% |
| 2012 | 2.1% | -1.1% |
| 2011 | 3.2% | 1.5% |
| 2010 | 1.6% | 2.0% |
| 2009 | -0.4% | -4.2% |
| 2008 | 3.8% | 1.0% |
| 2007 | 2.9% | -0.4% |
| 2006 | 3.2% | -0.2% |
| 2005 | 3.4% | 0.7% |
*As of November 2022.
3. Unemployment Rate
The unemployment rate has many spillover effects, impacting consumer spending and in turn retail sales and GDP. Historically, unemployment falls slowly after an economic recovery which is why it’s considered a lagging indicator. When the unemployment rate rises it confirms lagging economic performance.
Overall, 2022 has been characterized by a strong job market, with unemployment levels below historical averages, at 3.7% as of October.
On the Road
To get a more comprehensive picture of the economy, combining a number of indicators is more effective than isolating a few variables. With these tools, investors can gain more perspective on the cyclical nature of the business cycle while keeping a long-term perspective in mind on the road ahead.

The Top 5 Reasons Clients Fire a Financial Advisor

The Top 5 Reasons Clients Hire a Financial Advisor

Visualizing the Growth of $100, by Asset Class

How Small Investments Make a Big Impact Over Time

What Were the Top Performing Investment Themes of 2023?
-

 Infographics2 years ago
The Top Investment Quotes Every Investor Should Know
-

 Markets in a Minute2 years ago
Mapped: The Growth in U.S. House Prices by State
-

 Markets in a Minute2 years ago
How Closely Related Are Historical Mortgage Rates and Housing Prices?
-

 Infographics2 years ago
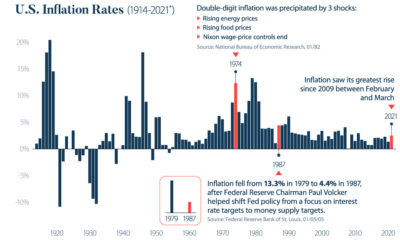
A Visual Guide to Stagflation, Inflation, and Deflation
-

 Markets in a Minute1 year ago
Mapped: Global Energy Prices, by Country in 2022
-

 Markets in a Minute2 years ago
Visualizing Historical Oil Prices (1968-2022)
-

 Infographics1 year ago
Visual Guide: The Three Types of Economic Indicators
-

 Markets in a Minute2 years ago
Mapped: Global Macroeconomic Risk, by Country in 2022
