
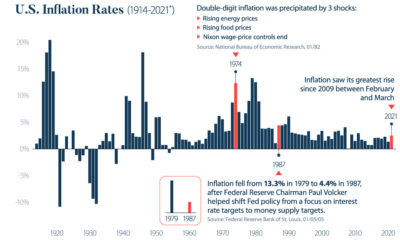
Markets in a Minute
Four Types of ESG Strategies for Investors
This infographic is available as a poster.
This infographic is available as a poster.
Four Types of ESG Strategies for Investors
In recent years, sustainable investment strategies have shown a number of benefits for investors, from resilience in market downturns to share outperformance in the long-term.
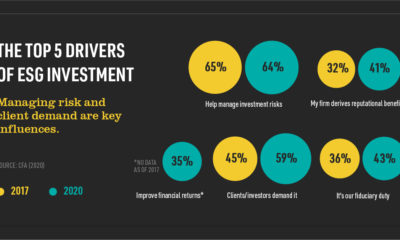
Meanwhile, investor interest has skyrocketed—with environmental, social, and governance (ESG) indexes advancing 40% between 2019 and 2020 alone. Given the increased demand for green investments, investors have an ever-expanding list of options to choose from. But what ESG approach is the right fit for you?
To answer this question, this Markets in a Minute chart from New York Life Investments looks at the primary strategies used in ESG investing to help investors choose the approach that works best for their portfolio.
What Kind of Investor are You?
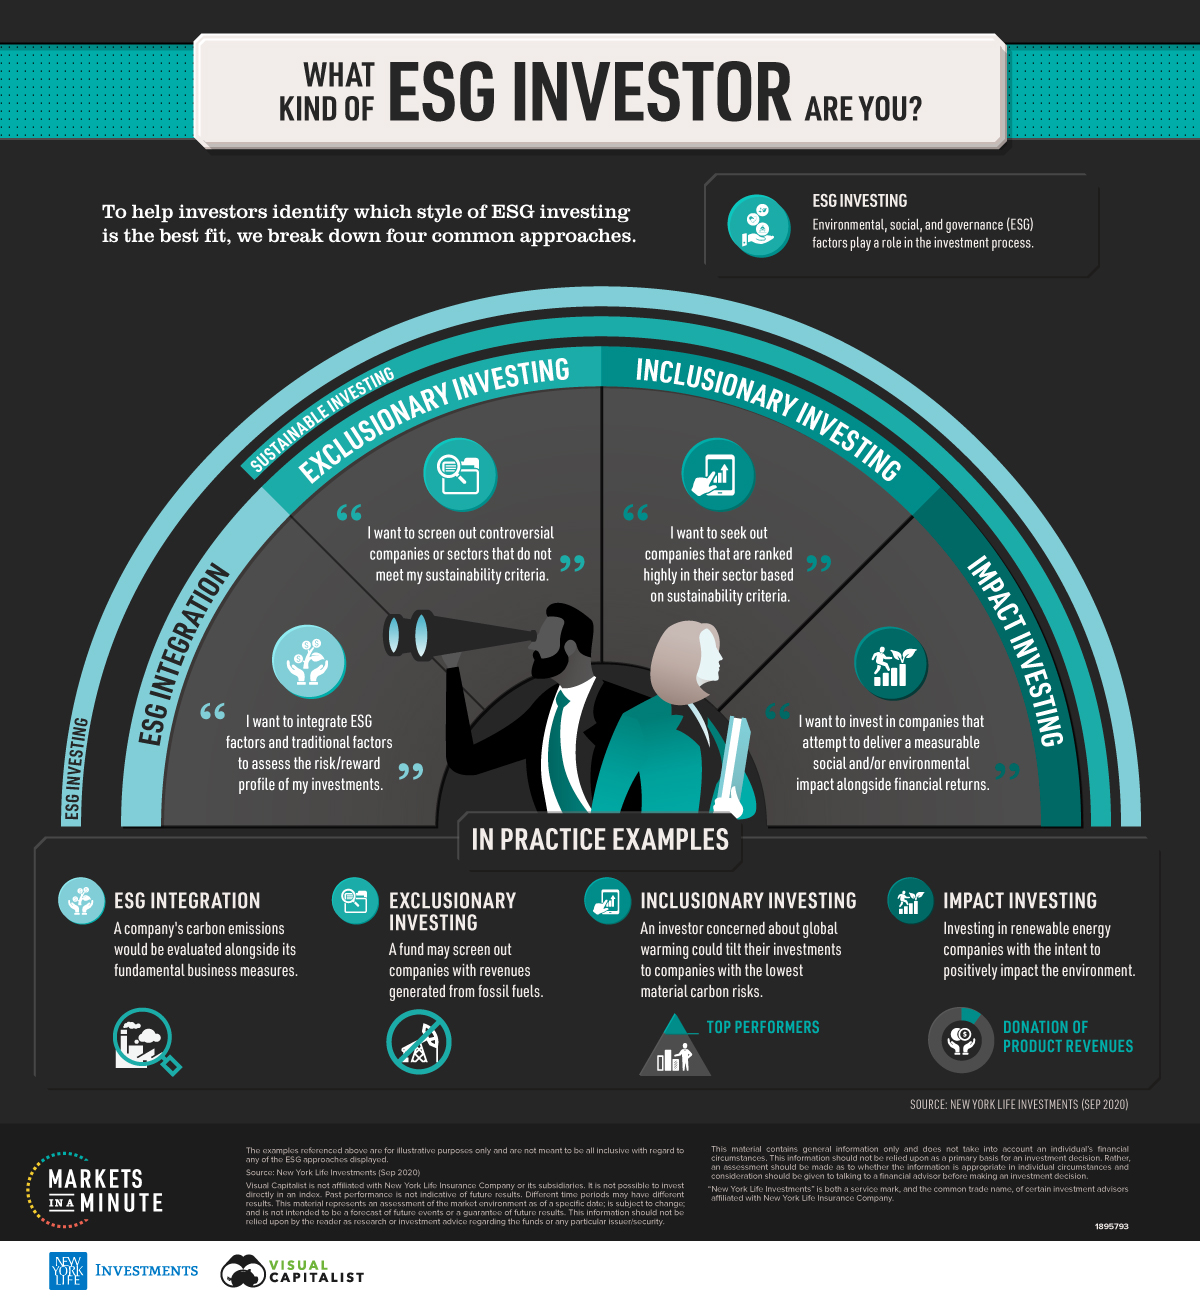
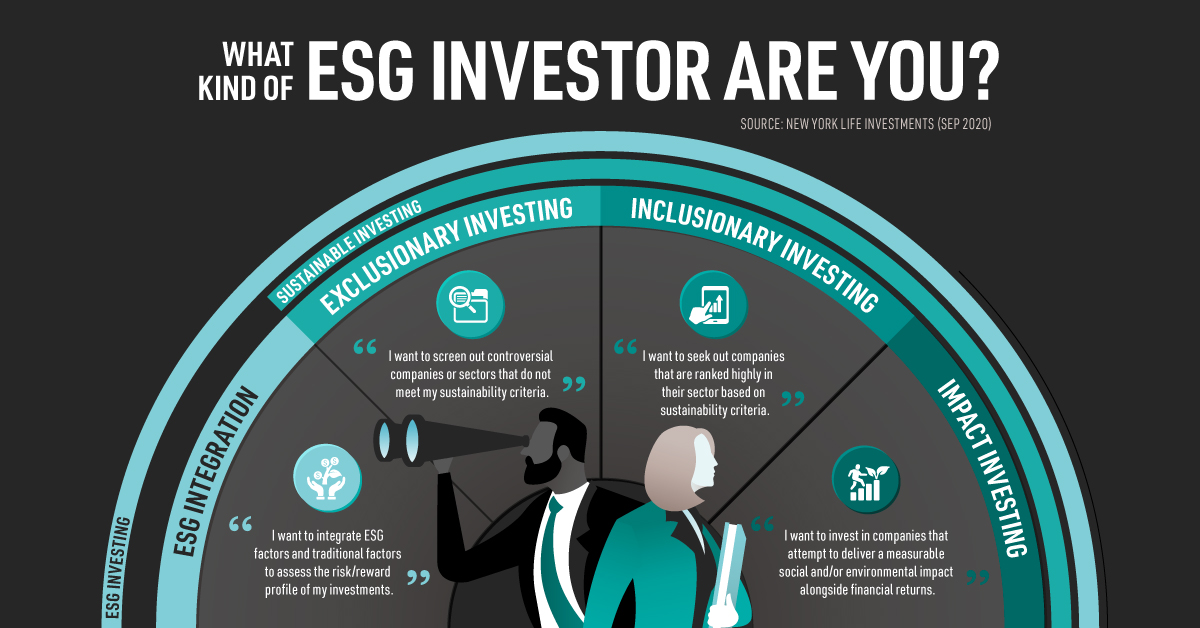
Broadly speaking, there are four main approaches to ESG investing: ESG integration, exclusionary investing, inclusionary investing, and impact investing.
1. ESG Integration
“I want to integrate ESG factors and traditional factors to assess the risk/reward profile of my investment.”
For example, using an ESG integration approach, a company’s water usage and toxic emissions would be assessed against financial factors to analyze any future risks or investment opportunities.
2. Exclusionary Investing
“I want to screen out controversial companies or sectors that do not meet my sustainability criteria.”
Using an exclusionary investing approach, an investor may screen out companies whose revenues are from tobacco, gambling, or fossil fuels.
Related ESG Terms:
- Negative Screening
- Negative Selection
- Socially Responsible Investing (SRI)
3. Inclusionary Investing
“I want to seek out companies that are ranked highly in their sector based on sustainability criteria.”
With an inclusionary approach, a fund may include the leading companies in a sector, relative to their peers, such as the top performing tech companies in ESG.
Related ESG Terms:
- Positive Screening
- Positive Selection
- Best-In-Class
- Positive Tilt
- Thematic Investing
4. Impact Investing
“I want to invest in companies that attempt to deliver a measurable social and/or environmental impact alongside financial returns.”
Lastly, impact investing approaches may focus specifically on renewable energy companies that have the intent to make a positive environmental impact.
Related ESG Terms:
- Goal-Based Investing
- Thematic Investing
ESG Investing Strategies, By Market
How does interest in ESG strategies vary according to geographical region? Overall, interest has increased across all regions globally (where data was available).
| Interest in ESG By Market* | 2018 | 2020 |
|---|---|---|
| India | 98% | 100% |
| Mainland China | 95% | 98% |
| UAE | 90% | 94% |
| Mexico | N/A | 92% |
| France | 79% | 91% |
| Brazil | 82% | 90% |
| Japan | N/A | 88% |
| Hong Kong, SAR China | 71% | 86% |
| South Africa | N/A | 83% |
| Germany | 64% | 81% |
| Singapore | 77% | 78% |
| United Kingdom | 51% | 77% |
| Canada | 49% | 68% |
| Australia | 49% | 65% |
| U.S. | 49% | 57% |
*With interest in these strategies and already employing them
Source: CFA Institute (Dec, 2020)
At the top was India, where 100% of respondents expressed interest or were already using ESG strategies—up from 96% in 2018.
In fact, India developed National Voluntary Guidelines on Social, Environmental, and Economic Responsibilities of Business as far back as 2011. This was designed as a guideline for responsible business conduct, which later aligned to the UN Sustainable Development Goals in 2016.
Following closely behind were investors in China (98%) and UAE (94%).
By contrast, 57% of investors in the U.S. employed ESG strategies—the lowest among geographic regions. Despite this, in the last two years, this figure jumped 8%, and it may rise higher yet given U.S. president Joe Biden’s new climate priorities. Electric grid and clean energy, decarbonization, and electric vehicle incentives all fall under a massive $2 trillion infrastructure plan, which will likely have a significant impact on the dialogue surrounding ESG.
Going Green
As the global drive for ESG investment continues to rise, investors can harness a greater understanding of different ESG strategies to meet their personal objectives—whether it is risk/reward analysis, seeking out ESG top performers, or a measurable environmental impact.


Markets in a Minute
The Top 5 Reasons Clients Fire a Financial Advisor
Firing an advisor is often driven by more than cost and performance factors. Here are the top reasons clients ‘break up’ with their advisors.

The Top 5 Reasons Clients Fire a Financial Advisor
What drives investors to fire a financial advisor?
From saving for a down payment to planning for retirement, clients turn to advisors to guide them through life’s complex financial decisions. However, many of the key reasons for firing a financial advisor stem from emotional factors, and go beyond purely financial motivations.
We partnered with Morningstar to show the top reasons clients fire an advisor to provide insight on what’s driving investor behavior.
What Drives Firing Decisions?
Here are the top reasons clients terminated their advisor, based on a survey of 184 respondents:
| Reason for Firing | % of Respondents Citing This Reason | Type of Motivation |
|---|---|---|
| Quality of financial advice and services | 32% | Emotion-based reason |
| Quality of relationship | 21% | Emotion-based reason |
| Cost of services | 17% | Financial-based reason |
| Return performance | 11% | Financial-based reason |
| Comfort handling financial issues on their own | 10% | Emotion-based reason |
Numbers may not total 100 due to rounding. Respondents could select more than one answer.
Numbers may not total 100 due to rounding. Respondents could select more than one answer.
While firing an advisor is rare, many of the primary drivers behind firing decisions are also emotionally driven.
Often, advisors were fired due to the quality of the relationship. In many cases, this was due to an advisor not dedicating enough time to fully grasp their personal financial goals. Additionally, wealthier, and more financially literate clients are more likely to fire their advisors—highlighting the importance of understanding the client.
Key Takeaways
Given these driving factors, here are five ways that advisors can build a lasting relationship through recognizing their clients’ emotional needs:
- Understand your clients’ deeper goals
- Reach out proactively
- Act as a financial coach
- Keep clients updated
- Conduct goal-setting exercises on a regular basis
By communicating their value and setting expectations early, advisors can help prevent setbacks in their practice by adeptly recognizing the emotional motivators of their clients.
Markets in a Minute
The Top 5 Reasons Clients Hire a Financial Advisor
Here are the most common drivers for hiring a financial advisor, revealing that investor motivations go beyond just financial factors.

The Top 5 Reasons Clients Hire a Financial Advisor
What drives investors to hire a financial advisor?
From saving for a down payment to planning for retirement, clients turn to advisors to guide them through life’s complex financial decisions. However, many of the key reasons for hiring a financial advisor stem from emotional factors, and go beyond purely financial motivations.
We partnered with Morningstar to show the top reasons clients hire a financial advisor to provide insight on what’s driving investor behavior.
What Drives Hiring Decisions?
Here are the most common reasons for hiring an advisor, based on a survey of 312 respondents.
| Reason for Hiring | % of Respondents Citing This Reason | Type of Motivation |
|---|---|---|
| Specific goals or needs | 32% | Financial-based reason |
| Discomfort handling finances | 32% | Emotion-based reason |
| Behavioral coaching | 17% | Emotion-based reason |
| Recommended by family or friends | 12% | Emotion-based reason |
| Quality of relationship | 10% | Emotion-based reason |
Numbers may not total 100 due to rounding. Respondents could select more than one answer.
While financial factors played an important role in hiring decisions, emotional reasons made up the largest share of total responses.
This illustrates that clients place a high degree of importance on reaching specific goals or needs, and how an advisor communicates with them. Furthermore, clients seek out advisors for behavioral coaching to help them make informed decisions while staying the course.
Key Takeaways
With this in mind, here are five ways advisors can provide value to their clients and grow their practice:
- Address clients’ emotional needs early on
- Demonstrate how you can offer support
- Use ordinary language
- Provide education to help clients stay on track
- Acknowledge that these are issues we all face
By addressing emotional factors, advisors can more effectively help clients’ navigate intricate financial decisions and avoid common behavioral mistakes.

The Top 5 Reasons Clients Fire a Financial Advisor

The Top 5 Reasons Clients Hire a Financial Advisor

Visualizing the Growth of $100, by Asset Class

How Small Investments Make a Big Impact Over Time

What Were the Top Performing Investment Themes of 2023?
-

 Infographics2 years ago
The Top Investment Quotes Every Investor Should Know
-

 Markets in a Minute2 years ago
Mapped: The Growth in U.S. House Prices by State
-

 Markets in a Minute2 years ago
How Closely Related Are Historical Mortgage Rates and Housing Prices?
-

 Infographics2 years ago
A Visual Guide to Stagflation, Inflation, and Deflation
-

 Markets in a Minute1 year ago
Mapped: Global Energy Prices, by Country in 2022
-

 Infographics3 years ago
The 5 Fastest Growing Industries of the Next Decade
-

 Markets in a Minute2 years ago
Visualizing Historical Oil Prices (1968-2022)
-

 Infographics1 year ago
Visual Guide: The Three Types of Economic Indicators
