
Markets in a Minute
Mapped: Inflation Forecasts by Country in 2022
This infographic is available as a poster.
This infographic is available as a poster.
Mapped: Inflation Forecasts by Country in 2022
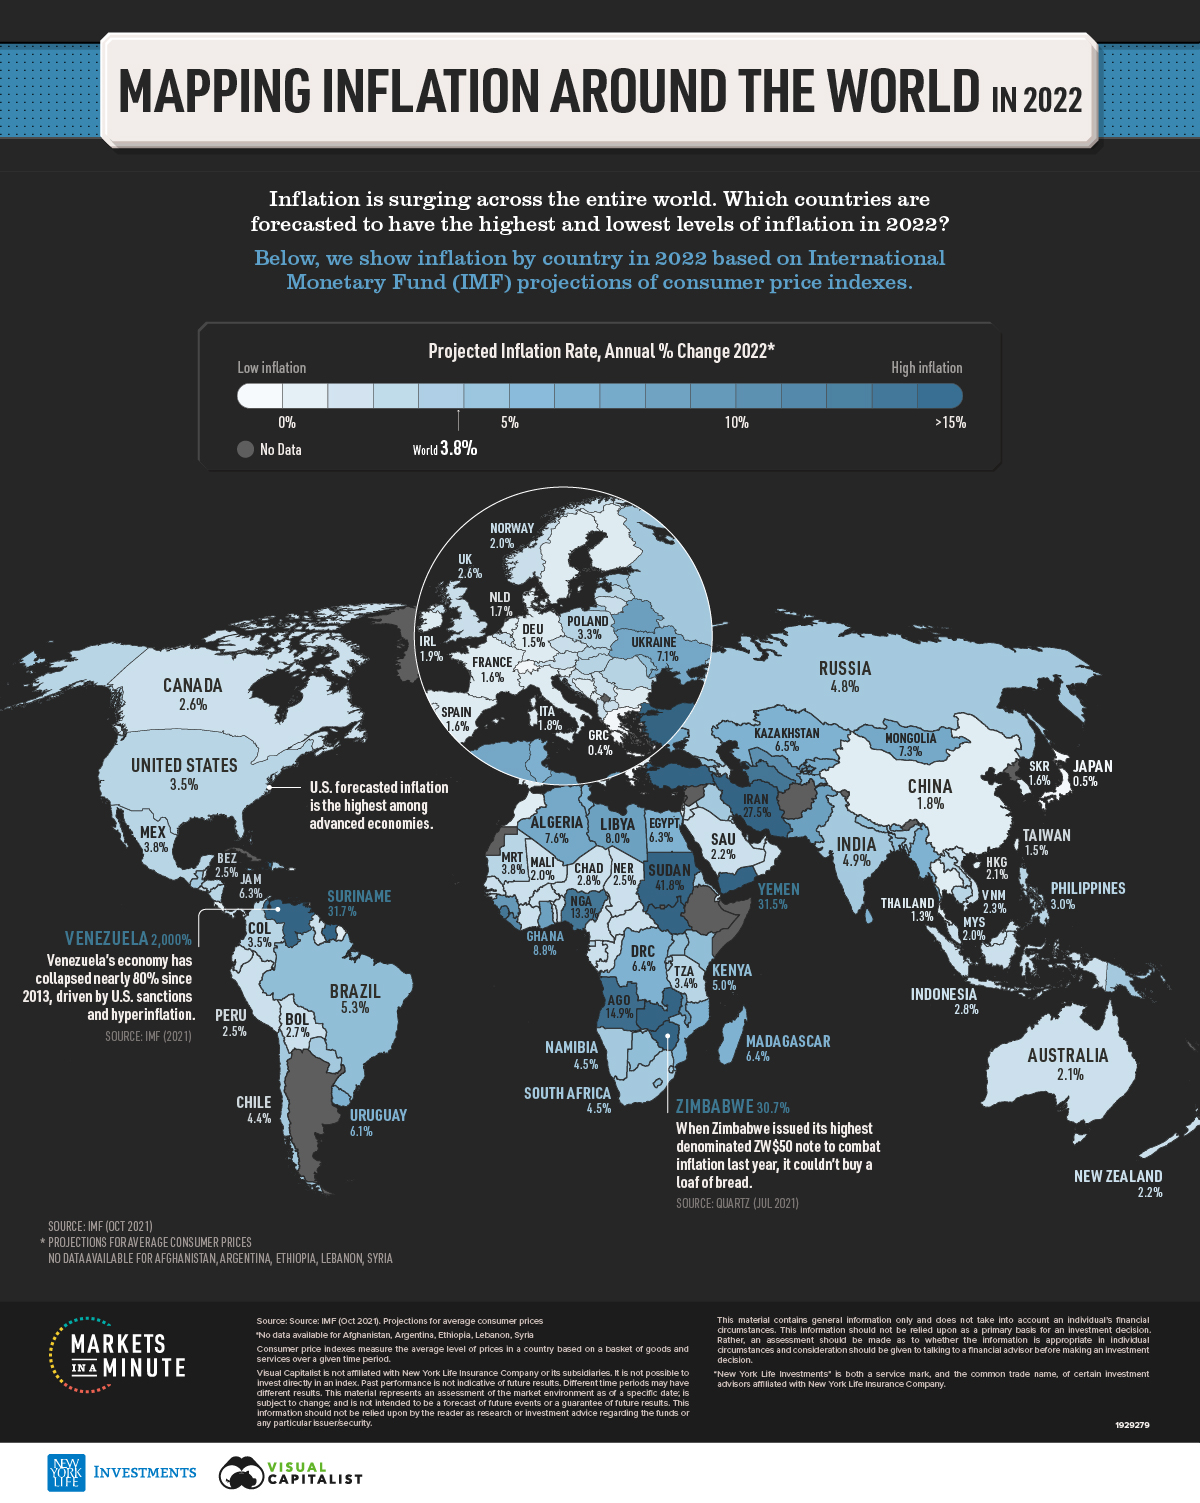
What will inflation look like in 2022?
Today, this is a question on many investors’ minds. Across several countries, inflation has hit its highest level in decades. Supply shortages and massive monetary stimulus have contributed to increasing consumer prices. Asset prices, including houses, have also risen significantly.
In this Markets in a Minute from New York Life Investments we show inflation by country in 2022 according to IMF projections.
Inflation by Country in 2022
Inflation rates are based on the annual percentage change in average consumer prices. This measures the average level of prices in a country based on a basket of goods and services over a given time period.
Here are forecasted inflation rates for the largest economies worldwide, and how they compare to pre-pandemic levels:
| Inflation Rate, Average Consumer Prices (Annual % Change) | 2019 | 2022 |
|---|---|---|
| 🇺🇸 United States | 1.5% | 3.5% |
| 🇨🇳 China | 2.9% | 1.8% |
| 🇯🇵 Japan | 0.5% | 0.5% |
| 🇩🇪 Germany | 1.4% | 1.5% |
| 🇬🇧 United Kingdom | 1.8% | 2.6% |
| 🇮🇳 India | 4.8% | 4.9% |
| 🇫🇷 France | 1.3% | 1.6% |
| 🇮🇹 Italy | 0.6% | 1.8% |
| 🇨🇦 Canada | 1.9% | 2.6% |
| 🇰🇷 South Korea | 0.4% | 1.6% |
| 🇷🇺 Russia | 4.5% | 4.8% |
| 🇧🇷 Brazil | 3.7% | 5.3% |
| 🇦🇺 Australia | 1.6% | 2.1% |
| 🇪🇸 Spain | 0.7% | 1.6% |
| 🇲🇽 Mexico | 3.6% | 3.8% |
| 🇮🇩 Indonesia | 2.8% | 2.8% |
| 🇮🇷 Iran | 34.6% | 27.5% |
| 🇳🇱 Netherlands | 2.7% | 1.7% |
| 🇸🇦 Saudi Arabia | -2.1% | 2.2% |
| 🇨🇭 Switzerland | 0.4% | 0.6% |
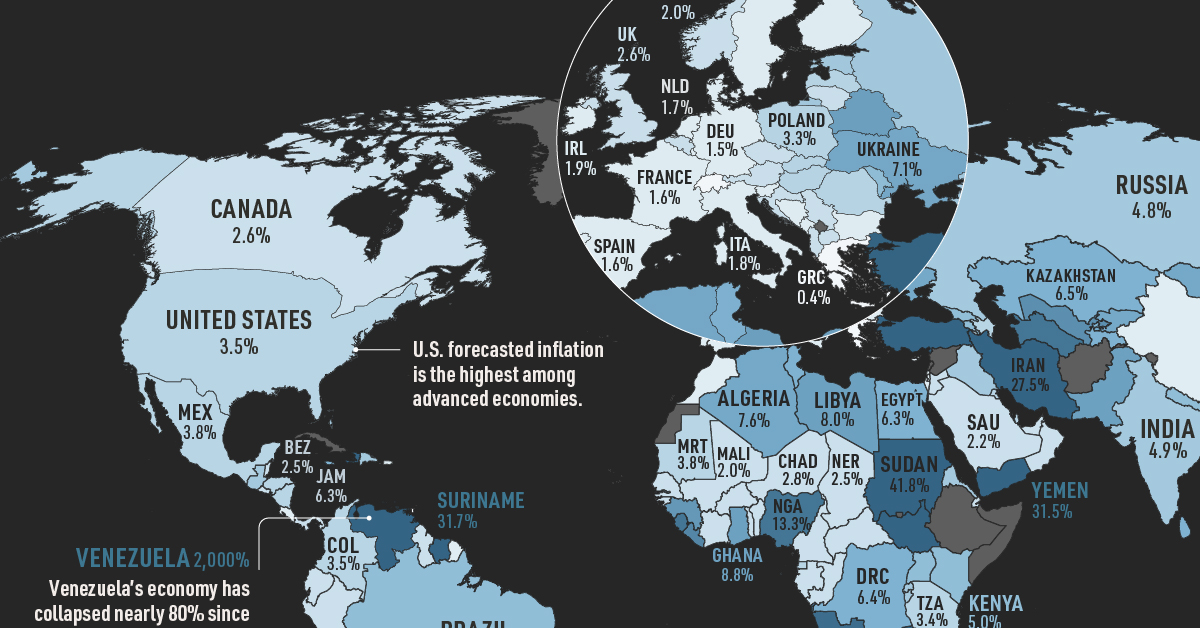
With the highest rate across advanced economies, the U.S. could see inflation at 3.5% in 2022. Over the last two years, the U.S. central bank has doubled the assets on its balance sheet, which stand at roughly 27% of GDP.
Inflation rates tell a different story in China. Rates are forecasted to fall below pre-pandemic levels, reaching 1.8%. In fact, across East Asia, prices have been largely immune to inflationary pressures, but this could change in 2022.
While inflation is rising in Europe, it’s at roughly half the rate as the U.S., with Germany, France, and Italy projected to see inflation rates below 2%. However, the UK is an outlier, with inflation set to reach 2.6%.
What Are the Effects of Inflation?
What is driving inflation around advanced economies?
In the U.S., energy prices rose over 29% between 2020 and 2021. Meanwhile, food costs have increased 6.5%, driven by labor shortages, domestic demand, rising cost of feed and other inputs.
Looking forward, Kraft Heinz, General Mills, Starbucks and several other corporations have announced price hikes in 2022.
| Consumer Price Inflation (Annual % Change 2020-2021) | Energy | Food | All Items |
|---|---|---|---|
| 🇺🇸 United States | 29.3% | 6.5% | 7.0% |
| 🇯🇵 Japan | 16.4% | 2.6% | 0.8% |
| 🇩🇪 Germany | 18.3% | 5.9% | 5.3% |
| 🇬🇧 United Kingdom | 24.5% | 4.2% | 4.8% |
| 🇫🇷 France | 19.6% | 1.4% | 2.8% |
| 🇮🇹 Italy | 29.4% | 2.9% | 3.9% |
| 🇨🇦 Canada | 21.2% | 5.7% | 4.8% |
Source: Refinitiv, OECD
In Japan, businesses are taking a different approach. Instead of input costs passing on to consumers, companies are absorbing the costs to avoid the risk of losing business. For instance, when Kikkoman announced 4-10% increases in 2021, it made national news.
This has been a typical practice for decades amid low growth, stagnant wages, and a deflationary environment.
Highest Inflation by Country in 2022
Venezuela is the highest in the world, with a forecasted 2,000% rise in inflation.
Since October, the central bank has been printing as many as $100 million bolívars per week to help stabilize the exchange rate against the U.S. dollar. Hyperinflation has run rampant since 2017, with U.S oil sanctions adding significant challenges to the economy.
These bans on Venezuelan exports have caused damaging economic impacts and instability.
| Inflation Rate, Average Consumer Prices (Annual % Change) | 2019 | 2022 |
|---|---|---|
| 🇻🇪 Venezuela | 19,906% | 2,000% |
| 🇸🇩 Sudan | 51.0% | 41.8% |
| 🇸🇷 Suriname | 4.4% | 31.7% |
| 🇾🇪 Yemen | 12.0% | 31.5% |
| 🇿🇼 Zimbabwe | 255.3% | 30.7% |
| 🇮🇷 Iran | 34.6% | 27.5% |
| 🇸🇸 South Sudan | 51.2% | 24.0% |
| 🇿🇲 Zambia | 9.2% | 19.2% |
| 🇭🇹 Haiti | 17.3% | 15.5% |
| 🇹🇷 Turkey | 15.2% | 15.4% |
| 🇦🇴 Angola | 17.1% | 14.9% |
| 🇳🇬 Nigeria | 11.4% | 13.3% |
| 🇸🇱 Sierra Leone | 14.8% | 13.3% |
| 🇹🇲 Turkmenistan | 5.1% | 13.0% |
| 🇱🇷 Liberia | 27.0% | 11.8% |
| 🇺🇿 Uzbekistan | 14.5% | 10.9% |
| 🇬🇳 Guinea | 9.5% | 9.9% |
| 🇲🇼 Malawi | 9.4% | 9.0% |
| 🇬🇭 Ghana | 7.1% | 8.8% |
| 🇵🇰 Pakistan | 6.7% | 8.5% |
| 🇧🇾 Belarus | 5.6% | 8.3% |
| 🇱🇾 Libya | 0.2% | 8.0% |
| 🇰🇬 Kyrgyz Republic | 1.1% | 7.8% |
| 🇸🇹 São Tomé and Príncipe | 7.7% | 7.8% |
| 🇩🇿 Algeria | 2.0% | 7.6% |
| 🇲🇳 Mongolia | 7.3% | 7.3% |
| 🇺🇦 Ukraine | 7.9% | 7.1% |
| 🇧🇹 Bhutan | 2.8% | 6.9% |
| 🇲🇺 Mauritius | 0.5% | 6.6% |
| 🇰🇿 Kazakhstan | 5.2% | 6.5% |
| 🇲🇲 Myanmar | 8.6% | 6.5% |
| 🇹🇯 Tajikistan | 7.8% | 6.5% |
| 🇹🇳 Tunisia | 6.7% | 6.5% |
| 🇨🇩 DRC | 4.7% | 6.4% |
| 🇲🇬 Madagascar | 5.6% | 6.4% |
| 🇲🇿 Mozambique | 2.8% | 6.4% |
| 🇪🇬 Egypt | 13.9% | 6.3% |
| 🇬🇲 Gambia | 7.1% | 6.3% |
| 🇯🇲 Jamaica | 3.9% | 6.3% |
| 🇱🇰 Sri Lanka | 4.3% | 6.2% |
| 🇺🇾 Uruguay | 7.9% | 6.1% |
| 🇦🇲 Armenia | 1.4% | 5.8% |
| 🇲🇩 Moldova | 4.3% | 5.8% |
| 🇧🇩 Bangladesh | 5.5% | 5.7% |
| 🇳🇵 Nepal | 4.6% | 5.7% |
| 🇬🇪 Georgia | 4.9% | 5.4% |
| 🇧🇷 Brazil | 3.7% | 5.3% |
| 🇱🇸 Lesotho | 5.2% | 5.3% |
| 🇧🇼 Botswana | 2.7% | 5.0% |
| World | 3.5% | 3.8% |
Like Venezuela, Iran faces high inflation, compounded by 960 U.S. sanctions. In addition, the country has been cut off from the international banking messaging system, SWIFT, to increase pressure on nuclear negotiations.
What this means is that Iranian banks can’t pay for exports or receive payment for imports.
Lowest Inflation by Country in 2022
On the other hand, Saint Kitts and Nevis is the only country projected to have negative inflation in 2022, at -0.5%. Not only that, disinflation is projected to increase from pre-pandemics levels.
| Inflation Rate, Average Consumer Prices (Annual % Change) | 2019 | 2022 |
|---|---|---|
| 🇰🇳 Saint Kitts and Nevis | -0.3% | -0.5% |
| 🇹🇹 Trinidad and Tobago | 1.0% | 0.0% |
| 🇬🇷 Greece | 0.5% | 0.4% |
| 🇯🇵 Japan | 0.5% | 0.5% |
| 🇬🇩 Grenada | 0.6% | 0.6% |
| 🇨🇭 Switzerland | 0.4% | 0.6% |
| 🇸🇲 San Marino | 1.0% | 0.9% |
| 🇨🇾 Cyprus | 0.6% | 1.0% |
| 🇵🇼 Palau | 0.6% | 1.0% |
| 🇰🇲 Comoros | 3.7% | 1.2% |
| 🇲🇦 Morocco | 0.2% | 1.2% |
| 🇵🇹 Portugal | 0.3% | 1.3% |
| 🇹🇭 Thailand | 0.7% | 1.3% |
| 🇱🇺 Luxembourg | 1.7% | 1.4% |
| 🇦🇩 Andorra | 0.7% | 1.5% |
| 🇧🇳 Brunei Darussalam | -0.4% | 1.5% |
| 🇨🇷 Costa Rica | 2.1% | 1.5% |
| 🇩🇪 Germany | 1.4% | 1.5% |
| 🇲🇪 Montenegro | 0.4% | 1.5% |
| 🇸🇬 Singapore | 0.6% | 1.5% |
| 🇹🇼 Taiwan | 0.5% | 1.5% |
| 🇨🇻 Cabo Verde | 1.1% | 1.6% |
| 🇩🇰 Denmark | 0.7% | 1.6% |
| 🇫🇮 Finland | 1.1% | 1.6% |
| 🇫🇷 France | 1.3% | 1.6% |
| 🇰🇷 South Korea | 0.4% | 1.6% |
| 🇲🇭 Marshall Islands | -0.5% | 1.6% |
| 🇪🇸 Spain | 0.7% | 1.6% |
| 🇸🇪 Sweden | 1.7% | 1.6% |
| 🇦🇼 Aruba | 3.9% | 1.7% |
| 🇫🇯 Fiji | 1.8% | 1.7% |
| 🇳🇱 Netherlands | 2.7% | 1.7% |
| 🇧🇦 Bosnia and Herzegovina | 0.6% | 1.8% |
| 🇨🇳 China | 2.9% | 1.8% |
| 🇮🇱 Israel | 0.8% | 1.8% |
| 🇮🇹 Italy | 0.6% | 1.8% |
| 🇲🇹 Malta | 1.5% | 1.8% |
| 🇸🇮 Slovenia | 1.6% | 1.8% |
| 🇧🇬 Bulgaria | 2.5% | 1.9% |
| 🇮🇪 Ireland | 0.9% | 1.9% |
| 🇵🇷 Puerto Rico | 0.1% | 1.9% |
| 🇦🇬 Antigua and Barbuda | 1.4% | 2.0% |
| 🇧🇯 Benin | -0.9% | 2.0% |
| 🇨🇲 Cameroon | 2.5% | 2.0% |
| 🇭🇷 Croatia | 0.8% | 2.0% |
| 🇩🇯 Djibouti | 3.3% | 2.0% |
| 🇩🇲 Dominica | 1.5% | 2.0% |
| 🇬🇦 Gabon | 2.0% | 2.0% |
| 🇬🇼 Guinea-Bissau | 0.3% | 2.0% |
| 🇳🇴 Norway | 2.2% | 2.0% |
Greece, Japan, and Switzerland all are forecasted to see inflation fall below 1%. Suppressed demand and low national economic output are factors behind low inflation rates in Greece, which has led to downward pressures on inflation.
The Future of Inflation Worldwide
A combination of factors unique to COVID-19 have pushed inflation to multi-decade highs. But will inflation eventually fade over time?
For many countries, the IMF forecasts that it will. By 2025, U.S. inflation is projected to reach 2.5%, while many advanced countries could see rates at or below the 2% target often set by central banks.
| Inflation Rate, Average Consumer Prices (Annual % Change) | 2022 | 2025E |
|---|---|---|
| 🇺🇸 United States | 3.5% | 2.5% |
| 🇨🇳 China | 1.8% | 2.0% |
| 🇯🇵 Japan | 0.5% | 1.0% |
| 🇩🇪 Germany | 1.5% | 1.8% |
| 🇬🇧 United Kingdom | 2.6% | 2.0% |
| 🇮🇳 India | 4.9% | 4.0% |
| 🇫🇷 France | 1.6% | 1.2% |
| 🇮🇹 Italy | 1.8% | 1.3% |
| 🇨🇦 Canada | 2.6% | 2.1% |
| 🇰🇷 South Korea | 1.6% | 2.0% |
| 🇷🇺 Russia | 4.8% | 4.0% |
| 🇧🇷 Brazil | 5.3% | 3.1% |
| 🇦🇺 Australia | 2.1% | 2.4% |
| 🇪🇸 Spain | 1.6% | 1.7% |
| 🇲🇽 Mexico | 3.8% | 3.0% |
| 🇮🇩 Indonesia | 2.8% | 3.0% |
| 🇮🇷 Iran | 27.5% | 25.0% |
| 🇳🇱 Netherlands | 1.7% | 1.9% |
| 🇸🇦 Saudi Arabia | 2.2% | 2.0% |
| 🇨🇭 Switzerland | 0.6% | 1.0% |
Structural forces that began to take hold in the 1980s have led to declining inflation rates for many years. These forces are not likely going away. Globalization is unlikely to stop and slowing energy demand may cause energy prices to level off.
In addition, as vaccination rates increase and more people enter the workforce, spending could move towards services, lessening the price pressures on goods. Central banks around the world have already started tightening monetary policy and stimulus measures, such as tapering bond purchases, which could help lower inflation.
As countries brace for higher inflation in the short-term, the long-term view may return to pre-pandemic trends.


Markets in a Minute
The Top 5 Reasons Clients Fire a Financial Advisor
Firing an advisor is often driven by more than cost and performance factors. Here are the top reasons clients ‘break up’ with their advisors.

The Top 5 Reasons Clients Fire a Financial Advisor
What drives investors to fire a financial advisor?
From saving for a down payment to planning for retirement, clients turn to advisors to guide them through life’s complex financial decisions. However, many of the key reasons for firing a financial advisor stem from emotional factors, and go beyond purely financial motivations.
We partnered with Morningstar to show the top reasons clients fire an advisor to provide insight on what’s driving investor behavior.
What Drives Firing Decisions?
Here are the top reasons clients terminated their advisor, based on a survey of 184 respondents:
| Reason for Firing | % of Respondents Citing This Reason | Type of Motivation |
|---|---|---|
| Quality of financial advice and services | 32% | Emotion-based reason |
| Quality of relationship | 21% | Emotion-based reason |
| Cost of services | 17% | Financial-based reason |
| Return performance | 11% | Financial-based reason |
| Comfort handling financial issues on their own | 10% | Emotion-based reason |
Numbers may not total 100 due to rounding. Respondents could select more than one answer.
Numbers may not total 100 due to rounding. Respondents could select more than one answer.
While firing an advisor is rare, many of the primary drivers behind firing decisions are also emotionally driven.
Often, advisors were fired due to the quality of the relationship. In many cases, this was due to an advisor not dedicating enough time to fully grasp their personal financial goals. Additionally, wealthier, and more financially literate clients are more likely to fire their advisors—highlighting the importance of understanding the client.
Key Takeaways
Given these driving factors, here are five ways that advisors can build a lasting relationship through recognizing their clients’ emotional needs:
- Understand your clients’ deeper goals
- Reach out proactively
- Act as a financial coach
- Keep clients updated
- Conduct goal-setting exercises on a regular basis
By communicating their value and setting expectations early, advisors can help prevent setbacks in their practice by adeptly recognizing the emotional motivators of their clients.
Markets in a Minute
The Top 5 Reasons Clients Hire a Financial Advisor
Here are the most common drivers for hiring a financial advisor, revealing that investor motivations go beyond just financial factors.

The Top 5 Reasons Clients Hire a Financial Advisor
What drives investors to hire a financial advisor?
From saving for a down payment to planning for retirement, clients turn to advisors to guide them through life’s complex financial decisions. However, many of the key reasons for hiring a financial advisor stem from emotional factors, and go beyond purely financial motivations.
We partnered with Morningstar to show the top reasons clients hire a financial advisor to provide insight on what’s driving investor behavior.
What Drives Hiring Decisions?
Here are the most common reasons for hiring an advisor, based on a survey of 312 respondents.
| Reason for Hiring | % of Respondents Citing This Reason | Type of Motivation |
|---|---|---|
| Specific goals or needs | 32% | Financial-based reason |
| Discomfort handling finances | 32% | Emotion-based reason |
| Behavioral coaching | 17% | Emotion-based reason |
| Recommended by family or friends | 12% | Emotion-based reason |
| Quality of relationship | 10% | Emotion-based reason |
Numbers may not total 100 due to rounding. Respondents could select more than one answer.
While financial factors played an important role in hiring decisions, emotional reasons made up the largest share of total responses.
This illustrates that clients place a high degree of importance on reaching specific goals or needs, and how an advisor communicates with them. Furthermore, clients seek out advisors for behavioral coaching to help them make informed decisions while staying the course.
Key Takeaways
With this in mind, here are five ways advisors can provide value to their clients and grow their practice:
- Address clients’ emotional needs early on
- Demonstrate how you can offer support
- Use ordinary language
- Provide education to help clients stay on track
- Acknowledge that these are issues we all face
By addressing emotional factors, advisors can more effectively help clients’ navigate intricate financial decisions and avoid common behavioral mistakes.

The Top 5 Reasons Clients Fire a Financial Advisor

The Top 5 Reasons Clients Hire a Financial Advisor

Visualizing the Growth of $100, by Asset Class

How Small Investments Make a Big Impact Over Time

What Were the Top Performing Investment Themes of 2023?
-

 Infographics2 years ago
The Top Investment Quotes Every Investor Should Know
-

 Markets in a Minute2 years ago
Mapped: The Growth in U.S. House Prices by State
-

 Markets in a Minute2 years ago
How Closely Related Are Historical Mortgage Rates and Housing Prices?
-

 Infographics2 years ago
A Visual Guide to Stagflation, Inflation, and Deflation
-

 Markets in a Minute1 year ago
Mapped: Global Energy Prices, by Country in 2022
-

 Infographics3 years ago
The 5 Fastest Growing Industries of the Next Decade
-

 Markets in a Minute2 years ago
Visualizing Historical Oil Prices (1968-2022)
-

 Infographics1 year ago
Visual Guide: The Three Types of Economic Indicators
