
Markets in a Minute
Explainer: A Visual Introduction to Fed Tapering
View the high resolution version of this graphic. Buy the poster.
Explainer: A Visual Introduction to Fed Tapering
View the high resolution version of this graphic. Buy the poster.
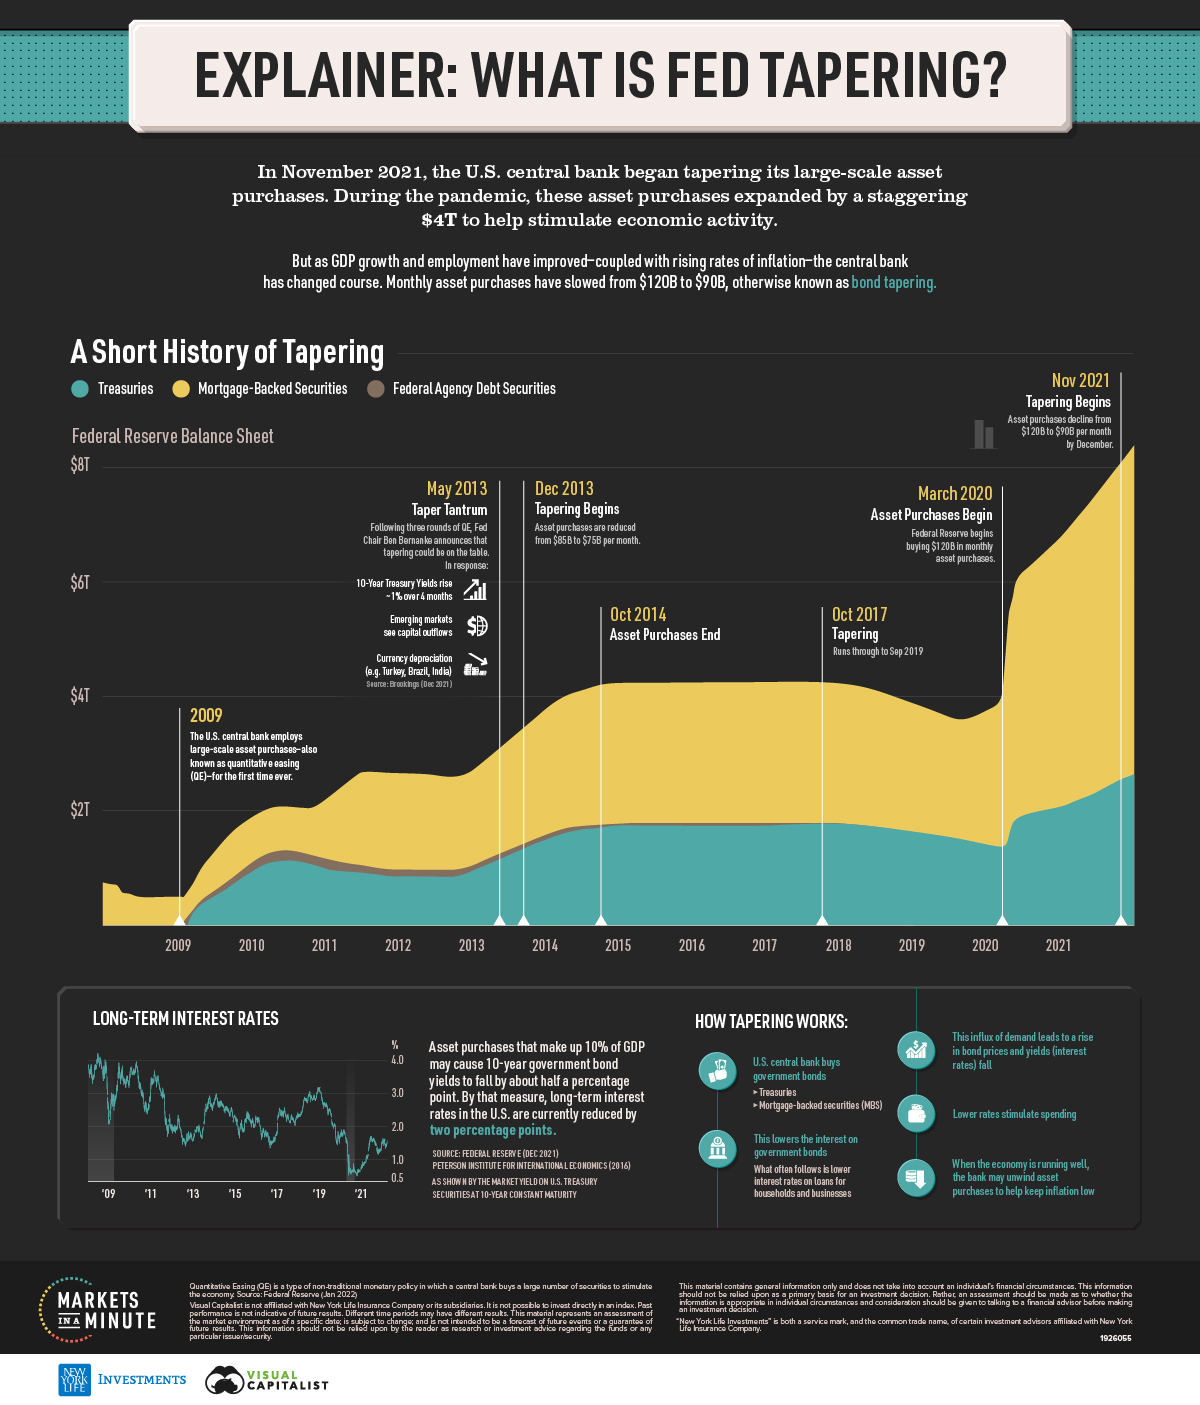
The Federal Reserve began tapering its large-scale asset purchases in November 2021, a move likely influenced by:
- Rising inflation
- Improving unemployment
- Strong U.S. GDP growth
More than $4 trillion in capital was injected into the economy through quantitative easing (QE), over the course of the pandemic, inflation is at 40-year highs, and unemployment levels hover below 4%.
As Fed policy responds to a recovering U.S. economy, this Markets in a Minute chart from New York Life Investments shows how Fed tapering works, and its impact on the economy.
How Fed Tapering Works
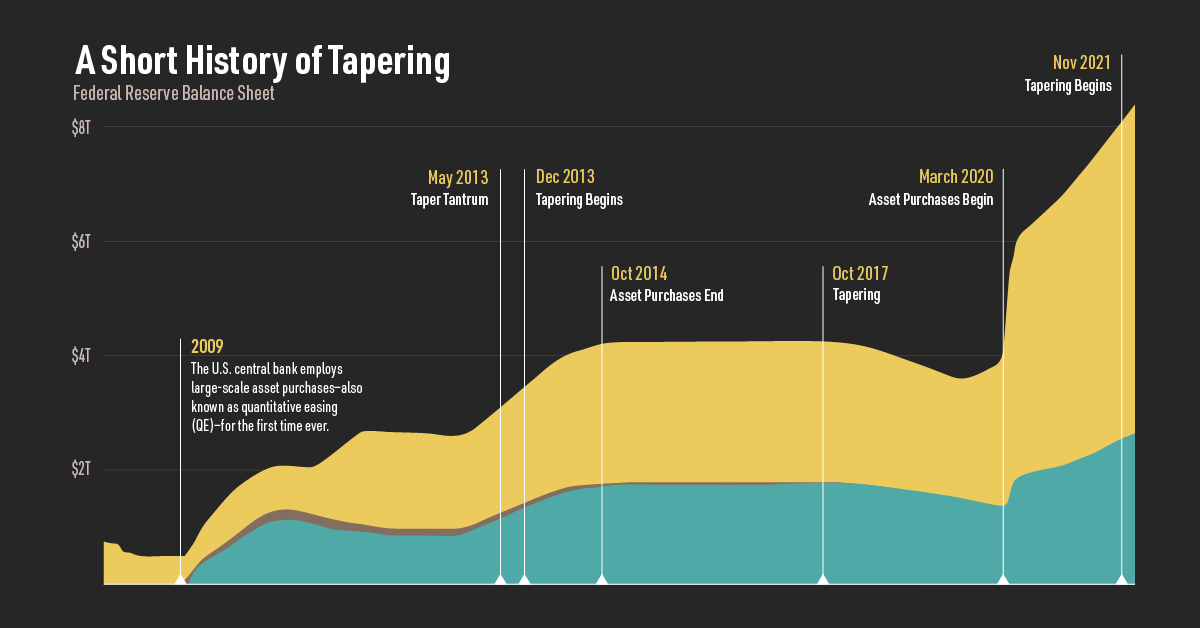
Fed tapering is the unwinding of the Federal Reserve’s large-scale asset purchases.
After the 2008 financial crisis, large scale asset purchases were introduced for the first time to inject liquidity into the market and help restore confidence. During the pandemic, they were introduced once more, at a rate of $120 billion per month.
Here’s how it works:
- The U.S. central bank buys government bonds typically in the form of Treasuries and mortgage-backed securities (MBS).
- This influx of demand leads to a rise in these bond prices and their yields (interest rates) fall.
- As this lowers the interest rate on the government bonds, what often follows is lower interest rates on loans for households and businesses.
- Lower rates stimulate spending.
- When the economy is running well, the bank may unwind asset purchases to help keep inflation low, otherwise known as Fed tapering.
Notably, Fed tapering and QE is hotly debated among economists. Those in favor say QE is a critical tool for stimulating the economy. Those against say that it inflates asset prices and contributes to inequality.
Inflation Levels
The consumer price index (CPI) rose 7% in December, the highest rise since 1982.
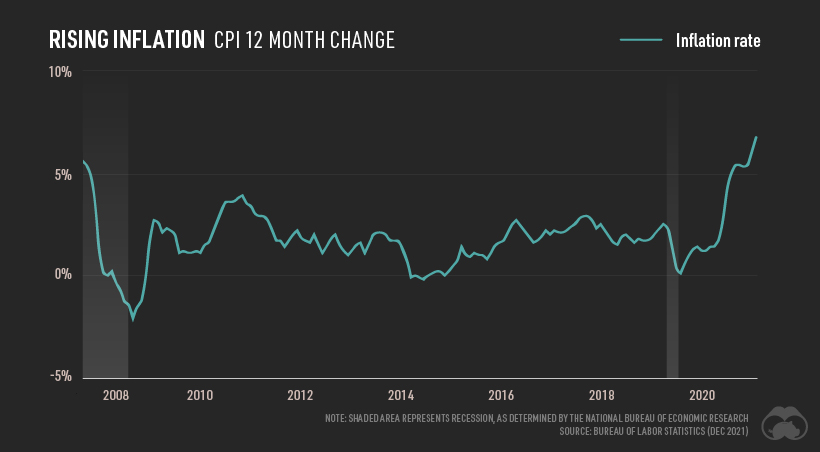
Given this increase, Lawrence Summers, former U.S. Treasury Secretary and Jason Furman, former chief economist for President Obama say that the Fed didn’t taper soon enough. Other financial heavyweights suggest this is just the beginning of a hawkish approach to inflation.
So how does Fed tapering impact inflation?
By tapering asset purchases, the amount of money circulating in the economy that can be used to borrow to buy a house or car is reduced. According to this theory, when there is less spending, inflation will gradually cool down.
Fed Tapering and Interest Rates
The Federal Reserve has outlined that it will taper asset purchases before it increases targets on short-term interest rates. By current estimates, interest rates could rise in March.
However, if the pandemic takes a turn for the worse, the Federal Reserve can shift direction. This gives the Fed time to assess how the market and economy will react before it raises rates.
To prevent the taper tantrum of 2013, which led to market volatility and U.S. dollar appreciation, Federal Reserve chair Jerome Powell has stated that the Fed must carefully communicate the sequence of QE and tapering to prevent any fear in the market.
When Doves Cry
Like the 1940s, the rise in money growth over the pandemic has been driven by government deficits. By contrast, leading up to the 2008 Global Financial Crisis or during the 1950s and 60s, the private sector spurred loan growth.
Monetary inflation can impact consumer prices and financial asset inflation.
As CPI and financial markets have soared over the pandemic, investors will be watching closely to see how Fed tapering impacts future monetary policy.


Markets in a Minute
The Top 5 Reasons Clients Fire a Financial Advisor
Firing an advisor is often driven by more than cost and performance factors. Here are the top reasons clients ‘break up’ with their advisors.

The Top 5 Reasons Clients Fire a Financial Advisor
What drives investors to fire a financial advisor?
From saving for a down payment to planning for retirement, clients turn to advisors to guide them through life’s complex financial decisions. However, many of the key reasons for firing a financial advisor stem from emotional factors, and go beyond purely financial motivations.
We partnered with Morningstar to show the top reasons clients fire an advisor to provide insight on what’s driving investor behavior.
What Drives Firing Decisions?
Here are the top reasons clients terminated their advisor, based on a survey of 184 respondents:
| Reason for Firing | % of Respondents Citing This Reason | Type of Motivation |
|---|---|---|
| Quality of financial advice and services | 32% | Emotion-based reason |
| Quality of relationship | 21% | Emotion-based reason |
| Cost of services | 17% | Financial-based reason |
| Return performance | 11% | Financial-based reason |
| Comfort handling financial issues on their own | 10% | Emotion-based reason |
Numbers may not total 100 due to rounding. Respondents could select more than one answer.
Numbers may not total 100 due to rounding. Respondents could select more than one answer.
While firing an advisor is rare, many of the primary drivers behind firing decisions are also emotionally driven.
Often, advisors were fired due to the quality of the relationship. In many cases, this was due to an advisor not dedicating enough time to fully grasp their personal financial goals. Additionally, wealthier, and more financially literate clients are more likely to fire their advisors—highlighting the importance of understanding the client.
Key Takeaways
Given these driving factors, here are five ways that advisors can build a lasting relationship through recognizing their clients’ emotional needs:
- Understand your clients’ deeper goals
- Reach out proactively
- Act as a financial coach
- Keep clients updated
- Conduct goal-setting exercises on a regular basis
By communicating their value and setting expectations early, advisors can help prevent setbacks in their practice by adeptly recognizing the emotional motivators of their clients.
Markets in a Minute
The Top 5 Reasons Clients Hire a Financial Advisor
Here are the most common drivers for hiring a financial advisor, revealing that investor motivations go beyond just financial factors.

The Top 5 Reasons Clients Hire a Financial Advisor
What drives investors to hire a financial advisor?
From saving for a down payment to planning for retirement, clients turn to advisors to guide them through life’s complex financial decisions. However, many of the key reasons for hiring a financial advisor stem from emotional factors, and go beyond purely financial motivations.
We partnered with Morningstar to show the top reasons clients hire a financial advisor to provide insight on what’s driving investor behavior.
What Drives Hiring Decisions?
Here are the most common reasons for hiring an advisor, based on a survey of 312 respondents.
| Reason for Hiring | % of Respondents Citing This Reason | Type of Motivation |
|---|---|---|
| Specific goals or needs | 32% | Financial-based reason |
| Discomfort handling finances | 32% | Emotion-based reason |
| Behavioral coaching | 17% | Emotion-based reason |
| Recommended by family or friends | 12% | Emotion-based reason |
| Quality of relationship | 10% | Emotion-based reason |
Numbers may not total 100 due to rounding. Respondents could select more than one answer.
While financial factors played an important role in hiring decisions, emotional reasons made up the largest share of total responses.
This illustrates that clients place a high degree of importance on reaching specific goals or needs, and how an advisor communicates with them. Furthermore, clients seek out advisors for behavioral coaching to help them make informed decisions while staying the course.
Key Takeaways
With this in mind, here are five ways advisors can provide value to their clients and grow their practice:
- Address clients’ emotional needs early on
- Demonstrate how you can offer support
- Use ordinary language
- Provide education to help clients stay on track
- Acknowledge that these are issues we all face
By addressing emotional factors, advisors can more effectively help clients’ navigate intricate financial decisions and avoid common behavioral mistakes.

The Top 5 Reasons Clients Fire a Financial Advisor

The Top 5 Reasons Clients Hire a Financial Advisor

Visualizing the Growth of $100, by Asset Class

How Small Investments Make a Big Impact Over Time

What Were the Top Performing Investment Themes of 2023?
-

 Infographics2 years ago
The Top Investment Quotes Every Investor Should Know
-

 Markets in a Minute2 years ago
Mapped: The Growth in U.S. House Prices by State
-

 Markets in a Minute2 years ago
How Closely Related Are Historical Mortgage Rates and Housing Prices?
-

 Infographics2 years ago
A Visual Guide to Stagflation, Inflation, and Deflation
-

 Markets in a Minute1 year ago
Mapped: Global Energy Prices, by Country in 2022
-

 Infographics3 years ago
The 5 Fastest Growing Industries of the Next Decade
-

 Markets in a Minute2 years ago
Visualizing Historical Oil Prices (1968-2022)
-

 Infographics1 year ago
Visual Guide: The Three Types of Economic Indicators
