
Markets in a Minute
The Projected Growth of Alternative Assets
This infographic is available as a poster.
This infographic is available as a poster.
The Projected Growth of Alternative Assets
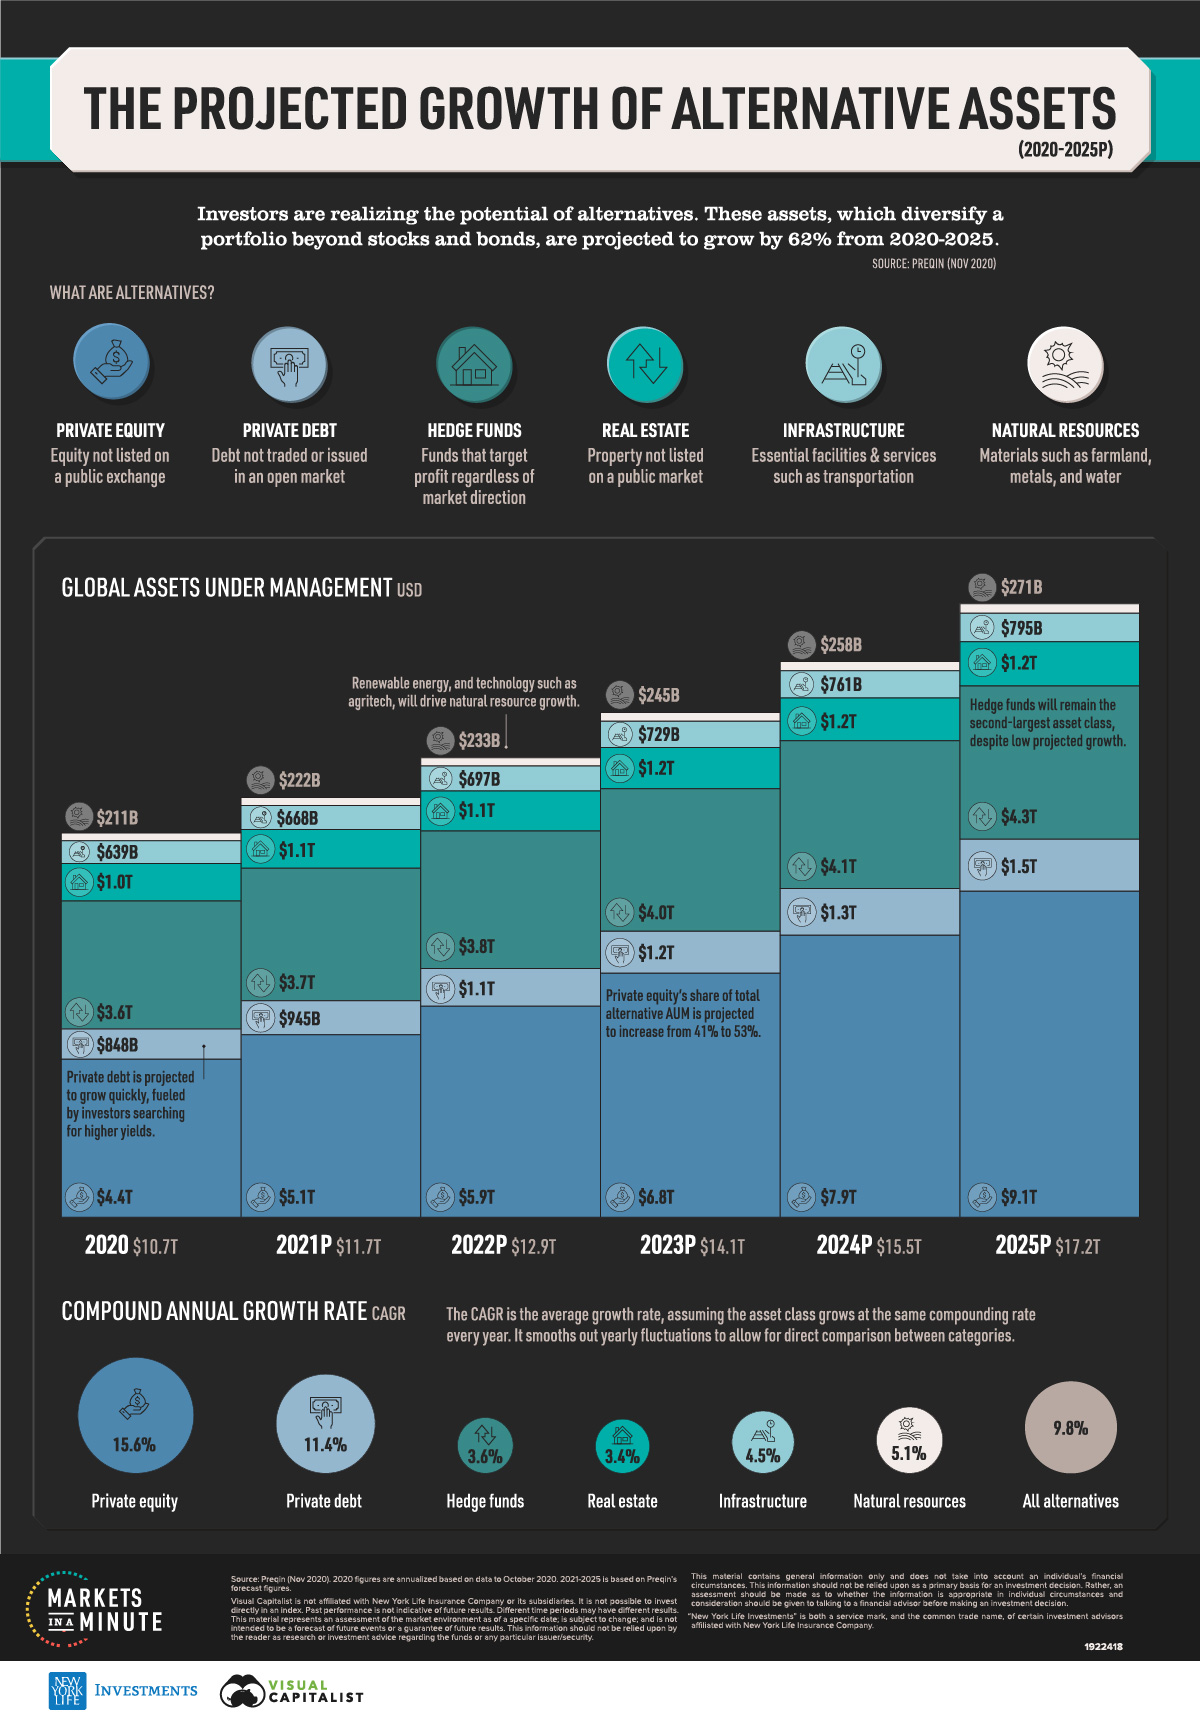
When it comes to investing, the focus is typically on stocks and bonds. However, in recent years, many investors have turned their attention to another opportunity: alternative assets.
In fact, global assets under management (AUM) in alternatives are projected to grow by 62% from 2020-2025. In this Markets in a Minute from New York Life Investments, we explain what alternative assets are and which categories will see the most growth.
What are Alternative Assets?
Alternative assets are investments that fall outside of the traditional asset classes of stocks, bonds, and cash. They are broken up into the following asset classes:
- Private equity: Investing in companies that are not publicly traded or listed on a stock exchange. This can also include the acquisition of public companies by a private investment fund or investor.
- Private debt: Investing in companies in the form of debt as opposed to equity. Private debt is not typically financed by banks, nor traded or issued in an open market.
- Hedge funds: Largely unregulated funds that can invest across a wide range of asset classes and instruments. These funds aim to ‘hedge’ risk and maximize profits regardless of which direction the market moves through long (buy) or short (sell) positions.
- Real estate: The acquisition, financing, and ownership of real estate assets by private investment vehicles, funds, or firms. This includes residential, commercial, and industrial properties both at the time of original listing and when being sold between two parties afterwards.
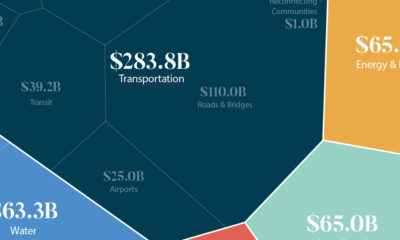
- Infrastructure: Investment in services and facilities considered essential to the economic development of a society. This includes energy, logistics, telecoms, transportation, utilities, and waste management.
- Natural resources: Investment in the development, enhancement, or production of various types of natural resources. This includes agriculture, renewable energy, timberland, water, and metals.
In contrast to traditional markets, alternative assets are typically less liquid and less regulated.
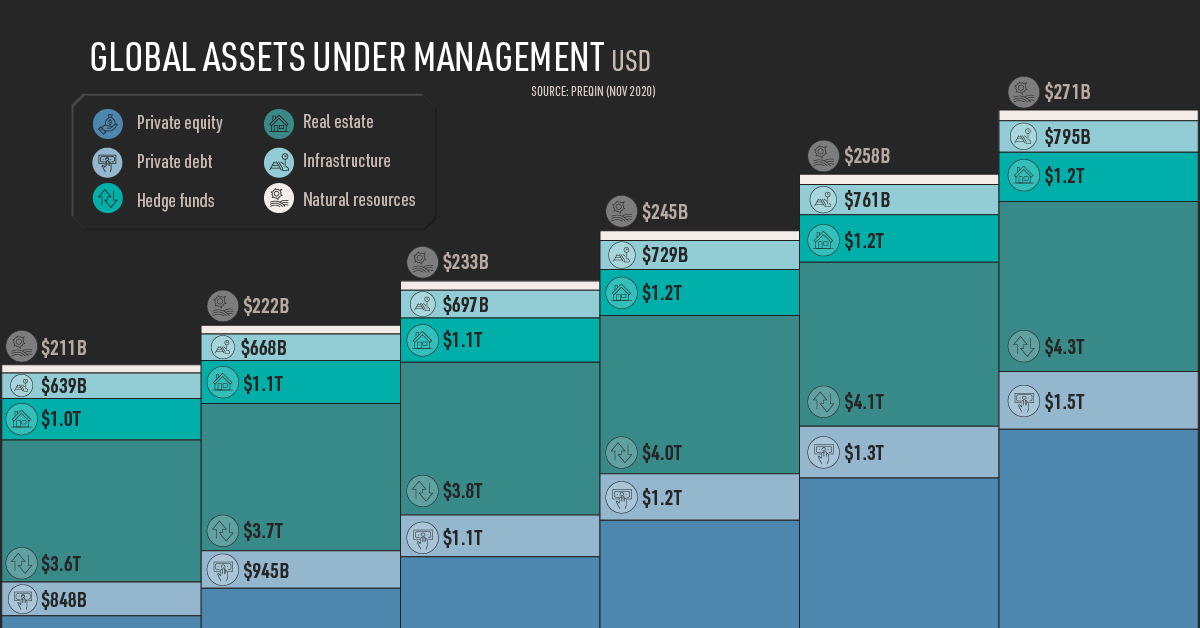
Global Growth
According to Preqin, all alternative asset classes will see significant growth in global AUM. Here’s how the projections break down from 2020 to 2025:
| 2020 | 2021P | 2022P | 2023P | 2024P | 2025P | CAGR | |
|---|---|---|---|---|---|---|---|
| Private equity | 4.4T | $5.1T | $5.9T | $6.8T | $7.9T | $9.1T | 15.6% |
| Private debt | $848B | $945B | $1.1T | $1.2T | $1.3T | $1.5T | 11.4% |
| Hedge funds | $3.6T | $3.7T | $3.8T | $4.0T | $4.1T | $4.3T | 3.6% |
| Real estate | $1.0T | $1.1T | $1.1T | $1.2T | $1.2T | $1.2T | 3.4% |
| Infrastructure | $639B | $668B | $697B | $729B | $761B | $795B | 4.5% |
| Natural resources | $211B | $222B | $233B | $245B | $258B | $271B | 5.1% |
| Total | $10.7T | $11.7T | $12.9T | $14.1T | $15.5T | $17.2T | 9.8% |
Private equity will grow the fastest, and will also see the highest growth in dollar terms. In fact, its proportion of alternative assets’ AUM is expected to rise from 41% in 2020 to 53% in 2025. Preqin predicts that this will be due to both strong performance and asset flows, with 79% of surveyed investors planning to increase their allocation to private equity.
Private debt is also expected to see strong growth. With greater risk appetite than banks, private debt funds could be active in emerging technologies such as pharmaceuticals and the remote working industry. These funds take on higher risk in anticipation of higher yield potential, an attractive proposition for investors amid low interest rates in many areas.
Similarly, investors will likely turn to real estate for its yield potential. Long-leased assets usually offer stable cash flows and indexed rents, making them one of the asset classes that may hedge inflation. However, the industry is projected to have the lowest compound annual growth rate, given the uncertainty facing office and retail spaces post COVID-19.
The Opportunities in Alternative Assets
Outside of investments such as liquid alternatives, alternative assets have typically only been accessible to institutional investors. However, recent regulatory changes by the U.S. Security and Exchange Commission (SEC) mean that private markets are opening up to individual investors if they meet certain criteria.
Alternative assets offer a number of compelling opportunities, including portfolio diversification, lower correlation with public markets, and potential outperformance. In fact, research has found that private equity was the best-performing asset class in a public pension portfolio, based on median annualized returns from 2010-2020.
According to Preqin’s projections, it appears investors are realizing this potential. While stocks and bonds will likely remain central to portfolios, alternative assets can help to broaden investors’ horizons.


Markets in a Minute
The Top 5 Reasons Clients Fire a Financial Advisor
Firing an advisor is often driven by more than cost and performance factors. Here are the top reasons clients ‘break up’ with their advisors.

The Top 5 Reasons Clients Fire a Financial Advisor
What drives investors to fire a financial advisor?
From saving for a down payment to planning for retirement, clients turn to advisors to guide them through life’s complex financial decisions. However, many of the key reasons for firing a financial advisor stem from emotional factors, and go beyond purely financial motivations.
We partnered with Morningstar to show the top reasons clients fire an advisor to provide insight on what’s driving investor behavior.
What Drives Firing Decisions?
Here are the top reasons clients terminated their advisor, based on a survey of 184 respondents:
| Reason for Firing | % of Respondents Citing This Reason | Type of Motivation |
|---|---|---|
| Quality of financial advice and services | 32% | Emotion-based reason |
| Quality of relationship | 21% | Emotion-based reason |
| Cost of services | 17% | Financial-based reason |
| Return performance | 11% | Financial-based reason |
| Comfort handling financial issues on their own | 10% | Emotion-based reason |
Numbers may not total 100 due to rounding. Respondents could select more than one answer.
Numbers may not total 100 due to rounding. Respondents could select more than one answer.
While firing an advisor is rare, many of the primary drivers behind firing decisions are also emotionally driven.
Often, advisors were fired due to the quality of the relationship. In many cases, this was due to an advisor not dedicating enough time to fully grasp their personal financial goals. Additionally, wealthier, and more financially literate clients are more likely to fire their advisors—highlighting the importance of understanding the client.
Key Takeaways
Given these driving factors, here are five ways that advisors can build a lasting relationship through recognizing their clients’ emotional needs:
- Understand your clients’ deeper goals
- Reach out proactively
- Act as a financial coach
- Keep clients updated
- Conduct goal-setting exercises on a regular basis
By communicating their value and setting expectations early, advisors can help prevent setbacks in their practice by adeptly recognizing the emotional motivators of their clients.
Markets in a Minute
The Top 5 Reasons Clients Hire a Financial Advisor
Here are the most common drivers for hiring a financial advisor, revealing that investor motivations go beyond just financial factors.

The Top 5 Reasons Clients Hire a Financial Advisor
What drives investors to hire a financial advisor?
From saving for a down payment to planning for retirement, clients turn to advisors to guide them through life’s complex financial decisions. However, many of the key reasons for hiring a financial advisor stem from emotional factors, and go beyond purely financial motivations.
We partnered with Morningstar to show the top reasons clients hire a financial advisor to provide insight on what’s driving investor behavior.
What Drives Hiring Decisions?
Here are the most common reasons for hiring an advisor, based on a survey of 312 respondents.
| Reason for Hiring | % of Respondents Citing This Reason | Type of Motivation |
|---|---|---|
| Specific goals or needs | 32% | Financial-based reason |
| Discomfort handling finances | 32% | Emotion-based reason |
| Behavioral coaching | 17% | Emotion-based reason |
| Recommended by family or friends | 12% | Emotion-based reason |
| Quality of relationship | 10% | Emotion-based reason |
Numbers may not total 100 due to rounding. Respondents could select more than one answer.
While financial factors played an important role in hiring decisions, emotional reasons made up the largest share of total responses.
This illustrates that clients place a high degree of importance on reaching specific goals or needs, and how an advisor communicates with them. Furthermore, clients seek out advisors for behavioral coaching to help them make informed decisions while staying the course.
Key Takeaways
With this in mind, here are five ways advisors can provide value to their clients and grow their practice:
- Address clients’ emotional needs early on
- Demonstrate how you can offer support
- Use ordinary language
- Provide education to help clients stay on track
- Acknowledge that these are issues we all face
By addressing emotional factors, advisors can more effectively help clients’ navigate intricate financial decisions and avoid common behavioral mistakes.

The Top 5 Reasons Clients Fire a Financial Advisor

The Top 5 Reasons Clients Hire a Financial Advisor

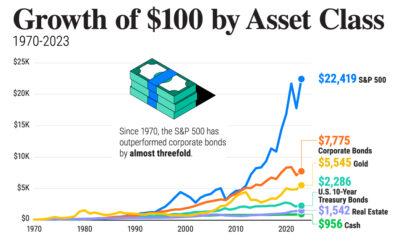
Visualizing the Growth of $100, by Asset Class

How Small Investments Make a Big Impact Over Time

What Were the Top Performing Investment Themes of 2023?
-

 Infographics2 years ago
The Top Investment Quotes Every Investor Should Know
-

 Markets in a Minute2 years ago
Mapped: The Growth in U.S. House Prices by State
-

 Markets in a Minute2 years ago
How Closely Related Are Historical Mortgage Rates and Housing Prices?
-

 Infographics2 years ago
A Visual Guide to Stagflation, Inflation, and Deflation
-

 Markets in a Minute1 year ago
Mapped: Global Energy Prices, by Country in 2022
-

 Infographics3 years ago
The 5 Fastest Growing Industries of the Next Decade
-

 Markets in a Minute2 years ago
Visualizing Historical Oil Prices (1968-2022)
-

 Infographics1 year ago
Visual Guide: The Three Types of Economic Indicators
