
Markets in a Minute
Ranked: The Biggest U.S. Tax Breaks
This infographic is available as a poster.
This infographic is available as a poster.
Ranked: The Biggest U.S. Tax Breaks
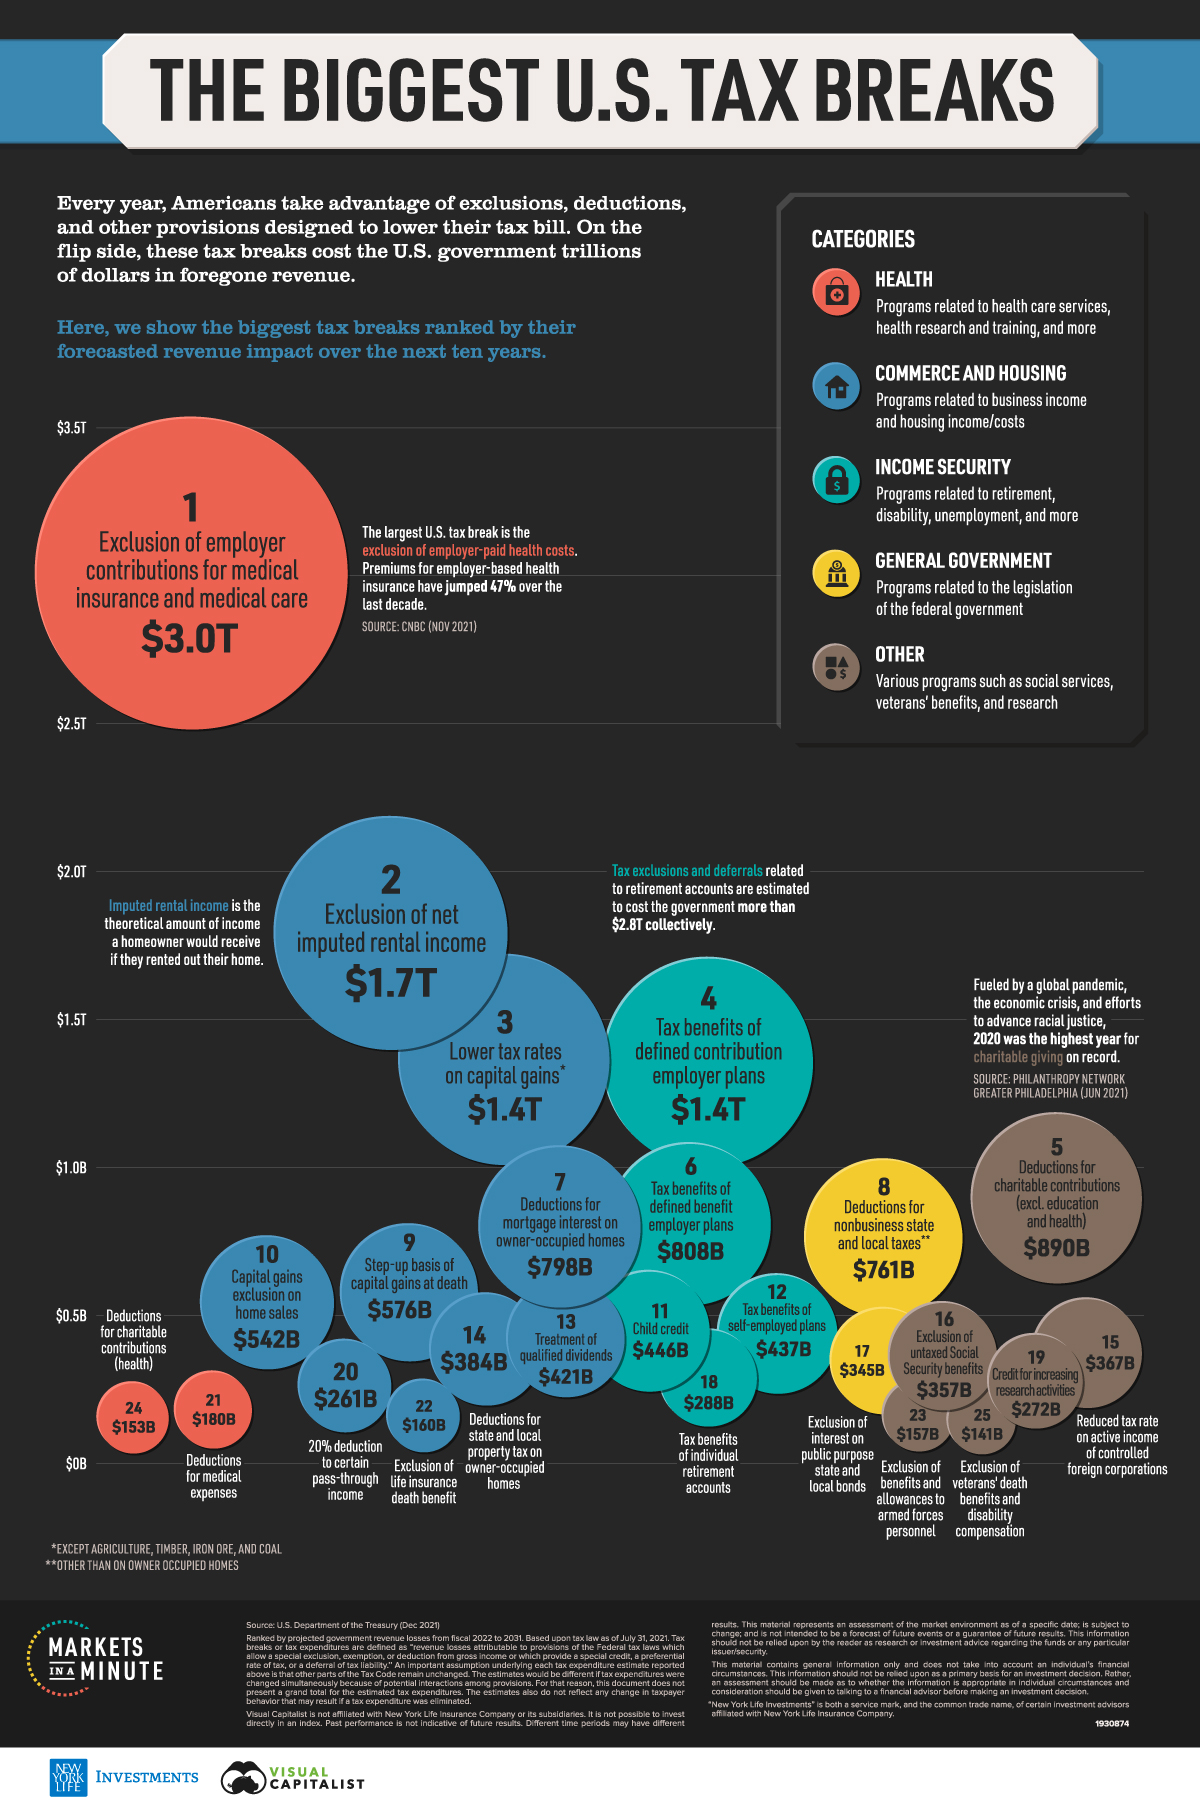
When you go to file your taxes this year, you’ll likely be looking for ways to minimize your tax bill. Tax breaks like credits and deductions—also known as tax expenditures—could reduce what you owe. On the flip side, they also cost the government trillions of dollars in foregone revenue.
In this Markets in a Minute from New York Life Investments, we rank the top 25 tax breaks by their forecast revenue impact over the next 10 years on the U.S. government.
What Are Tax Expenditures?
Tax expenditures are provisions within federal tax laws that result in government revenue losses. They can apply to individuals and/or corporations, and include a variety of things:
- Special exclusions
- Exemptions
- Deductions
- Special credits
- Preferential tax rates
- Tax deferrals
These expenditures are required by law to be included in the federal budget, and can be viewed as an alternative to other policy options such as direct spending. It’s important to note that when the budget is developed, revenue loss estimates are based on the assumption that all other parts of the tax code remain unchanged.
Tax Breaks, Ranked by Government Revenue Losses
With this in mind, let’s take a look at which tax expenditures are the biggest. We have ranked them by how much they are projected to cost the U.S. government in lost revenue over the next 10 fiscal years.
| Provision | Projected Revenue Losses 2022-2031 |
|---|---|
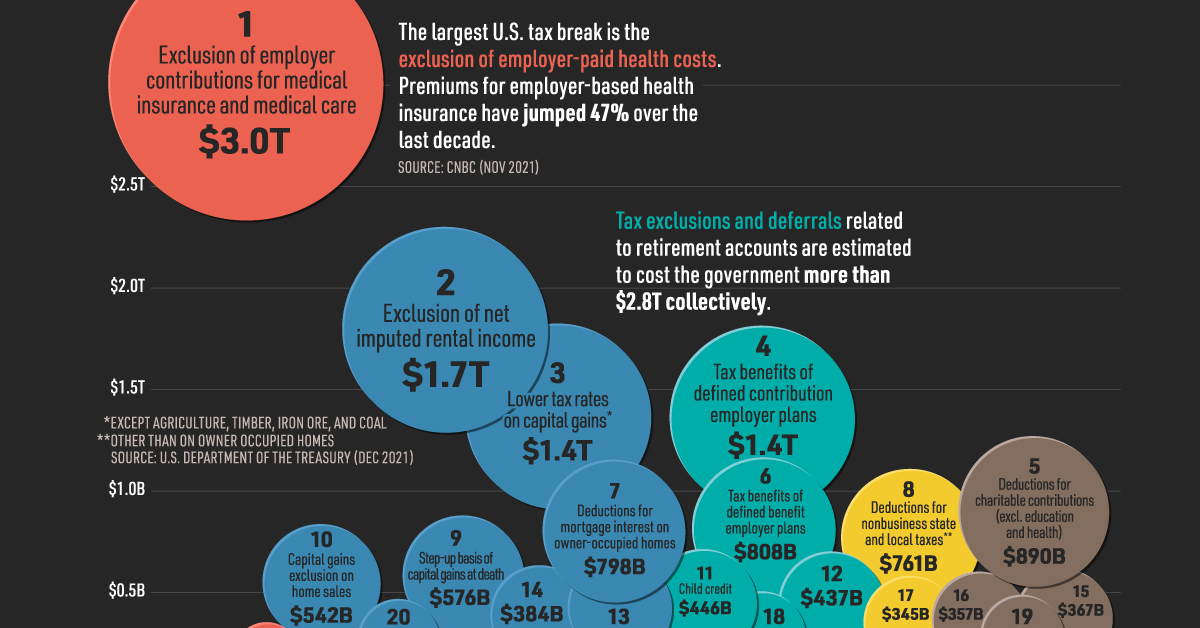
| Exclusion of employer contributions for medical insurance and medical care | $3.0T |
| Exclusion of net imputed rental income | $1.7T |
| Lower tax rates on capital gains | $1.4T |
| Tax benefits of defined contribution employer plans | $1.4T |
| Deductions for charitable contributions (excl. education and health) | $890B |
| Tax benefits of defined benefit employer plans | $808B |
| Deductions for mortgage interest on owner-occupied homes | $798B |
| Deductions for nonbusiness state and local taxes | $761B |
| Step-up basis of capital gains at death | $576B |
| Capital gains exclusion on home sales | $542B |
| Child credit | $446B |
| Tax benefits of self-employed plans | $437B |
| Treatment of qualified dividends | $421B |
| Deductions for state and local property tax on owner-occupied homes | $384B |
| Reduced tax rate on active income of controlled foreign corporations | $367B |
| Exclusion of untaxed Social Security benefits | $357B |
| Exclusion of interest on public purpose state and local bonds | $345B |
| Tax benefits of individual retirement accounts | $288B |
| Credit for increasing research activities | $272B |
| 20% deduction to certain pass-through income | $261B |
| Deductions for medical expenses | $180B |
| Exclusion of life insurance death benefits | $160B |
| Exclusion of benefits and allowances to armed forces personnel | $157B |
| Deductions for charitable contributions (health) | $153B |
| Exclusion of veterans' death benefits and disability compensation | $141B |
By a long shot, excluding an employer’s medical contributions from an employee’s taxable income is the biggest tax break. Family premiums for employer-sponsored coverage have jumped 47% over the last decade, outpacing both wage growth (31%) and inflation (23%).
The lower tax rates on capital gains is also forecast to cost the government trillions in lost revenue. In fact, the Biden Administration had proposed to significantly increase the capital gains tax in order to fund their budget, though this change has not come to fruition.
Tax expenditures related to retirement plans are also costly for the government. Income exclusions and tax deferrals for defined contribution plans are expected to cost $1.4 trillion over the next decade, nearly double that of tax breaks for defined benefit plans. This reflects the long-term decline of defined benefit plans. In fact, only 20% of U.S. workers participate in a defined benefit plan, whereas 43% participate in a defined contribution plan.
The Perks of Home Ownership
Finally, many of the largest tax breaks benefit homeowners. The exclusion of net imputed rental income—the theoretical income a homeowner would receive if they rented their home—is the second largest tax break.
On their primary residence, homeowners also get a capital gains exclusion when they sell their home. However, this exclusion is capped and is not indexed to inflation. Home prices climbed 19% in 2021 according to the S&P/Case-Shiller U.S. National Home Price Index, effectively lowering the benefit of this tax break.
Finding Opportunity in Tax Expenditures
From credits to deductions, there are a number of tax breaks available to Americans. You can consider them when you are structuring an investment portfolio. For instance, if you hold assets with capital appreciation potential—like stocks—for at least a year, they are typically subject to a lower tax rate on their capital gains. Making contributions to a retirement plan will allow you to reduce your taxable income and defer taxes, subject to certain limits.
Of course, tax expenditures are in flux based on government policy at the time. By staying up to date on changes, investors can be poised to minimize their tax obligations and grow their wealth.


Markets in a Minute
The Top 5 Reasons Clients Fire a Financial Advisor
Firing an advisor is often driven by more than cost and performance factors. Here are the top reasons clients ‘break up’ with their advisors.

The Top 5 Reasons Clients Fire a Financial Advisor
What drives investors to fire a financial advisor?
From saving for a down payment to planning for retirement, clients turn to advisors to guide them through life’s complex financial decisions. However, many of the key reasons for firing a financial advisor stem from emotional factors, and go beyond purely financial motivations.
We partnered with Morningstar to show the top reasons clients fire an advisor to provide insight on what’s driving investor behavior.
What Drives Firing Decisions?
Here are the top reasons clients terminated their advisor, based on a survey of 184 respondents:
| Reason for Firing | % of Respondents Citing This Reason | Type of Motivation |
|---|---|---|
| Quality of financial advice and services | 32% | Emotion-based reason |
| Quality of relationship | 21% | Emotion-based reason |
| Cost of services | 17% | Financial-based reason |
| Return performance | 11% | Financial-based reason |
| Comfort handling financial issues on their own | 10% | Emotion-based reason |
Numbers may not total 100 due to rounding. Respondents could select more than one answer.
Numbers may not total 100 due to rounding. Respondents could select more than one answer.
While firing an advisor is rare, many of the primary drivers behind firing decisions are also emotionally driven.
Often, advisors were fired due to the quality of the relationship. In many cases, this was due to an advisor not dedicating enough time to fully grasp their personal financial goals. Additionally, wealthier, and more financially literate clients are more likely to fire their advisors—highlighting the importance of understanding the client.
Key Takeaways
Given these driving factors, here are five ways that advisors can build a lasting relationship through recognizing their clients’ emotional needs:
- Understand your clients’ deeper goals
- Reach out proactively
- Act as a financial coach
- Keep clients updated
- Conduct goal-setting exercises on a regular basis
By communicating their value and setting expectations early, advisors can help prevent setbacks in their practice by adeptly recognizing the emotional motivators of their clients.
Markets in a Minute
The Top 5 Reasons Clients Hire a Financial Advisor
Here are the most common drivers for hiring a financial advisor, revealing that investor motivations go beyond just financial factors.

The Top 5 Reasons Clients Hire a Financial Advisor
What drives investors to hire a financial advisor?
From saving for a down payment to planning for retirement, clients turn to advisors to guide them through life’s complex financial decisions. However, many of the key reasons for hiring a financial advisor stem from emotional factors, and go beyond purely financial motivations.
We partnered with Morningstar to show the top reasons clients hire a financial advisor to provide insight on what’s driving investor behavior.
What Drives Hiring Decisions?
Here are the most common reasons for hiring an advisor, based on a survey of 312 respondents.
| Reason for Hiring | % of Respondents Citing This Reason | Type of Motivation |
|---|---|---|
| Specific goals or needs | 32% | Financial-based reason |
| Discomfort handling finances | 32% | Emotion-based reason |
| Behavioral coaching | 17% | Emotion-based reason |
| Recommended by family or friends | 12% | Emotion-based reason |
| Quality of relationship | 10% | Emotion-based reason |
Numbers may not total 100 due to rounding. Respondents could select more than one answer.
While financial factors played an important role in hiring decisions, emotional reasons made up the largest share of total responses.
This illustrates that clients place a high degree of importance on reaching specific goals or needs, and how an advisor communicates with them. Furthermore, clients seek out advisors for behavioral coaching to help them make informed decisions while staying the course.
Key Takeaways
With this in mind, here are five ways advisors can provide value to their clients and grow their practice:
- Address clients’ emotional needs early on
- Demonstrate how you can offer support
- Use ordinary language
- Provide education to help clients stay on track
- Acknowledge that these are issues we all face
By addressing emotional factors, advisors can more effectively help clients’ navigate intricate financial decisions and avoid common behavioral mistakes.

The Top 5 Reasons Clients Fire a Financial Advisor

The Top 5 Reasons Clients Hire a Financial Advisor

Visualizing the Growth of $100, by Asset Class

How Small Investments Make a Big Impact Over Time

What Were the Top Performing Investment Themes of 2023?
-

 Infographics2 years ago
The Top Investment Quotes Every Investor Should Know
-

 Markets in a Minute2 years ago
Mapped: The Growth in U.S. House Prices by State
-

 Markets in a Minute2 years ago
How Closely Related Are Historical Mortgage Rates and Housing Prices?
-

 Infographics2 years ago
A Visual Guide to Stagflation, Inflation, and Deflation
-

 Markets in a Minute1 year ago
Mapped: Global Energy Prices, by Country in 2022
-

 Infographics3 years ago
The 5 Fastest Growing Industries of the Next Decade
-

 Markets in a Minute2 years ago
Visualizing Historical Oil Prices (1968-2022)
-

 Infographics1 year ago
Visual Guide: The Three Types of Economic Indicators
