
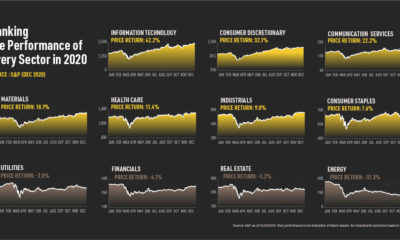
Markets in a Minute
The Recovering Financial Health of Americans
This infographic is available as a poster.
This infographic is available as a poster.
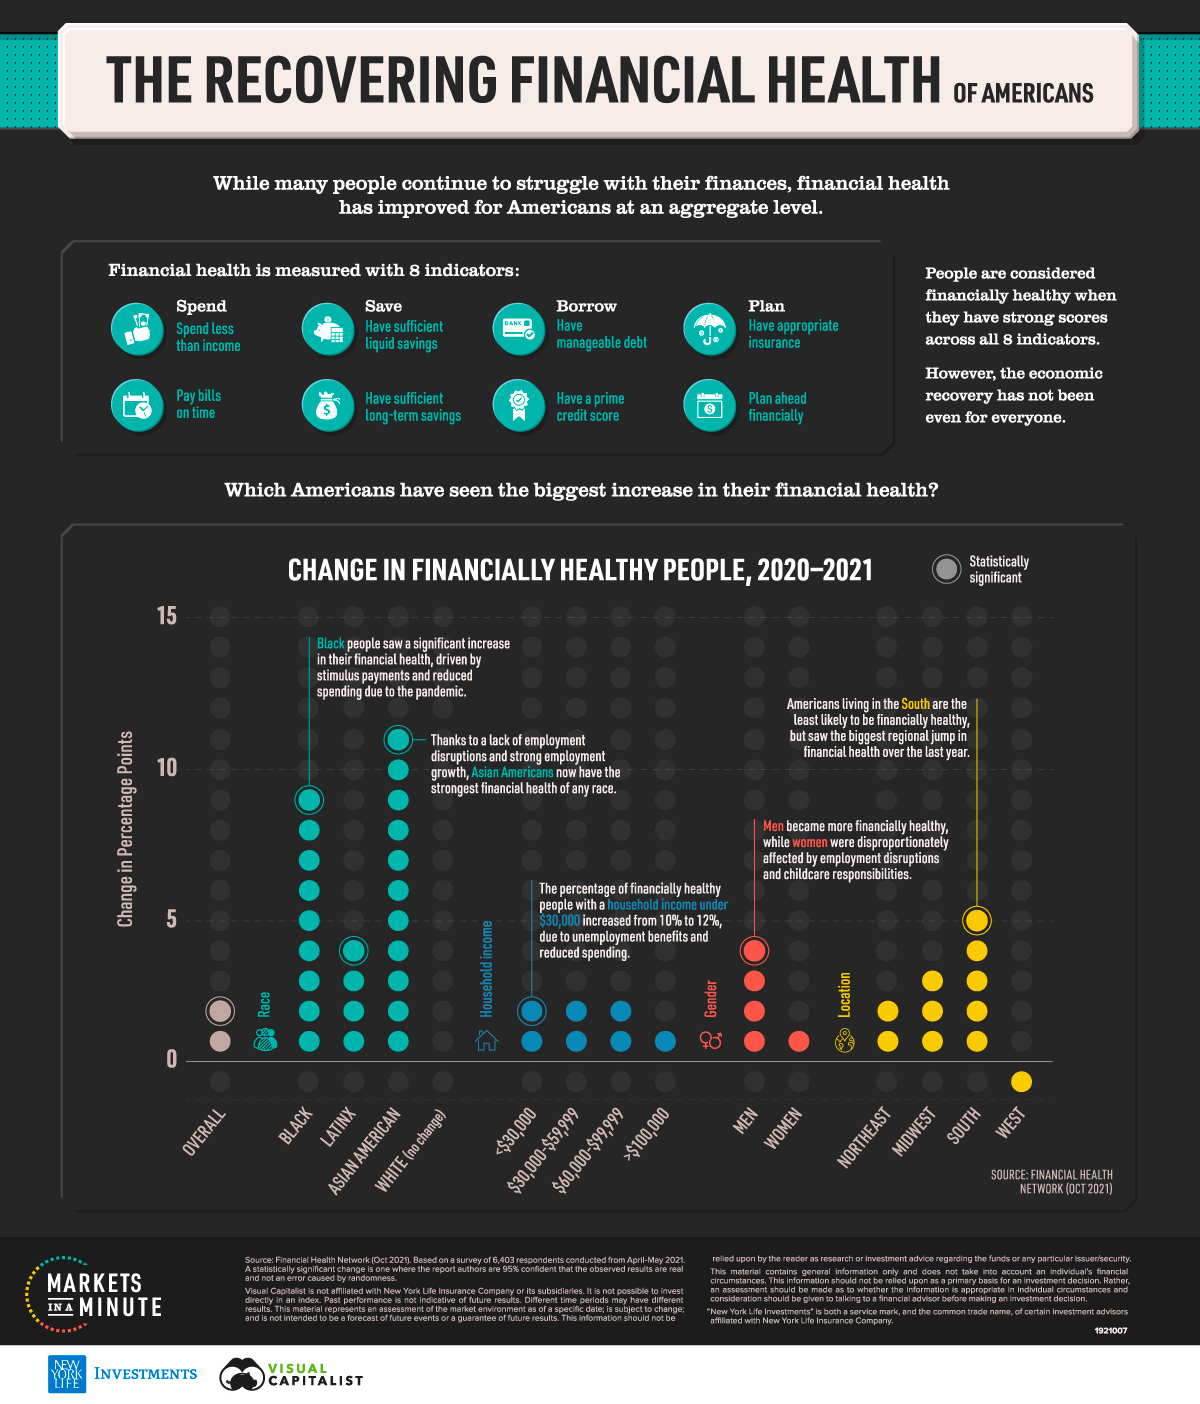
The Recovering Financial Health of Americans
Did you spend less and save more due to the COVID-19 pandemic? If so, you’re not alone.
Overall, the percent of Americans with strong financial health increased by 2% from 2020-2021. This was largely due to the aforementioned behavioral changes, along with government interventions like stimulus payments that helped Americans pay off their debt.
However, the economic recovery has not been even for everyone. This Markets in a Minute from New York Life Investments looks at which Americans have seen the biggest increase in their financial health, broken down by race, household income, gender, and location.
What is Financial Health?
Before we dive into the results, let’s take a look at what financial health means. It is measured using eight indicators within four broad categories:
- Spend: Spend less than income and pay bills on time
- Save: Have sufficient liquid savings and long-term savings
- Borrow: Have manageable debt and a prime credit score
- Plan: Have appropriate insurance and plan ahead financially
People are considered to be financially healthy when they have strong scores across all of the above indicators.
Changes in Financial Health
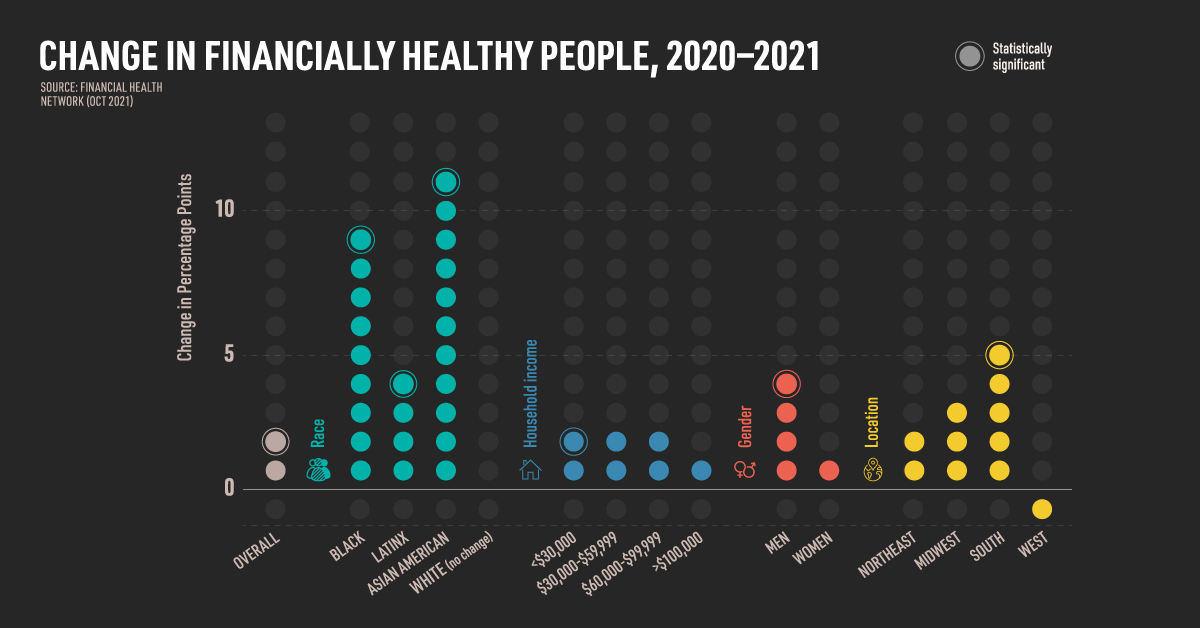
In order to measure financial health, the Financial Health Network surveyed 6,403 respondents in April and May 2021. Below are the changes in financially healthy people, measured in percentage points (p.p.), from 2020-2021. Statistically significant responses, where the authors are 95% confident that the observed results are real and not an error caused by randomness, are marked with an asterisk.
| Group | Change in Financially Healthy People (2020-2021) |
|---|---|
| Overall | 2 p.p* |
| Black | 9 p.p.* |
| Latinx | 4 p.p.* |
| Asian American | 11 p.p.* |
| White | 0 p.p. |
| < $30,000 Household income | 2 p.p.* |
| $30,000 - $59,999 Household income | 2 p.p. |
| $60,000 - $99,999 Household income | 2 p.p. |
| > $100,000 Household income | 1 p.p. |
| Men | 4 p.p.* |
| Women | 1 p.p. |
| Northeast | 2 p.p. |
| Midwest | 3 p.p. |
| South | 5 p.p.* |
| West | -1 p.p. |
With an 11 percentage point jump, Asian Americans saw the biggest increase and are now the most financially healthy of any race. The increase was due to an absence in major employment disruptions, growth in employment, and generous unemployment benefits for those who did experience disruptions.
In addition, the proportion of Black people considered financially healthy nearly doubled due to two primary factors: receipt of stimulus payments and reduced spending. This helped Black families to build up savings, pay bills on time, and improve their credit scores.
While men experienced an increase in financial health, women were disproportionately affected by employment disruptions and childcare responsibilities. For instance, women were more than twice as likely as men not to work due to childcare responsibilities in 2021. Meanwhile, men reported bigger improvements in their liquid and long-term savings than women.
People with a household income under $30,000 saw slight improvements in their financial health, primarily due to unemployment benefits and reduced spending. However, lower-income households saw a significant reduction in the “planning ahead financially” indicator, signifying this could be a temporary improvement.
A Current Snapshot
While it is primarily marginalized groups that saw the biggest improvements over the last year, large gaps in financial health remain. Here is the current percentage of people who are financially healthy for each group.
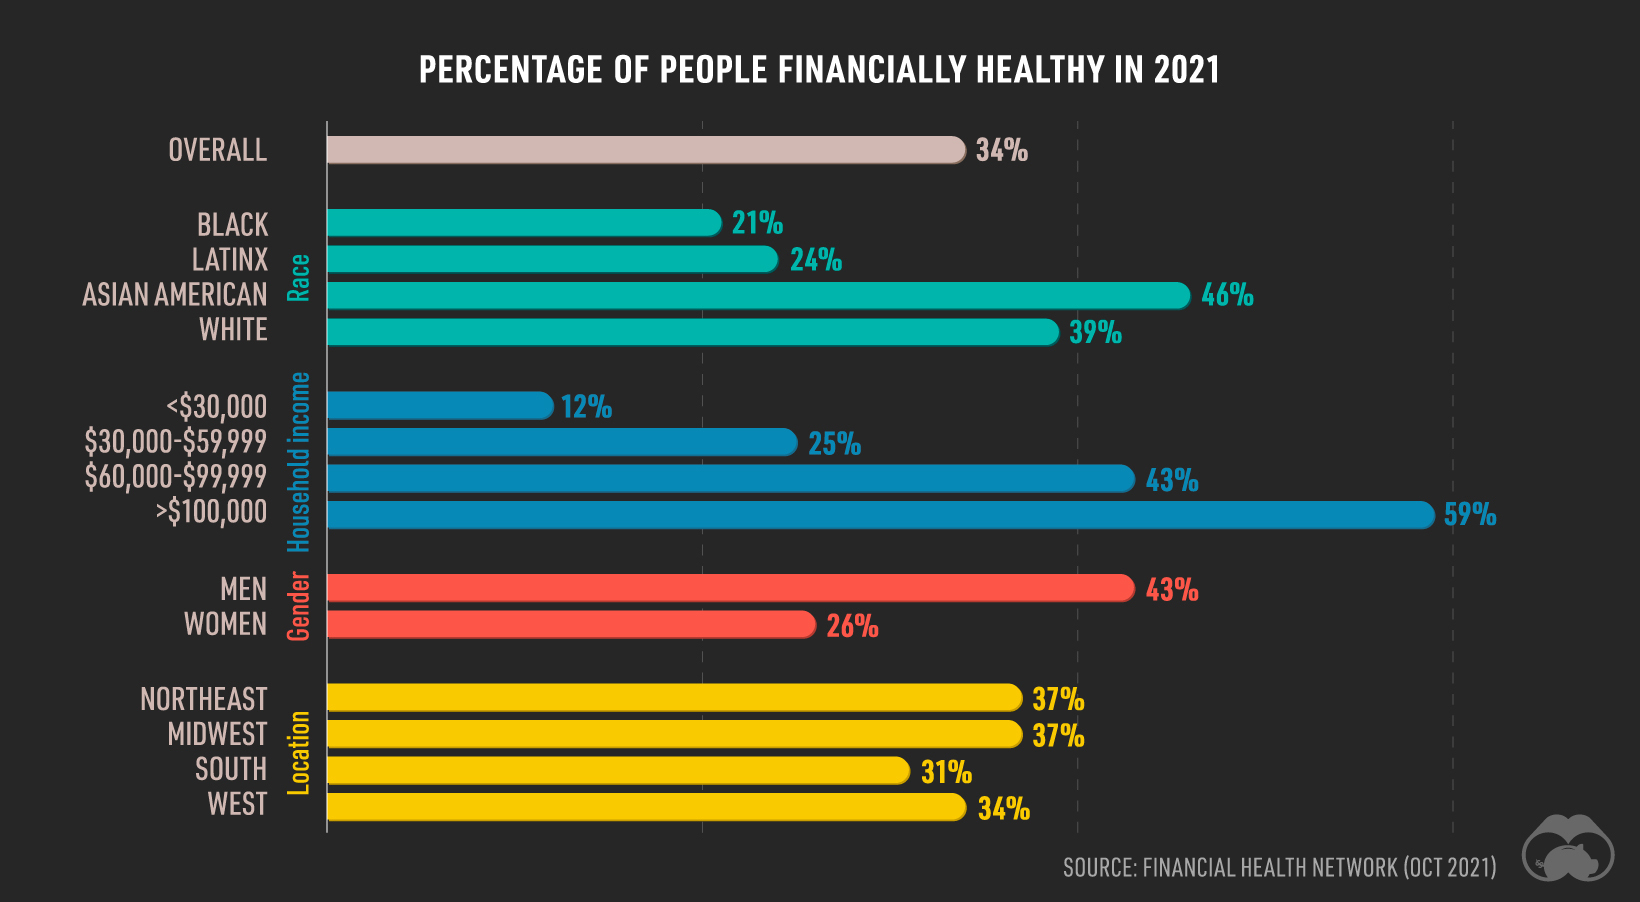
The starkest differences are by income level. People with a household income under $30,000 are nearly five times less likely to be financially healthy than those who have a household income over $100,000.
However, gaps occur across race, gender, and location as well:
- The proportion of Black and Latinx people who are financially healthy is significantly lower than that of Asian Americans and White people.
- Despite an increase in female breadwinners in recent years, women are much less likely than men to have strong financial health.
- Of all regions, Americans living in the South are the least likely to be financially healthy.
At an aggregate level, only one-third of Americans are considered to be financially healthy.
A Continued Recovery?
While it appears that government relief efforts have helped traditionally marginalized groups, it remains unclear what will happen now that these programs are winding down. Not only that, large gaps in financial health still exist. The Financial Health Network recommends policies tailored to help close these gaps, such as universal child care and policies that reduce the disparities in educational opportunity.
Of course, government programs, macroeconomic conditions, and individual behaviors will all play a role in Americans’ financial health going forward. If you were fortunate enough to spend less during the pandemic, do you plan to continue saving more? Your actions could help you build a solid foundation to manage expenses, while also planning ahead for long-term needs.


Markets in a Minute
The Top 5 Reasons Clients Fire a Financial Advisor
Firing an advisor is often driven by more than cost and performance factors. Here are the top reasons clients ‘break up’ with their advisors.

The Top 5 Reasons Clients Fire a Financial Advisor
What drives investors to fire a financial advisor?
From saving for a down payment to planning for retirement, clients turn to advisors to guide them through life’s complex financial decisions. However, many of the key reasons for firing a financial advisor stem from emotional factors, and go beyond purely financial motivations.
We partnered with Morningstar to show the top reasons clients fire an advisor to provide insight on what’s driving investor behavior.
What Drives Firing Decisions?
Here are the top reasons clients terminated their advisor, based on a survey of 184 respondents:
| Reason for Firing | % of Respondents Citing This Reason | Type of Motivation |
|---|---|---|
| Quality of financial advice and services | 32% | Emotion-based reason |
| Quality of relationship | 21% | Emotion-based reason |
| Cost of services | 17% | Financial-based reason |
| Return performance | 11% | Financial-based reason |
| Comfort handling financial issues on their own | 10% | Emotion-based reason |
Numbers may not total 100 due to rounding. Respondents could select more than one answer.
Numbers may not total 100 due to rounding. Respondents could select more than one answer.
While firing an advisor is rare, many of the primary drivers behind firing decisions are also emotionally driven.
Often, advisors were fired due to the quality of the relationship. In many cases, this was due to an advisor not dedicating enough time to fully grasp their personal financial goals. Additionally, wealthier, and more financially literate clients are more likely to fire their advisors—highlighting the importance of understanding the client.
Key Takeaways
Given these driving factors, here are five ways that advisors can build a lasting relationship through recognizing their clients’ emotional needs:
- Understand your clients’ deeper goals
- Reach out proactively
- Act as a financial coach
- Keep clients updated
- Conduct goal-setting exercises on a regular basis
By communicating their value and setting expectations early, advisors can help prevent setbacks in their practice by adeptly recognizing the emotional motivators of their clients.
Markets in a Minute
The Top 5 Reasons Clients Hire a Financial Advisor
Here are the most common drivers for hiring a financial advisor, revealing that investor motivations go beyond just financial factors.

The Top 5 Reasons Clients Hire a Financial Advisor
What drives investors to hire a financial advisor?
From saving for a down payment to planning for retirement, clients turn to advisors to guide them through life’s complex financial decisions. However, many of the key reasons for hiring a financial advisor stem from emotional factors, and go beyond purely financial motivations.
We partnered with Morningstar to show the top reasons clients hire a financial advisor to provide insight on what’s driving investor behavior.
What Drives Hiring Decisions?
Here are the most common reasons for hiring an advisor, based on a survey of 312 respondents.
| Reason for Hiring | % of Respondents Citing This Reason | Type of Motivation |
|---|---|---|
| Specific goals or needs | 32% | Financial-based reason |
| Discomfort handling finances | 32% | Emotion-based reason |
| Behavioral coaching | 17% | Emotion-based reason |
| Recommended by family or friends | 12% | Emotion-based reason |
| Quality of relationship | 10% | Emotion-based reason |
Numbers may not total 100 due to rounding. Respondents could select more than one answer.
While financial factors played an important role in hiring decisions, emotional reasons made up the largest share of total responses.
This illustrates that clients place a high degree of importance on reaching specific goals or needs, and how an advisor communicates with them. Furthermore, clients seek out advisors for behavioral coaching to help them make informed decisions while staying the course.
Key Takeaways
With this in mind, here are five ways advisors can provide value to their clients and grow their practice:
- Address clients’ emotional needs early on
- Demonstrate how you can offer support
- Use ordinary language
- Provide education to help clients stay on track
- Acknowledge that these are issues we all face
By addressing emotional factors, advisors can more effectively help clients’ navigate intricate financial decisions and avoid common behavioral mistakes.

The Top 5 Reasons Clients Fire a Financial Advisor

The Top 5 Reasons Clients Hire a Financial Advisor

Visualizing the Growth of $100, by Asset Class

How Small Investments Make a Big Impact Over Time

What Were the Top Performing Investment Themes of 2023?
-

 Infographics2 years ago
The Top Investment Quotes Every Investor Should Know
-

 Markets in a Minute2 years ago
Mapped: The Growth in U.S. House Prices by State
-

 Markets in a Minute2 years ago
How Closely Related Are Historical Mortgage Rates and Housing Prices?
-

 Infographics2 years ago
A Visual Guide to Stagflation, Inflation, and Deflation
-

 Markets in a Minute1 year ago
Mapped: Global Energy Prices, by Country in 2022
-

 Infographics3 years ago
The 5 Fastest Growing Industries of the Next Decade
-

 Markets in a Minute2 years ago
Visualizing Historical Oil Prices (1968-2022)
-

 Infographics1 year ago
Visual Guide: The Three Types of Economic Indicators
