
Markets in a Minute
Charted: Market Volatility at its Lowest Point Since 2020
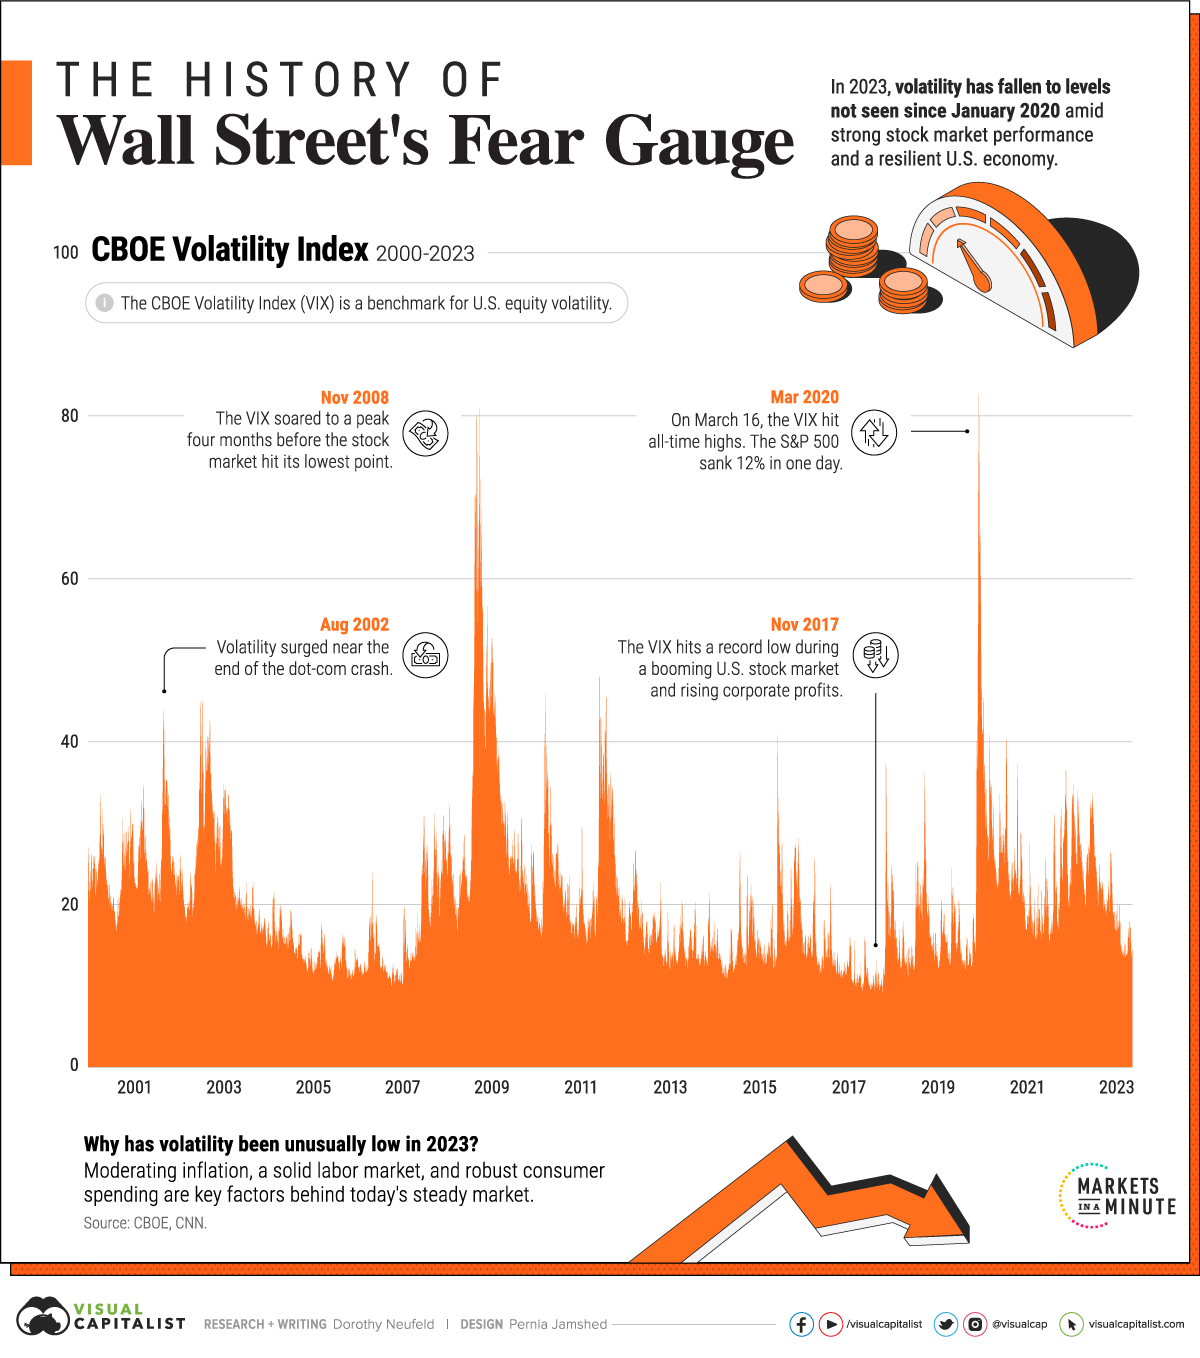
Market Volatility at its Lowest Point Since 2020
Market volatility has been remarkably low in 2023, apart from the brief shock following the failure of Silicon Valley Bank earlier this year.
In fact, the CBOE Volatility Index (VIX)—a primary gauge for measuring U.S. equity volatility—has fallen to lows not seen since before the pandemic.
This graphic shows how today’s market volatility compares to the last two decades, and the factors that may explain its steadiness, based on data from CBOE.
How is Market Volatility Measured?
The most widely used index to track market volatility is the VIX.
In short, it measures the market’s expectation for price changes in the S&P 500. When investor uncertainty is high, the VIX spikes. For this reason, it serves as a barometer of fear in the market and often has a negative correlation to returns. For instance, when the VIX hit a peak on March 16, 2020, the S&P 500 fell 12% in one day.
Market Volatility: All-Time Highs and Lows
To put today’s market volatility in context, here are the market’s peak periods of volatility, through highs and lows:
| Date | VIX All-Time Highs | S&P 500 Daily % Change |
|---|---|---|
| Mar 16, 2020 | 82.7 | -12.0% |
| Nov 20, 2008 | 80.9 | -6.7% |
| Oct 27, 2008 | 80.1 | -3.2% |
| Oct 24, 2008 | 79.1 | -3.5% |
| Mar 3, 2020 | 76.5 | -2.8% |
We can see in the above chart that the VIX skyrocketed in 2020 and 2008 at the height of recession fears.
By contrast market volatility hit all-time lows during 2017, when corporate profitability was high and the S&P 500 was in the middle of the second-longest bull run in history:
| Date | VIX All-Time Lows | S&P 500 Daily % Change |
|---|---|---|
| Nov 3, 2017 | 9.1 | +0.3% |
| Jan 3, 2018 | 9.2 | +0.6% |
| Oct 5, 2017 | 9.2 | +0.6% |
| Jan 4, 2018 | 9.2 | +0.4% |
| Jan 5, 2018 | 9.2 | +0.7% |
When investors have muted reactions to the market’s outlook, often market volatility is lower—reflecting mixed reactions to the market instead of a unanimous, surprise reaction to economic data or other factors that could sway investor behavior.
2023’s Volatility in Context
In September, the VIX declined to 12.8, the lowest point since January 2020. Since then, it has hovered near these levels as investors scale back recession fears, and factor in the likelihood of the U.S. economy achieving a soft landing. To date, the S&P 500 is up almost 17%.
Many factors are influencing the market’s relative calmness. Inflation has been moderating, falling at 3.7% in August, down from a peak of 9.1% seen in June last year.
Labor market strength has also played a key role. The unemployment rate hovers near five-decade lows, and wage growth remains above historical averages at 4.3% annually as of August.
Despite 11 interest rate hikes since March 2022, consumer spending remains strong, although savings have declined considerably over the year. Household spending makes up roughly two-thirds of U.S. GDP, a key driver of economic output.
Together, these factors, among others, are influencing investor sentiment. Some may argue that investors are complacent as economic data could be weakening, but so far the resilience of the economy is supporting lower market volatility.


Markets in a Minute
The Top 5 Reasons Clients Fire a Financial Advisor
Firing an advisor is often driven by more than cost and performance factors. Here are the top reasons clients ‘break up’ with their advisors.

The Top 5 Reasons Clients Fire a Financial Advisor
What drives investors to fire a financial advisor?
From saving for a down payment to planning for retirement, clients turn to advisors to guide them through life’s complex financial decisions. However, many of the key reasons for firing a financial advisor stem from emotional factors, and go beyond purely financial motivations.
We partnered with Morningstar to show the top reasons clients fire an advisor to provide insight on what’s driving investor behavior.
What Drives Firing Decisions?
Here are the top reasons clients terminated their advisor, based on a survey of 184 respondents:
| Reason for Firing | % of Respondents Citing This Reason | Type of Motivation |
|---|---|---|
| Quality of financial advice and services | 32% | Emotion-based reason |
| Quality of relationship | 21% | Emotion-based reason |
| Cost of services | 17% | Financial-based reason |
| Return performance | 11% | Financial-based reason |
| Comfort handling financial issues on their own | 10% | Emotion-based reason |
Numbers may not total 100 due to rounding. Respondents could select more than one answer.
Numbers may not total 100 due to rounding. Respondents could select more than one answer.
While firing an advisor is rare, many of the primary drivers behind firing decisions are also emotionally driven.
Often, advisors were fired due to the quality of the relationship. In many cases, this was due to an advisor not dedicating enough time to fully grasp their personal financial goals. Additionally, wealthier, and more financially literate clients are more likely to fire their advisors—highlighting the importance of understanding the client.
Key Takeaways
Given these driving factors, here are five ways that advisors can build a lasting relationship through recognizing their clients’ emotional needs:
- Understand your clients’ deeper goals
- Reach out proactively
- Act as a financial coach
- Keep clients updated
- Conduct goal-setting exercises on a regular basis
By communicating their value and setting expectations early, advisors can help prevent setbacks in their practice by adeptly recognizing the emotional motivators of their clients.
Markets in a Minute
The Top 5 Reasons Clients Hire a Financial Advisor
Here are the most common drivers for hiring a financial advisor, revealing that investor motivations go beyond just financial factors.

The Top 5 Reasons Clients Hire a Financial Advisor
What drives investors to hire a financial advisor?
From saving for a down payment to planning for retirement, clients turn to advisors to guide them through life’s complex financial decisions. However, many of the key reasons for hiring a financial advisor stem from emotional factors, and go beyond purely financial motivations.
We partnered with Morningstar to show the top reasons clients hire a financial advisor to provide insight on what’s driving investor behavior.
What Drives Hiring Decisions?
Here are the most common reasons for hiring an advisor, based on a survey of 312 respondents.
| Reason for Hiring | % of Respondents Citing This Reason | Type of Motivation |
|---|---|---|
| Specific goals or needs | 32% | Financial-based reason |
| Discomfort handling finances | 32% | Emotion-based reason |
| Behavioral coaching | 17% | Emotion-based reason |
| Recommended by family or friends | 12% | Emotion-based reason |
| Quality of relationship | 10% | Emotion-based reason |
Numbers may not total 100 due to rounding. Respondents could select more than one answer.
While financial factors played an important role in hiring decisions, emotional reasons made up the largest share of total responses.
This illustrates that clients place a high degree of importance on reaching specific goals or needs, and how an advisor communicates with them. Furthermore, clients seek out advisors for behavioral coaching to help them make informed decisions while staying the course.
Key Takeaways
With this in mind, here are five ways advisors can provide value to their clients and grow their practice:
- Address clients’ emotional needs early on
- Demonstrate how you can offer support
- Use ordinary language
- Provide education to help clients stay on track
- Acknowledge that these are issues we all face
By addressing emotional factors, advisors can more effectively help clients’ navigate intricate financial decisions and avoid common behavioral mistakes.

The Top 5 Reasons Clients Fire a Financial Advisor

The Top 5 Reasons Clients Hire a Financial Advisor

Visualizing the Growth of $100, by Asset Class

How Small Investments Make a Big Impact Over Time

What Were the Top Performing Investment Themes of 2023?
-

 Infographics2 years ago
The Top Investment Quotes Every Investor Should Know
-

 Markets in a Minute2 years ago
Mapped: The Growth in U.S. House Prices by State
-

 Markets in a Minute2 years ago
How Closely Related Are Historical Mortgage Rates and Housing Prices?
-

 Infographics2 years ago
A Visual Guide to Stagflation, Inflation, and Deflation
-

 Markets in a Minute1 year ago
Mapped: Global Energy Prices, by Country in 2022
-

 Markets in a Minute2 years ago
Visualizing Historical Oil Prices (1968-2022)
-

 Infographics1 year ago
Visual Guide: The Three Types of Economic Indicators
-

 Markets in a Minute2 years ago
Mapped: Global Macroeconomic Risk, by Country in 2022
