
Markets in a Minute
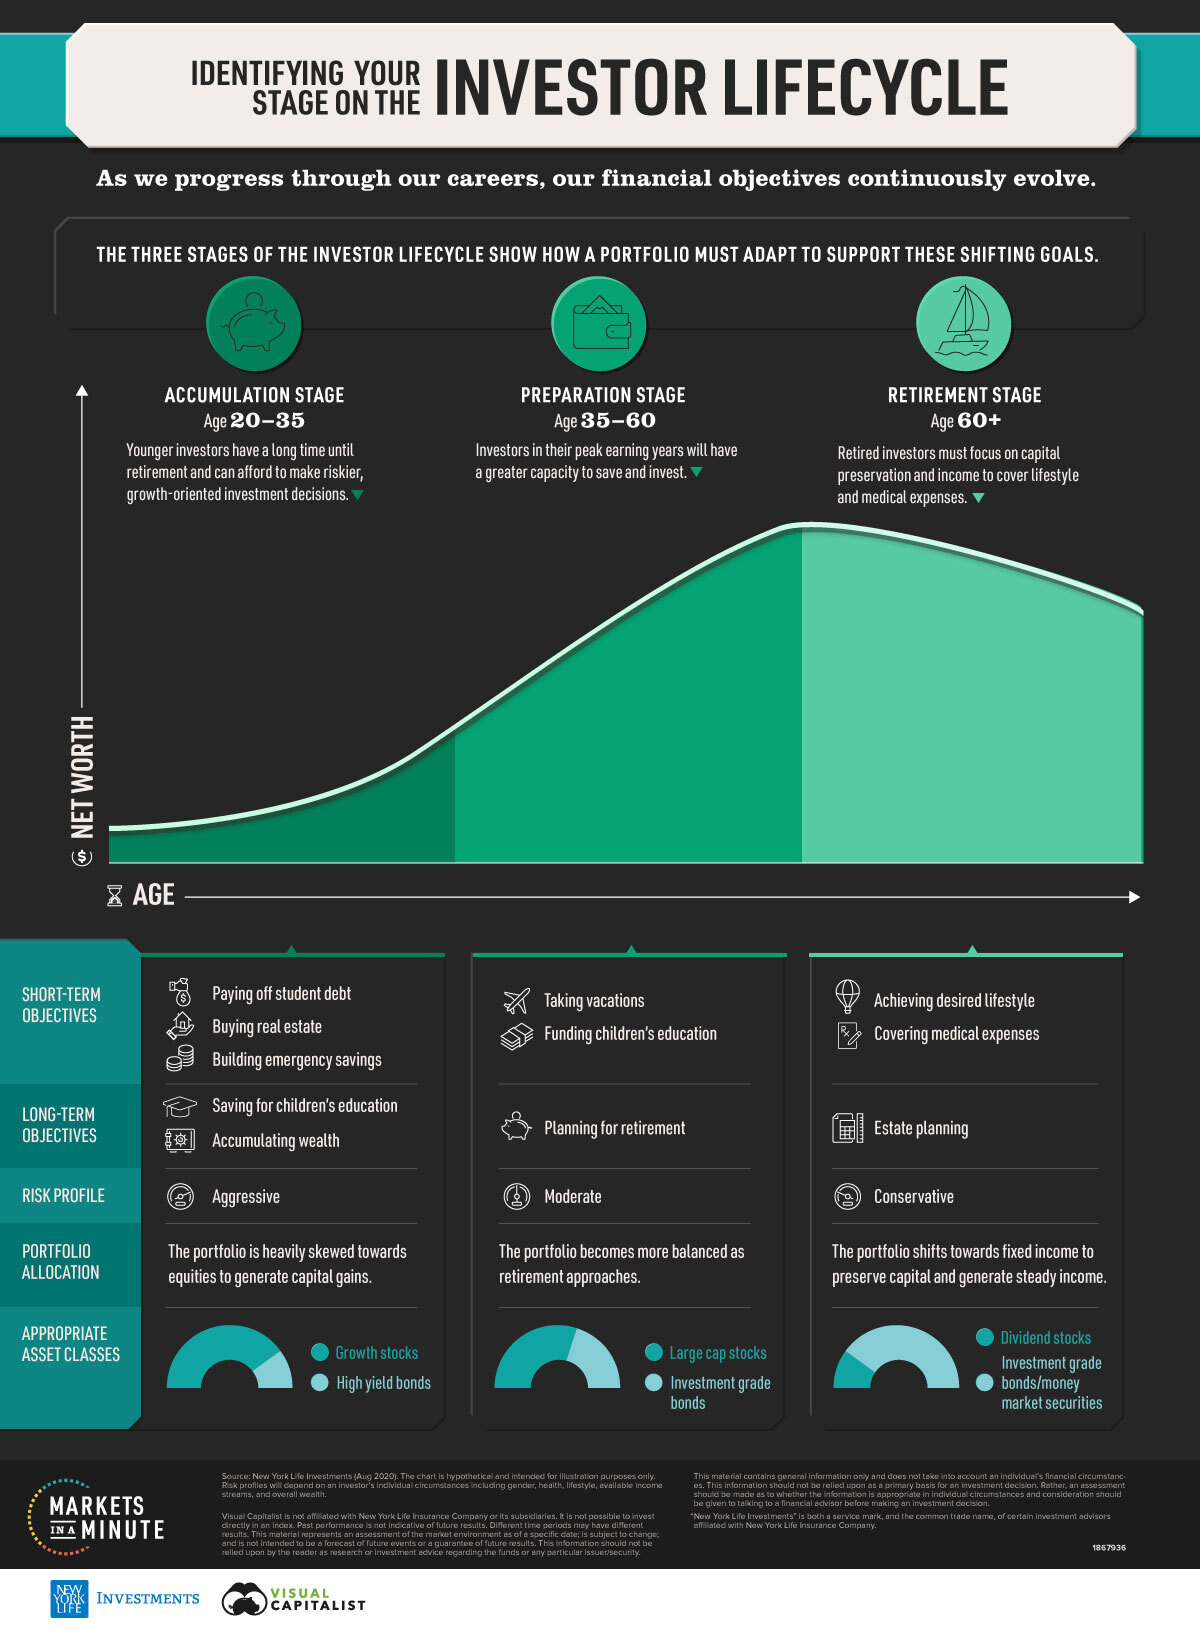
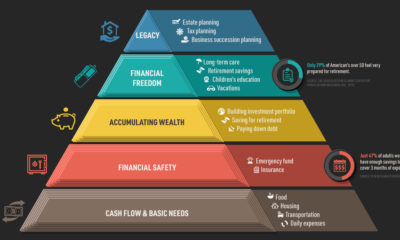
Identifying Your Stage on the Investor Lifecycle
This Markets in a Minute Chart is available as a poster.
This Markets in a Minute Chart is available as a poster.
Identifying Your Stage on the Investor Lifecycle
As people age and progress through their careers, their financial goals continuously evolve. Understanding one’s current goals, while also planning for those in the future, are two important elements of financial planning.
In this Markets in a Minute chart from New York Life Investments, we outline the investor lifecycle, a three-staged theory designed to help individuals optimize their portfolios as they age.
The Three Stages
Each lifecycle stage is associated with a set of distinct objectives that, when incorporated into a long-term investment plan, will guide the investor through to retirement.
| Lifecycle Stage | Common Short-term Objectives | Common Long-term Objectives | |
|---|---|---|---|
| Accumulation Stage (Ages 20-35) | - Paying off student debt - Buying real estate - Building emergency savings | - Saving for children's education - Accumulating wealth | |
| Preparation Stage (Ages 35-60) | - Taking vacations - Funding children's education | - Planning for retirement | |
| Retirement Stage (Ages 60+) | - Achieving desired lifestyle - Covering medical expenses | - Estate planning |
These age-sensitive objectives will ultimately shape an investor’s risk profile and portfolio allocations.
The Accumulation Stage
Individuals in the accumulation stage are just beginning their careers, meaning they have a relatively low net worth and a long time horizon until retirement.
With over 30+ working years ahead of them, it’s often an ideal time for these investors to build more aggressive portfolios geared towards capital gains. In practice, this usually results in a significant allocation to equities.
This is because equities boast a relatively higher return potential, making them suitable for younger investors looking to accumulate wealth. Their long time horizons also allow them to ride out periods of short-term volatility that equity markets sometimes experience.
The Preparation Stage
Individuals in the preparation stage will likely reach their peak earning years, and as a result, will have a greater capacity to save and invest.
Getting the most out of this capacity will require these investors to establish a long-term financial plan centered around retirement. Because they now face a shorter time horizon, they may want to consider a more balanced risk profile.
While equities may still play a major role in these individuals’ portfolios, the asset class’s overall allocation is often dialed back in favor of safer securities such as investment-grade bonds.
The Retirement Stage
As individuals begin to retire, their risk profiles typically become more conservative. Capital preservation and steady income are the top priorities, and in most cases, portfolios become predominantly weighted towards fixed income and money market securities.
Retirees may want to retain an allocation to equities, however. The possibility of outliving one’s savings, also known as longevity risk, is a real possibility—especially given the higher medical costs associated with old age:
| Age Group | Average Annual Healthcare Spending ($) |
|---|---|
| 0-18 | $3,749 |
| 19-44 | $4,856 |
| 45-64 | $10,212 |
| 65-84 | $16,977 |
| 85+ | $32,903 |
Source: Peter G. Peterson Foundation
According to the data, the average American experiences a sharp increase in medical costs once past the age of 45. This could spell the need for returns higher than what is provided by a fixed income-only portfolio. Maintaining exposure to equities—an asset class that has historically generated higher returns than fixed income—could help to mitigate longevity risk.
Putting It All Together
According to the investor lifecycle, a typical portfolio will transition through three broad stages over one’s lifetime. At each consecutive stage, the types of assets used should be adjusted to reflect the investor’s shifting risk profile.
By the final retirement stage, the appetite for risk is often low, and the core of a portfolio will be typically comprised of high quality, income-oriented investments. Careful monitoring of income and expenditures will also be required to reduce longevity risk.
While unique circumstances can sometimes warrant a deviation from the three stage lifecycle, its underlying theme still holds true—an investment portfolio should always be optimized to support one’s goals.


Markets in a Minute
The Top 5 Reasons Clients Fire a Financial Advisor
Firing an advisor is often driven by more than cost and performance factors. Here are the top reasons clients ‘break up’ with their advisors.

The Top 5 Reasons Clients Fire a Financial Advisor
What drives investors to fire a financial advisor?
From saving for a down payment to planning for retirement, clients turn to advisors to guide them through life’s complex financial decisions. However, many of the key reasons for firing a financial advisor stem from emotional factors, and go beyond purely financial motivations.
We partnered with Morningstar to show the top reasons clients fire an advisor to provide insight on what’s driving investor behavior.
What Drives Firing Decisions?
Here are the top reasons clients terminated their advisor, based on a survey of 184 respondents:
| Reason for Firing | % of Respondents Citing This Reason | Type of Motivation |
|---|---|---|
| Quality of financial advice and services | 32% | Emotion-based reason |
| Quality of relationship | 21% | Emotion-based reason |
| Cost of services | 17% | Financial-based reason |
| Return performance | 11% | Financial-based reason |
| Comfort handling financial issues on their own | 10% | Emotion-based reason |
Numbers may not total 100 due to rounding. Respondents could select more than one answer.
Numbers may not total 100 due to rounding. Respondents could select more than one answer.
While firing an advisor is rare, many of the primary drivers behind firing decisions are also emotionally driven.
Often, advisors were fired due to the quality of the relationship. In many cases, this was due to an advisor not dedicating enough time to fully grasp their personal financial goals. Additionally, wealthier, and more financially literate clients are more likely to fire their advisors—highlighting the importance of understanding the client.
Key Takeaways
Given these driving factors, here are five ways that advisors can build a lasting relationship through recognizing their clients’ emotional needs:
- Understand your clients’ deeper goals
- Reach out proactively
- Act as a financial coach
- Keep clients updated
- Conduct goal-setting exercises on a regular basis
By communicating their value and setting expectations early, advisors can help prevent setbacks in their practice by adeptly recognizing the emotional motivators of their clients.
Markets in a Minute
The Top 5 Reasons Clients Hire a Financial Advisor
Here are the most common drivers for hiring a financial advisor, revealing that investor motivations go beyond just financial factors.

The Top 5 Reasons Clients Hire a Financial Advisor
What drives investors to hire a financial advisor?
From saving for a down payment to planning for retirement, clients turn to advisors to guide them through life’s complex financial decisions. However, many of the key reasons for hiring a financial advisor stem from emotional factors, and go beyond purely financial motivations.
We partnered with Morningstar to show the top reasons clients hire a financial advisor to provide insight on what’s driving investor behavior.
What Drives Hiring Decisions?
Here are the most common reasons for hiring an advisor, based on a survey of 312 respondents.
| Reason for Hiring | % of Respondents Citing This Reason | Type of Motivation |
|---|---|---|
| Specific goals or needs | 32% | Financial-based reason |
| Discomfort handling finances | 32% | Emotion-based reason |
| Behavioral coaching | 17% | Emotion-based reason |
| Recommended by family or friends | 12% | Emotion-based reason |
| Quality of relationship | 10% | Emotion-based reason |
Numbers may not total 100 due to rounding. Respondents could select more than one answer.
While financial factors played an important role in hiring decisions, emotional reasons made up the largest share of total responses.
This illustrates that clients place a high degree of importance on reaching specific goals or needs, and how an advisor communicates with them. Furthermore, clients seek out advisors for behavioral coaching to help them make informed decisions while staying the course.
Key Takeaways
With this in mind, here are five ways advisors can provide value to their clients and grow their practice:
- Address clients’ emotional needs early on
- Demonstrate how you can offer support
- Use ordinary language
- Provide education to help clients stay on track
- Acknowledge that these are issues we all face
By addressing emotional factors, advisors can more effectively help clients’ navigate intricate financial decisions and avoid common behavioral mistakes.

The Top 5 Reasons Clients Fire a Financial Advisor

The Top 5 Reasons Clients Hire a Financial Advisor

Visualizing the Growth of $100, by Asset Class

How Small Investments Make a Big Impact Over Time

What Were the Top Performing Investment Themes of 2023?
-

 Infographics2 years ago
The Top Investment Quotes Every Investor Should Know
-

 Markets in a Minute2 years ago
Mapped: The Growth in U.S. House Prices by State
-

 Markets in a Minute2 years ago
How Closely Related Are Historical Mortgage Rates and Housing Prices?
-

 Infographics2 years ago
A Visual Guide to Stagflation, Inflation, and Deflation
-

 Markets in a Minute1 year ago
Mapped: Global Energy Prices, by Country in 2022
-

 Markets in a Minute2 years ago
Visualizing Historical Oil Prices (1968-2022)
-

 Infographics1 year ago
Visual Guide: The Three Types of Economic Indicators
-

 Markets in a Minute2 years ago
Mapped: Global Macroeconomic Risk, by Country in 2022
