


Global inflation projections look optimistic in 2024, but risks of a second wave of price pressures remain due to geopolitical shocks.


Will global GDP growth continue to be resilient in 2024? This graphic shows the economic outlook for 191 economies around the world.


This graphic shows the return expectation gap between investors and advisors around the world, revealing a range of market outlooks.
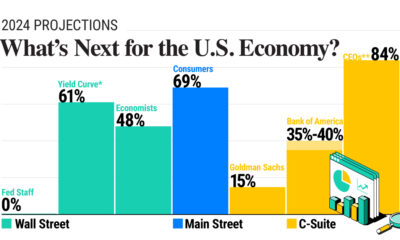

In this graphic, we show U.S. economic forecasts across Wall Street, Main Street, and C-Suite amid mixed signals in the economy.
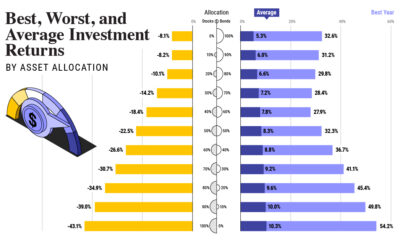

How have investment returns for different portfolio allocations of stocks and bonds compared over the last 90 years?
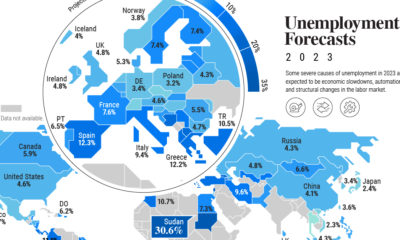

Unemployment is forecast to tick higher in 2023, but so far red-hot labor markets are resisting this trend on a global scale.


From GDP to interest rates, this infographic shows key economic indicators for navigating the massive U.S. economy.
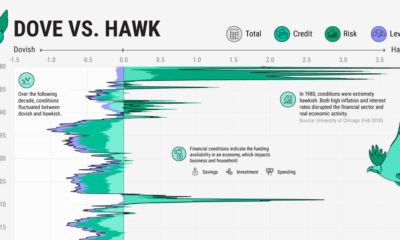

We show the Financial Conditions Index, which breaks down the state of U.S. financial markets based on 105 indicators.
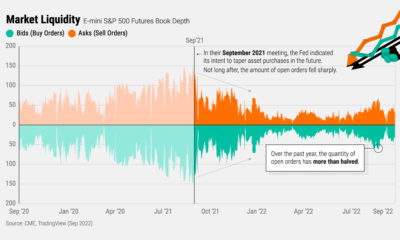

Interest rate hikes and quantitative tightening are reducing liquidity and raising volatility in markets, but why exactly does this happen?

The target interest rate could rise more than 3% by 2023. Here's how rising interest rates impact the economy and your investments.


