
Markets in a Minute
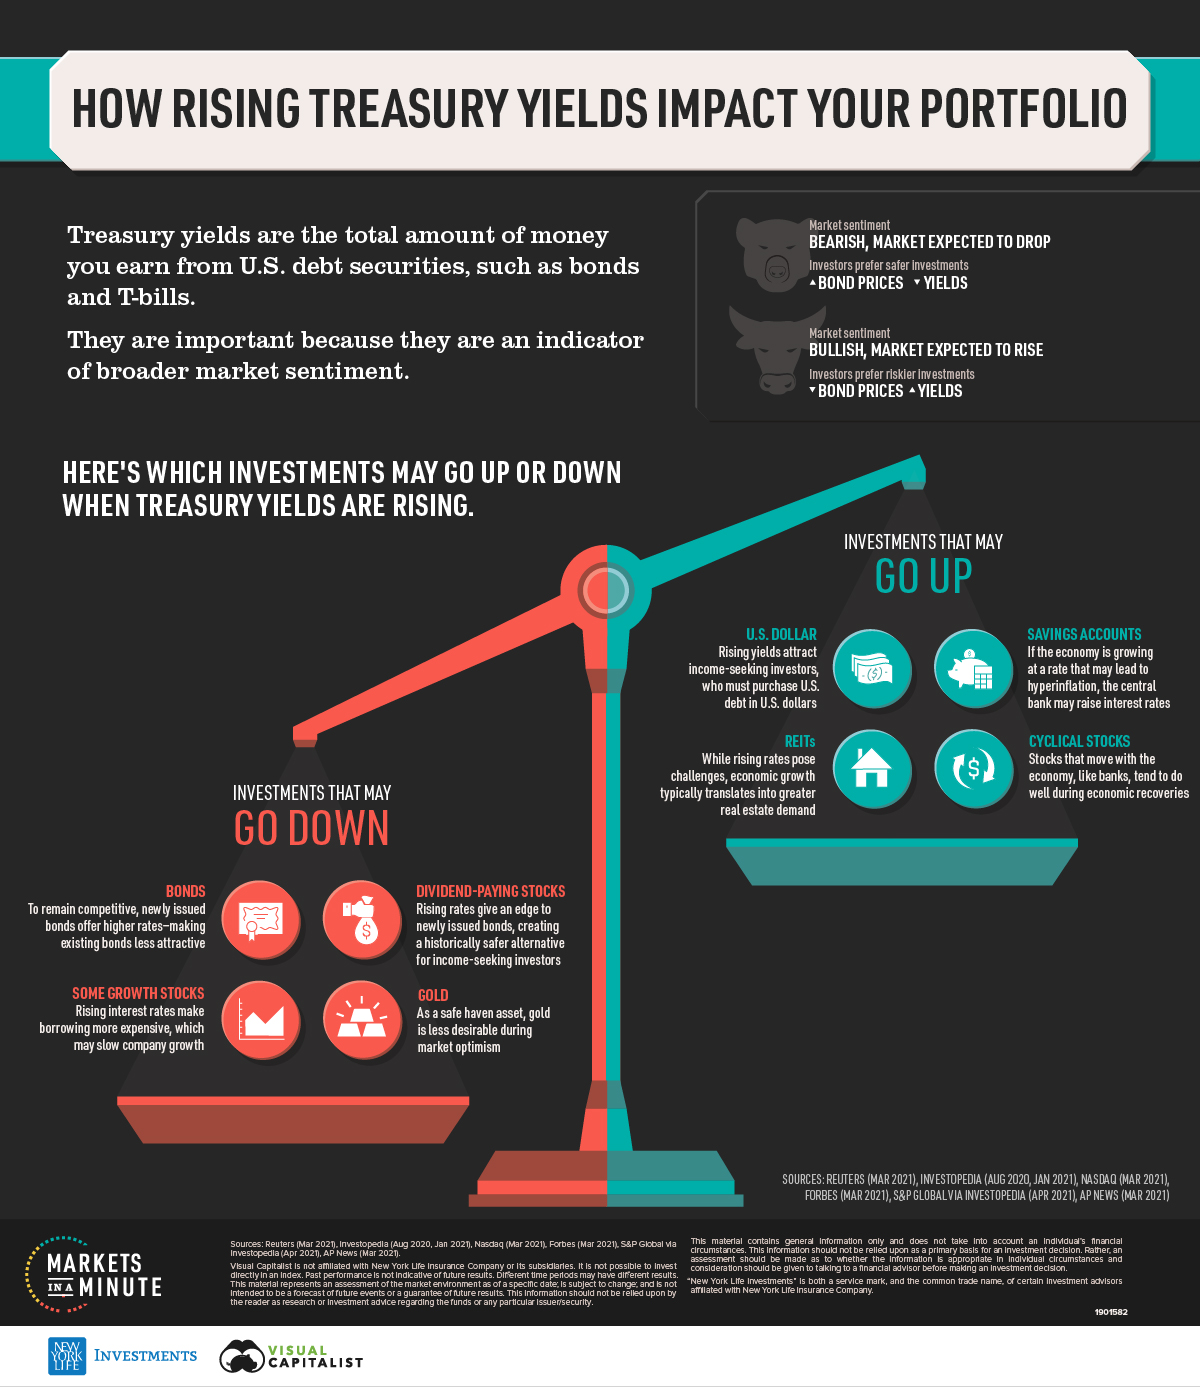
How Rising Treasury Yields Impact Your Portfolio
This infographic is available as a poster.
This infographic is available as a poster.
How Rising Treasury Yields Impact Your Portfolio
Since the start of 2021, the yield on the U.S. 10-year Treasury note has climbed to pre-pandemic levels. But what exactly does this mean, and how could it impact your portfolio?
In this Markets in a Minute from New York Life Investments, we explain why Treasury yields are important and which investments may go up or down when yields are rising.
What are Treasury Yields?
Treasury yields are the total amount of money you earn from U.S. debt securities, such as bonds and T-bills. Yields depend on both the security’s price, relative to its face value, and its “coupon” or interest payment.
The 10-year yield is important because it is closely-watched indication of market sentiment. Here’s what leads to changing Treasury yields:
- When investors expect the market to drop, they look for safer investments.
- Due to higher bond demand, prices rise.
- This lowers their yield, as bonds become more expensive than they were before.
The opposite occurs when the market is bullish.
- When investors expect the market to rise, they look for riskier investments.
- Due to less bond demand, prices drop.
- This raises their yield, as bonds become more cost effective.
Currently, Treasury yields are in the latter scenario because investors are confident in a sustained recovery as vaccines are rolled out and the economy reopens.
Investments That May Go Up During Rising Yields
Rising yields can have a number of knock-on effects in the market. Here are the investments that could increase in value when yields are going up.
| Investment | Why could returns potentially increase? |
|---|---|
| U.S. dollar | Rising yields attract income-seeking investors, who must purchase U.S. debt in U.S. dollars |
| Savings accounts | If the economy is growing at a rate that may lead to hyperinflation, the central bank may raise interest rates |
| REITs | While rising rates pose challenges, economic growth typically translates into a higher level of real estate demand |
| Cyclical stocks | Stocks that move with the economy, like banks, tend to do well during economic recoveries |
Cyclical stocks, such as banks, travel, and energy, may all benefit from an economic recovery. This is particularly true for banks if the economy is growing at a rate that exceeds inflation targets, as the central bank may raise interest rates. In turn, this allows banks to earn a higher profit margin because they can charge a higher rate on their loans.
While it is commonly said that real estate investment trusts (REITs) underperform during rising interest rates, the data tells a different story. In four of six periods of sustained rising yields, REITs earned positive returns—and they outperformed stocks in half of them.
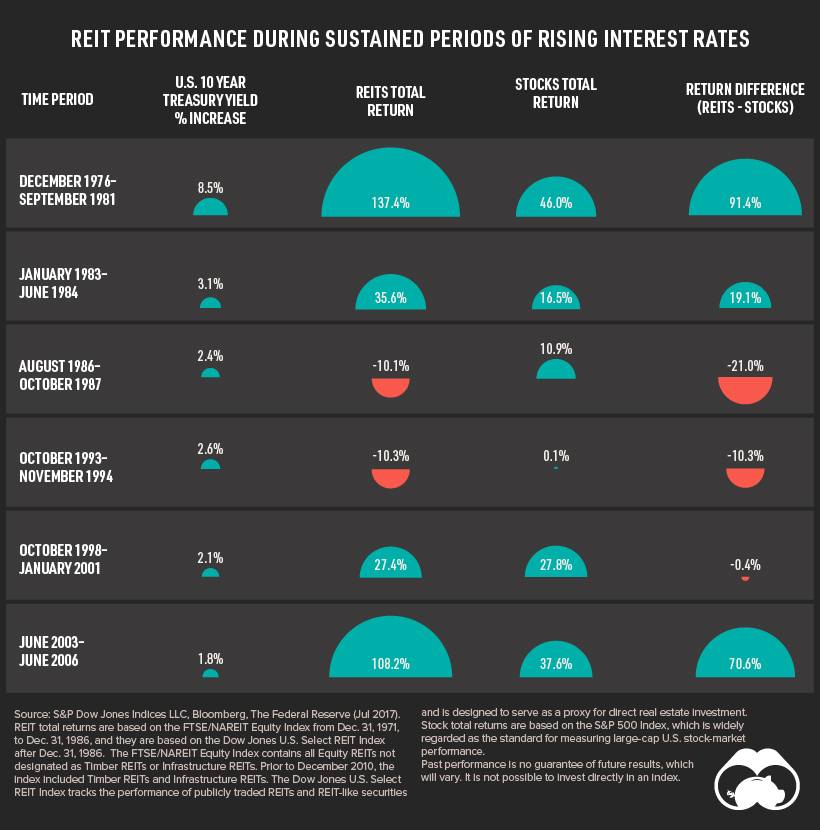
Source: S&P Dow Jones Indices
Rising rates do pose challenges, including higher borrowing costs and lower property values.
However, it’s evident that rising rates also have a positive influence on REITs. For instance, rising rates are typically associated with economic growth, which translates to higher real estate demand and higher occupancy rates. This means REITs can see increased earnings and dividends.
Investments That May Go Down During Rising Yields
On the flip side, there are some investments that could decrease in value when yields climb.
| Investment | Why could returns potentially decrease? |
|---|---|
| Bonds | To remain competitive, newly issued bonds offer higher interest rates—making existing bonds less attractive |
| Dividend-paying stocks | Rising rates give an edge to newly issued bonds, creating a historically safer alternative for income-seeking investors |
| Gold | As a safe haven asset, gold is less desirable during market optimism |
| Some growth stocks | Rising interest rates make borrowing more expensive, which may slow company growth |
Existing bonds will likely see declining performance, with higher volatility among long-term government and corporate bonds. Short-term bonds typically see smaller drops. This is because they have less interest rate risk: there’s a smaller probability that interest rates will rise before a short-term bond’s maturity, and they have fewer interest payments that could be affected by rising rates.
Growth stocks, such as those in the technology sector, may also see weaker performance. In fact, value stocks have been outperforming growth stocks since the fourth quarter of 2020, a significant shift from growth’s strong historical performance in recent years.
U.S. Treasury Yields: One Part of the Picture
In addition to being a barometer for investor confidence, Treasury yields can have an important impact on your portfolio.
However, investment performance can vary depending on a number of other economic factors such as inflation and interest rate levels. For example, climbing inflation could lead to higher gold prices, since gold is seen as an inflationary hedge. You may want to consider the full economic picture when you are reviewing your portfolio.


Markets in a Minute
The Top 5 Reasons Clients Fire a Financial Advisor
Firing an advisor is often driven by more than cost and performance factors. Here are the top reasons clients ‘break up’ with their advisors.

The Top 5 Reasons Clients Fire a Financial Advisor
What drives investors to fire a financial advisor?
From saving for a down payment to planning for retirement, clients turn to advisors to guide them through life’s complex financial decisions. However, many of the key reasons for firing a financial advisor stem from emotional factors, and go beyond purely financial motivations.
We partnered with Morningstar to show the top reasons clients fire an advisor to provide insight on what’s driving investor behavior.
What Drives Firing Decisions?
Here are the top reasons clients terminated their advisor, based on a survey of 184 respondents:
| Reason for Firing | % of Respondents Citing This Reason | Type of Motivation |
|---|---|---|
| Quality of financial advice and services | 32% | Emotion-based reason |
| Quality of relationship | 21% | Emotion-based reason |
| Cost of services | 17% | Financial-based reason |
| Return performance | 11% | Financial-based reason |
| Comfort handling financial issues on their own | 10% | Emotion-based reason |
Numbers may not total 100 due to rounding. Respondents could select more than one answer.
Numbers may not total 100 due to rounding. Respondents could select more than one answer.
While firing an advisor is rare, many of the primary drivers behind firing decisions are also emotionally driven.
Often, advisors were fired due to the quality of the relationship. In many cases, this was due to an advisor not dedicating enough time to fully grasp their personal financial goals. Additionally, wealthier, and more financially literate clients are more likely to fire their advisors—highlighting the importance of understanding the client.
Key Takeaways
Given these driving factors, here are five ways that advisors can build a lasting relationship through recognizing their clients’ emotional needs:
- Understand your clients’ deeper goals
- Reach out proactively
- Act as a financial coach
- Keep clients updated
- Conduct goal-setting exercises on a regular basis
By communicating their value and setting expectations early, advisors can help prevent setbacks in their practice by adeptly recognizing the emotional motivators of their clients.
Markets in a Minute
The Top 5 Reasons Clients Hire a Financial Advisor
Here are the most common drivers for hiring a financial advisor, revealing that investor motivations go beyond just financial factors.

The Top 5 Reasons Clients Hire a Financial Advisor
What drives investors to hire a financial advisor?
From saving for a down payment to planning for retirement, clients turn to advisors to guide them through life’s complex financial decisions. However, many of the key reasons for hiring a financial advisor stem from emotional factors, and go beyond purely financial motivations.
We partnered with Morningstar to show the top reasons clients hire a financial advisor to provide insight on what’s driving investor behavior.
What Drives Hiring Decisions?
Here are the most common reasons for hiring an advisor, based on a survey of 312 respondents.
| Reason for Hiring | % of Respondents Citing This Reason | Type of Motivation |
|---|---|---|
| Specific goals or needs | 32% | Financial-based reason |
| Discomfort handling finances | 32% | Emotion-based reason |
| Behavioral coaching | 17% | Emotion-based reason |
| Recommended by family or friends | 12% | Emotion-based reason |
| Quality of relationship | 10% | Emotion-based reason |
Numbers may not total 100 due to rounding. Respondents could select more than one answer.
While financial factors played an important role in hiring decisions, emotional reasons made up the largest share of total responses.
This illustrates that clients place a high degree of importance on reaching specific goals or needs, and how an advisor communicates with them. Furthermore, clients seek out advisors for behavioral coaching to help them make informed decisions while staying the course.
Key Takeaways
With this in mind, here are five ways advisors can provide value to their clients and grow their practice:
- Address clients’ emotional needs early on
- Demonstrate how you can offer support
- Use ordinary language
- Provide education to help clients stay on track
- Acknowledge that these are issues we all face
By addressing emotional factors, advisors can more effectively help clients’ navigate intricate financial decisions and avoid common behavioral mistakes.

The Top 5 Reasons Clients Fire a Financial Advisor

The Top 5 Reasons Clients Hire a Financial Advisor

Visualizing the Growth of $100, by Asset Class

How Small Investments Make a Big Impact Over Time

What Were the Top Performing Investment Themes of 2023?
-

 Infographics2 years ago
The Top Investment Quotes Every Investor Should Know
-

 Markets in a Minute2 years ago
Mapped: The Growth in U.S. House Prices by State
-

 Markets in a Minute2 years ago
How Closely Related Are Historical Mortgage Rates and Housing Prices?
-

 Infographics2 years ago
A Visual Guide to Stagflation, Inflation, and Deflation
-

 Markets in a Minute1 year ago
Mapped: Global Energy Prices, by Country in 2022
-

 Infographics3 years ago
The 5 Fastest Growing Industries of the Next Decade
-

 Markets in a Minute2 years ago
Visualizing Historical Oil Prices (1968-2022)
-

 Infographics1 year ago
Visual Guide: The Three Types of Economic Indicators
