
Markets in a Minute
The Most Profitable U.S. Companies, by Sector
The Most Profitable U.S. Companies, by Sector
U.S. corporate profits hit record levels in 2022, even as stocks fell into a bear market and inflation reached 40-year highs.
Given these headwinds, investors are watching corporate fundamentals very closely. Corporate profit margins provide a buffer against higher borrowing costs and price pressures and for many reasons, they are a key measure of financial health.
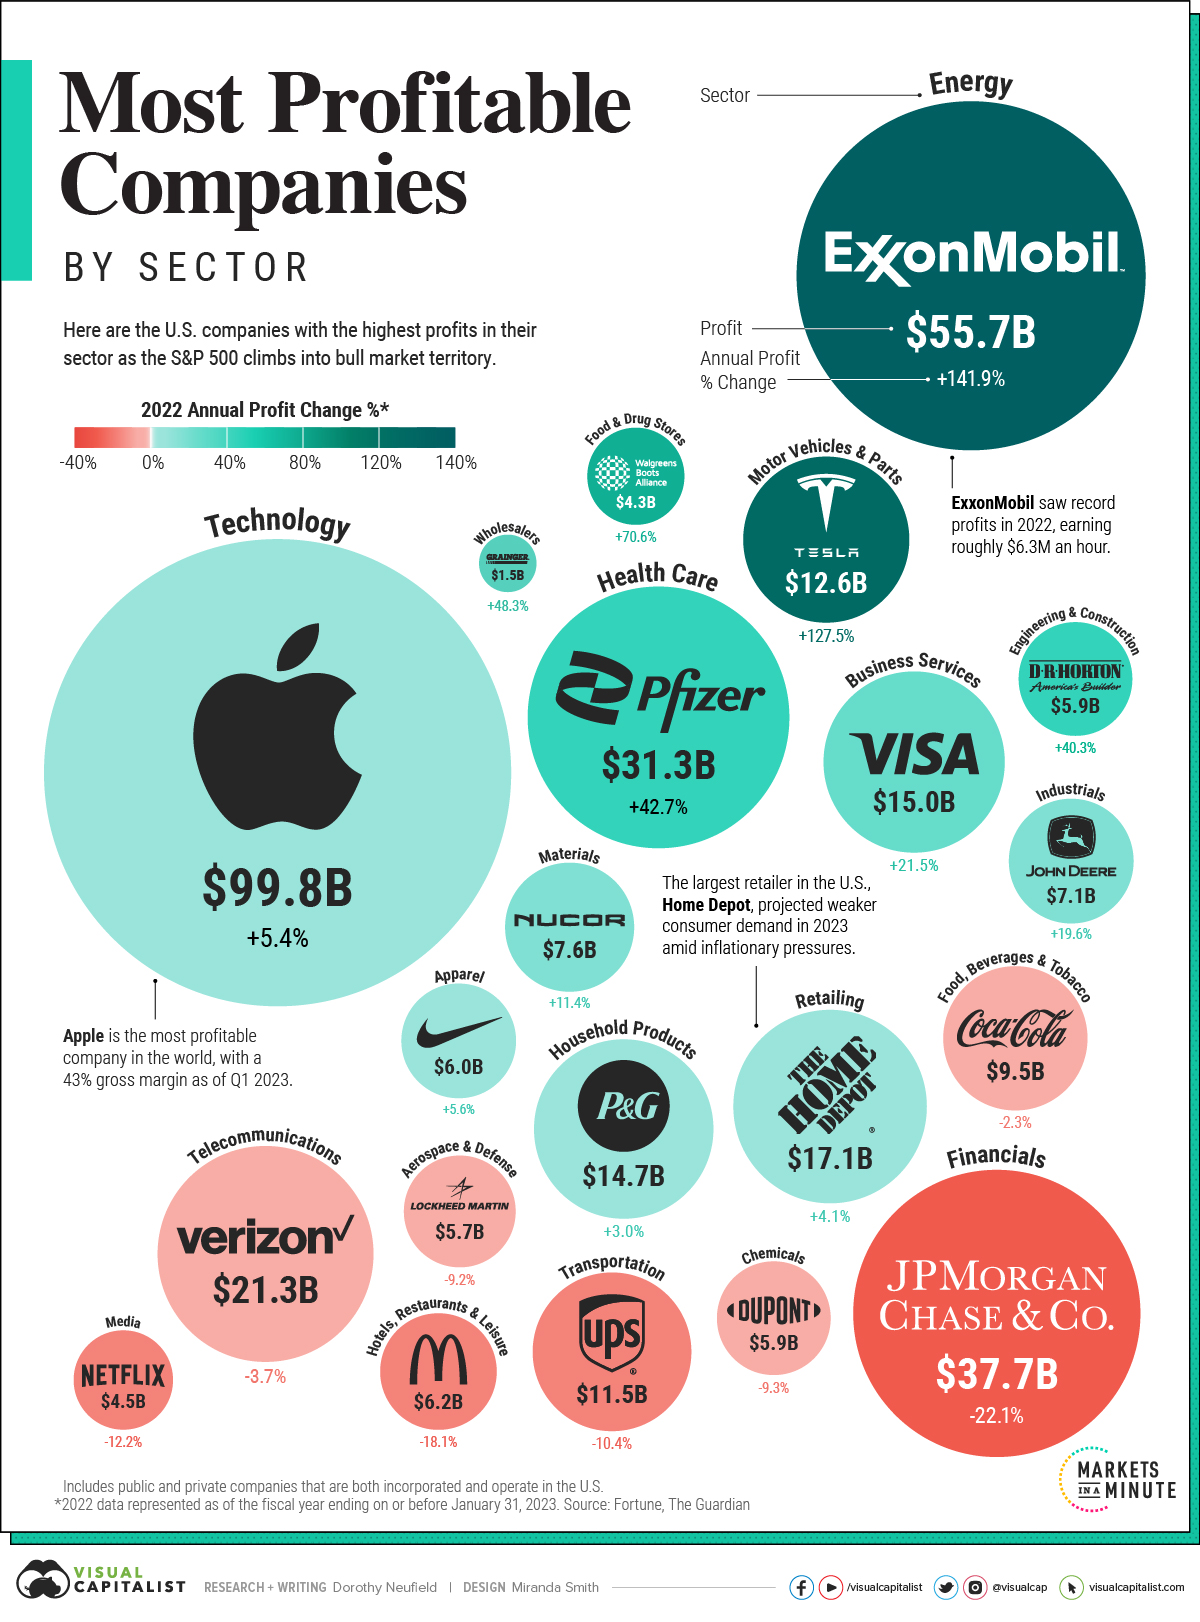
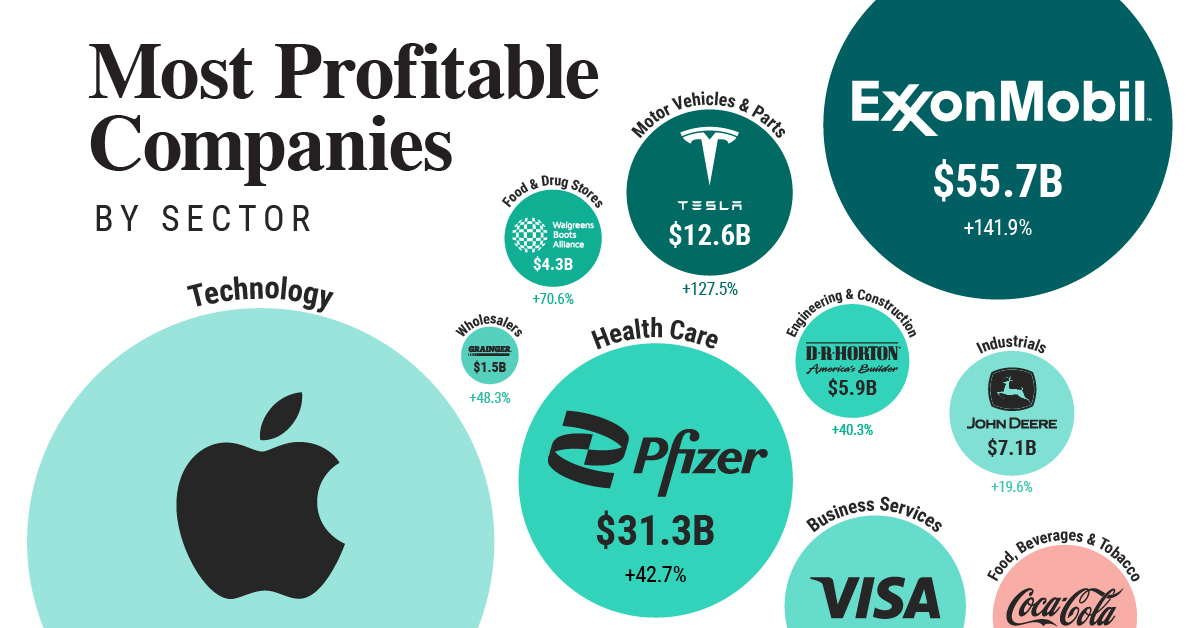
This graphic shows America’s most profitable companies by sector, using data from Fortune.
America’s Most Profitable Companies
Here are the U.S. firms with the highest annual profits in their sector. Data is based on the fiscal year ending on or before January 31, 2023 across companies in the Fortune 500.
Both public and private companies that are incorporated and operate in the U.S. are included.
| Company | Sector | 2022 Annual Profit | Annual % Change |
|---|---|---|---|
| Apple | Technology | $99.8B | 5.4% |
| Exxon Mobil | Energy | $55.7B | 141.9% |
| JPMorgan Chase | Financials | $37.7B | -22.1% |
| Pfizer | Health Care | $31.3B | 42.7% |
| Verizon Communications | Telecommunications | $21.3B | -3.7% |
| Home Depot | Retailing | $17.1B | 4.1% |
| Visa | Business Services | $15.0B | 21.5% |
| Procter & Gamble | Household Products | $14.7B | 3.0% |
| Tesla | Motor Vehicles & Parts | $12.6B | 127.5% |
| UPS | Transportation | $11.5B | -10.4% |
| Coca-Cola | Food, Beverages & Tobacco | $9.5B | -2.3% |
| Nucor | Materials | $7.6B | 11.4% |
| Deere | Industrials | $7.1B | 19.6% |
| McDonald's | Hotels, Restaurants & Leisure | $6.2B | -18.1% |
| Nike | Apparel | $6.0B | 5.6% |
| DuPont | Chemicals | $5.9B | -9.3% |
| D.R. Horton | Engineering & Construction | $5.9B | 40.3% |
| Lockheed Martin | Aerospace & Defense | $5.7B | -9.2% |
| Netflix | Media | $4.5B | -12.2% |
| Walgreens Boots Alliance | Food & Drug Stores | $4.3B | 70.6% |
| W.W. Grainger | Wholesalers | $1.5B | 48.3% |
Apple is the most profitable company in America. Reaching almost $100 billion in profits in 2022, it outpaces the profit leaders in both the energy and financials sectors combined. Furthermore, at the end of 2022, its net profit margin stood at nearly 25%.
Amid a maturing smartphone market, the company is focusing more on service-based revenue. iPhones make up roughly half of its total net sales, yet growth is plateauing. Last year, iPhone sales growth was 7%, compared to 39% the year before. Meanwhile, services sales—including cloud, AppleCare, and advertising—increased 14% annually.
Within the energy sector, Exxon Mobil took the top spot with record profits of over $55 billion. Profits jumped almost 142% last year as oil prices spiked with Russia’s invasion of Ukraine. Steep cuts in costs through the pandemic also helped to bolster the company’s returns.
JPMorgan Chase saw the highest profits in the financial sector. As the nation’s largest bank by assets, it saw a sharp decline in its investment banking division as higher interest rates made financing mergers and acquisitions less lucrative. Overall, profits sank more than 22% annually.
Corporate Profits in Perspective
Low taxes and interest rates contributed to about one-third of profit growth across nonfinancial companies in the S&P 500 over the last 20 years, a paper from the Federal Reserve shows.
Now, as interest rates climb higher, steeper costs could cut into bottom lines. The good news is so far, corporations have shown resilience to a shifting interest rate regime. In the first quarter of 2023, U.S. corporate profits fell moderately by just over 5%.
Profitability and Competitive Advantage
What does this mean for investors?
For investors looking for companies that can weather higher rates, profitability is one factor to consider. Companies with strong profitability can reinvest in their business, pay dividends, and better withstand road bumps from rising costs.
Going further, companies with high profitability often have a strong market share thanks to economies of scale lowering costs, brand loyalty driving demand, and economic moats. We can see this with Apple and Visa, for example.
Over time, this builds a sustainable competitive advantage. As companies preserve profitability, it adds value to shareholders, often supporting share prices over the longer-term.


Markets in a Minute
The Top 5 Reasons Clients Fire a Financial Advisor
Firing an advisor is often driven by more than cost and performance factors. Here are the top reasons clients ‘break up’ with their advisors.

The Top 5 Reasons Clients Fire a Financial Advisor
What drives investors to fire a financial advisor?
From saving for a down payment to planning for retirement, clients turn to advisors to guide them through life’s complex financial decisions. However, many of the key reasons for firing a financial advisor stem from emotional factors, and go beyond purely financial motivations.
We partnered with Morningstar to show the top reasons clients fire an advisor to provide insight on what’s driving investor behavior.
What Drives Firing Decisions?
Here are the top reasons clients terminated their advisor, based on a survey of 184 respondents:
| Reason for Firing | % of Respondents Citing This Reason | Type of Motivation |
|---|---|---|
| Quality of financial advice and services | 32% | Emotion-based reason |
| Quality of relationship | 21% | Emotion-based reason |
| Cost of services | 17% | Financial-based reason |
| Return performance | 11% | Financial-based reason |
| Comfort handling financial issues on their own | 10% | Emotion-based reason |
Numbers may not total 100 due to rounding. Respondents could select more than one answer.
Numbers may not total 100 due to rounding. Respondents could select more than one answer.
While firing an advisor is rare, many of the primary drivers behind firing decisions are also emotionally driven.
Often, advisors were fired due to the quality of the relationship. In many cases, this was due to an advisor not dedicating enough time to fully grasp their personal financial goals. Additionally, wealthier, and more financially literate clients are more likely to fire their advisors—highlighting the importance of understanding the client.
Key Takeaways
Given these driving factors, here are five ways that advisors can build a lasting relationship through recognizing their clients’ emotional needs:
- Understand your clients’ deeper goals
- Reach out proactively
- Act as a financial coach
- Keep clients updated
- Conduct goal-setting exercises on a regular basis
By communicating their value and setting expectations early, advisors can help prevent setbacks in their practice by adeptly recognizing the emotional motivators of their clients.
Markets in a Minute
The Top 5 Reasons Clients Hire a Financial Advisor
Here are the most common drivers for hiring a financial advisor, revealing that investor motivations go beyond just financial factors.

The Top 5 Reasons Clients Hire a Financial Advisor
What drives investors to hire a financial advisor?
From saving for a down payment to planning for retirement, clients turn to advisors to guide them through life’s complex financial decisions. However, many of the key reasons for hiring a financial advisor stem from emotional factors, and go beyond purely financial motivations.
We partnered with Morningstar to show the top reasons clients hire a financial advisor to provide insight on what’s driving investor behavior.
What Drives Hiring Decisions?
Here are the most common reasons for hiring an advisor, based on a survey of 312 respondents.
| Reason for Hiring | % of Respondents Citing This Reason | Type of Motivation |
|---|---|---|
| Specific goals or needs | 32% | Financial-based reason |
| Discomfort handling finances | 32% | Emotion-based reason |
| Behavioral coaching | 17% | Emotion-based reason |
| Recommended by family or friends | 12% | Emotion-based reason |
| Quality of relationship | 10% | Emotion-based reason |
Numbers may not total 100 due to rounding. Respondents could select more than one answer.
While financial factors played an important role in hiring decisions, emotional reasons made up the largest share of total responses.
This illustrates that clients place a high degree of importance on reaching specific goals or needs, and how an advisor communicates with them. Furthermore, clients seek out advisors for behavioral coaching to help them make informed decisions while staying the course.
Key Takeaways
With this in mind, here are five ways advisors can provide value to their clients and grow their practice:
- Address clients’ emotional needs early on
- Demonstrate how you can offer support
- Use ordinary language
- Provide education to help clients stay on track
- Acknowledge that these are issues we all face
By addressing emotional factors, advisors can more effectively help clients’ navigate intricate financial decisions and avoid common behavioral mistakes.

The Top 5 Reasons Clients Fire a Financial Advisor

The Top 5 Reasons Clients Hire a Financial Advisor

Visualizing the Growth of $100, by Asset Class

How Small Investments Make a Big Impact Over Time

What Were the Top Performing Investment Themes of 2023?
-

 Infographics2 years ago
The Top Investment Quotes Every Investor Should Know
-

 Markets in a Minute2 years ago
Mapped: The Growth in U.S. House Prices by State
-

 Markets in a Minute2 years ago
How Closely Related Are Historical Mortgage Rates and Housing Prices?
-

 Infographics2 years ago
A Visual Guide to Stagflation, Inflation, and Deflation
-

 Markets in a Minute1 year ago
Mapped: Global Energy Prices, by Country in 2022
-

 Markets in a Minute2 years ago
Visualizing Historical Oil Prices (1968-2022)
-

 Infographics1 year ago
Visual Guide: The Three Types of Economic Indicators
-

 Markets in a Minute2 years ago
Mapped: Global Macroeconomic Risk, by Country in 2022
