
Markets in a Minute
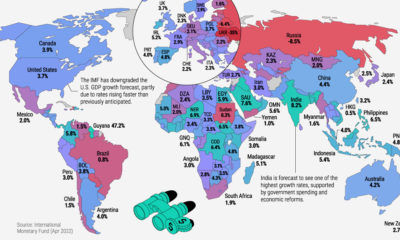
Mapped: 2023 Inflation Forecasts by Country
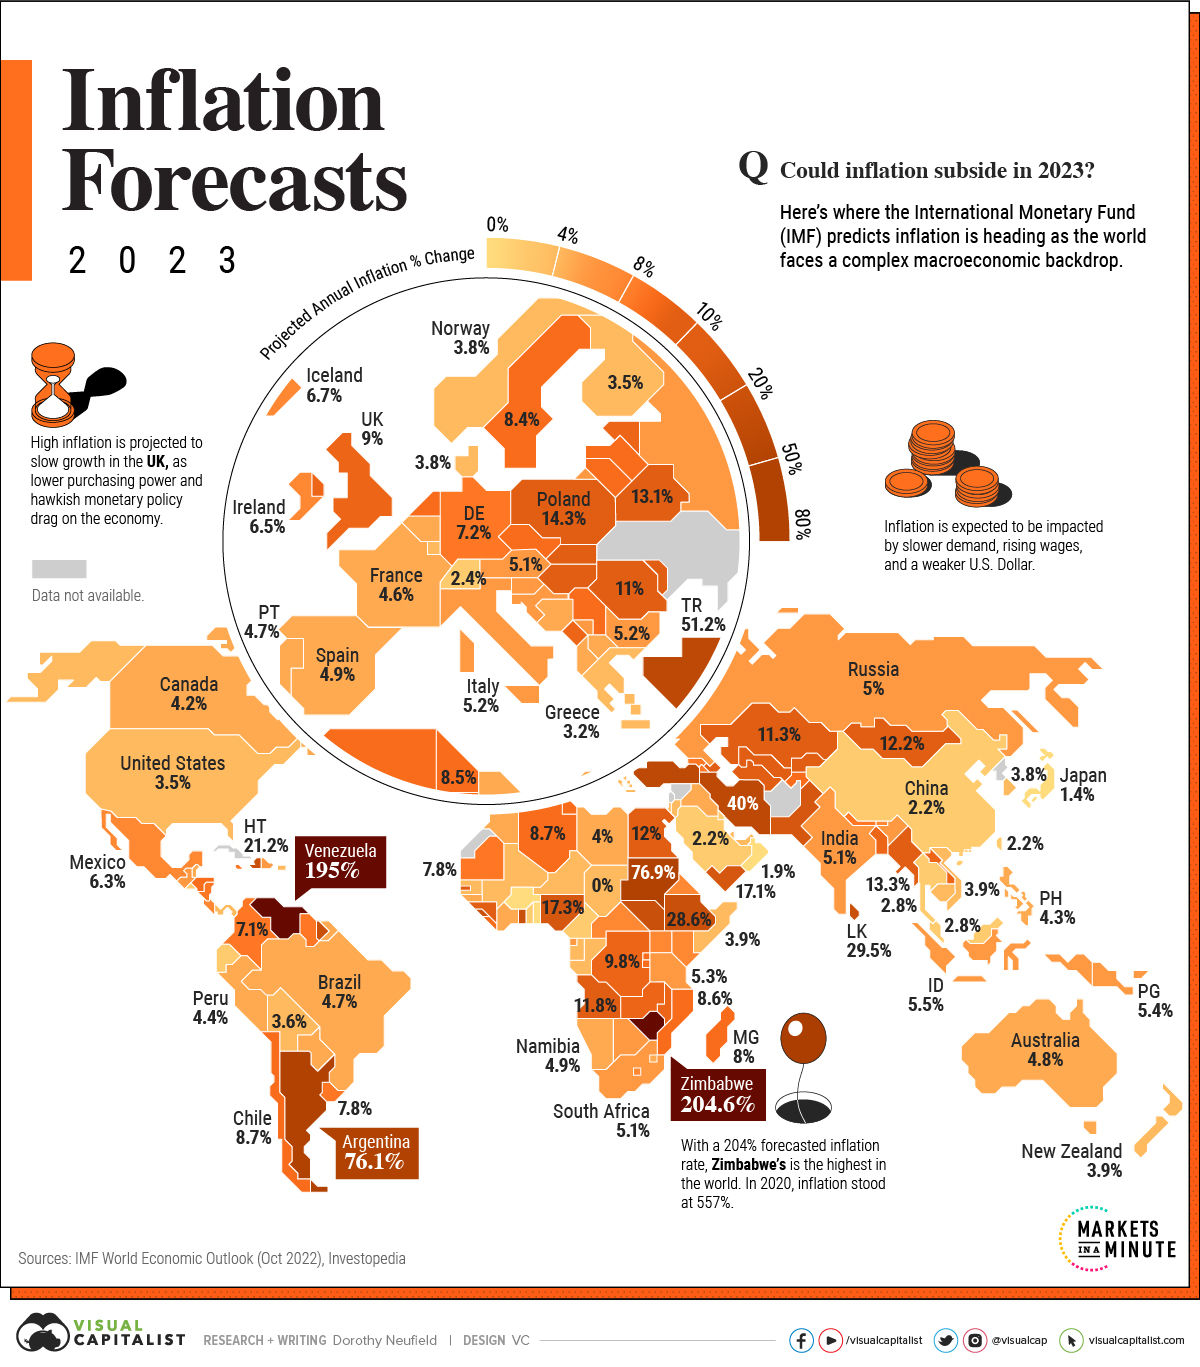
Mapped: 2023 Inflation Forecasts by Country
Inflation surged on a global scale in 2022, hitting record-level highs in many countries. Could it finally subside in 2023?
In the above infographic, we look to answer that question using the World Economic Outlook report by the International Monetary Fund (IMF).
Not Yet Out of the Woods
While the IMF predicts that global inflation peaked in late 2022, rates in 2023 are expected to remain higher than usual in many parts of the world. Following the 8.8% global inflation rate in 2022, the IMF forecasts a 6.6% rate for 2023 and 4.3% rate for 2024 based on their most recent January 2023 update.
For the optimists, the good news is that the double-digit inflation that characterized nearly half the world in 2022 is expected to be less prevalent this year. For the pessimists, on the other hand, looking at countries like Zimbabwe, Venezuela, Turkey, and Poland may suggest that we are far from out of the woods on a global scale.
Here are the countries with the highest forecasted inflation rates in 2023.
| Country / Region | Projected Annual Inflation % Change 2023 |
|---|---|
| 🇿🇼 Zimbabwe | 204.6% |
| 🇻🇪 Venezuela | 195.0% |
| 🇸🇩 Sudan | 76.9% |
| 🇦🇷 Argentina | 76.1% |
| 🇹🇷 Turkiye | 51.2% |
| 🇮🇷 Islamic Republic of Iran | 40.0% |
| 🇱🇰 Sri Lanka | 29.5% |
| 🇪🇹 Ethiopia | 28.6% |
| 🇸🇷 Suriname | 27.2% |
| 🇸🇱 Sierra Leone | 26.8% |
| 🇸🇸 South Sudan | 21.7% |
| 🇭🇹 Haiti | 21.2% |
| 🇬🇭 Ghana | 20.9% |
| 🇵🇰 Pakistan | 19.9% |
| 🇳🇬 Nigeria | 17.3% |
| 🇾🇪 Yemen | 17.1% |
| 🇲🇼 Malawi | 16.5% |
| 🇵🇱 Poland | 14.3% |
| 🇲🇩 Moldova | 13.8% |
| 🇲🇲 Myanmar | 13.3% |
| 🇭🇺 Hungary | 13.3% |
| 🇧🇾 Belarus | 13.1% |
| 🇰🇬 Kyrgyz Republic | 12.4% |
| 🇬🇳 Guinea | 12.2% |
| 🇲🇳 Mongolia | 12.2% |
| 🇪🇬 Egypt | 12.0% |
| 🇦🇴 Angola | 11.8% |
| 🇰🇿 Kazakhstan | 11.3% |
| 🇸🇹 São Tomé and Príncipe | 11.2% |
| 🇷🇴 Romania | 11.0% |
| 🇺🇿 Uzbekistan | 10.8% |
| 🇦🇿 Azerbaijan | 10.8% |
| 🇹🇲 Turkmenistan | 10.5% |
| 🇸🇰 Slovak Republic | 10.1% |
| 🇨🇩 Democratic Republic of the Congo | 9.8% |
| 🇿🇲 Zambia | 9.6% |
| 🇪🇪 Estonia | 9.5% |
| 🇲🇪 Montenegro | 9.2% |
| 🇧🇩 Bangladesh | 9.1% |
| 🇬🇧 United Kingdom | 9.0% |
While the above countries fight to sustain their purchasing power, some parts of the world are expected to continue faring exceptionally well against the backdrop of a widespread cost-of-living crisis. Many Asian countries, notably Japan, Taiwan, and China, are all predicted to see inflation lower than 3% in the upcoming year.
When it comes to low inflation, Japan in particular stands out. With strict price controls, negative interest rates, and an aging population, the country is expected to see an inflation rate of just 1.4% in 2023.
Inflation Drivers
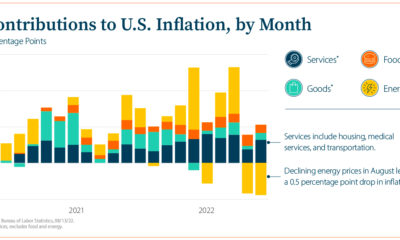
While rising food and energy prices accounted for much of the inflation we saw in 2022, the IMF’s World Economic Outlook highlights that core inflation, which excludes food, energy, transport and housing prices, is now also a major driving factor in high inflation rates around the world.
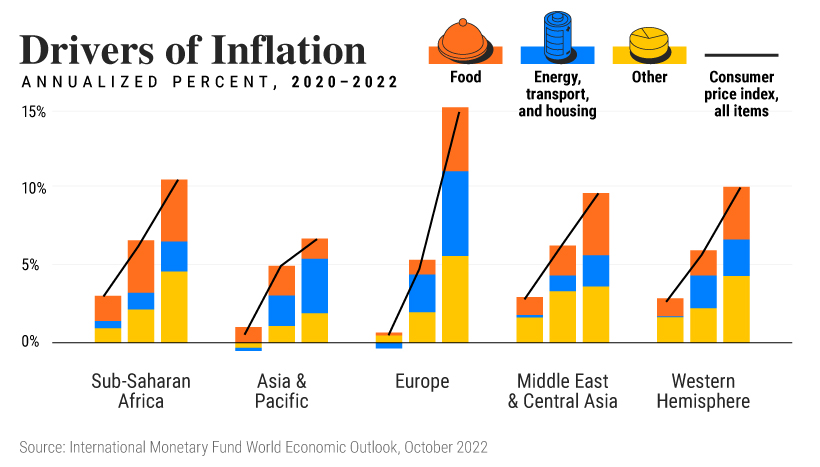
What makes up core inflation exactly? In this case, it would include things like supply chain cost pressures and the effects of high energy prices slowly trickling down into numerous industries and trends in the labor market, such as the availability of jobs and rising wages. As these macroeconomic factors play out throughout 2023, each can have an effect on inflation.
The Russia-Ukraine conflict and the lingering effects of the COVID-19 pandemic are also still at play in this year’s inflation forecasts. While the latter mainly played out in China in 2022, the possible resurgence of new variants continues to threaten economic recovery worldwide, and the war persists in leaving a mark internationally.
The confluence of macroeconomic factors currently at play is unlike what we’ve seen in a long time. Though the expertise of forecasters can give us a general understanding, how they will actually play out is for us to wait and see.


Markets in a Minute
The Top 5 Reasons Clients Fire a Financial Advisor
Firing an advisor is often driven by more than cost and performance factors. Here are the top reasons clients ‘break up’ with their advisors.

The Top 5 Reasons Clients Fire a Financial Advisor
What drives investors to fire a financial advisor?
From saving for a down payment to planning for retirement, clients turn to advisors to guide them through life’s complex financial decisions. However, many of the key reasons for firing a financial advisor stem from emotional factors, and go beyond purely financial motivations.
We partnered with Morningstar to show the top reasons clients fire an advisor to provide insight on what’s driving investor behavior.
What Drives Firing Decisions?
Here are the top reasons clients terminated their advisor, based on a survey of 184 respondents:
| Reason for Firing | % of Respondents Citing This Reason | Type of Motivation |
|---|---|---|
| Quality of financial advice and services | 32% | Emotion-based reason |
| Quality of relationship | 21% | Emotion-based reason |
| Cost of services | 17% | Financial-based reason |
| Return performance | 11% | Financial-based reason |
| Comfort handling financial issues on their own | 10% | Emotion-based reason |
Numbers may not total 100 due to rounding. Respondents could select more than one answer.
Numbers may not total 100 due to rounding. Respondents could select more than one answer.
While firing an advisor is rare, many of the primary drivers behind firing decisions are also emotionally driven.
Often, advisors were fired due to the quality of the relationship. In many cases, this was due to an advisor not dedicating enough time to fully grasp their personal financial goals. Additionally, wealthier, and more financially literate clients are more likely to fire their advisors—highlighting the importance of understanding the client.
Key Takeaways
Given these driving factors, here are five ways that advisors can build a lasting relationship through recognizing their clients’ emotional needs:
- Understand your clients’ deeper goals
- Reach out proactively
- Act as a financial coach
- Keep clients updated
- Conduct goal-setting exercises on a regular basis
By communicating their value and setting expectations early, advisors can help prevent setbacks in their practice by adeptly recognizing the emotional motivators of their clients.
Markets in a Minute
The Top 5 Reasons Clients Hire a Financial Advisor
Here are the most common drivers for hiring a financial advisor, revealing that investor motivations go beyond just financial factors.

The Top 5 Reasons Clients Hire a Financial Advisor
What drives investors to hire a financial advisor?
From saving for a down payment to planning for retirement, clients turn to advisors to guide them through life’s complex financial decisions. However, many of the key reasons for hiring a financial advisor stem from emotional factors, and go beyond purely financial motivations.
We partnered with Morningstar to show the top reasons clients hire a financial advisor to provide insight on what’s driving investor behavior.
What Drives Hiring Decisions?
Here are the most common reasons for hiring an advisor, based on a survey of 312 respondents.
| Reason for Hiring | % of Respondents Citing This Reason | Type of Motivation |
|---|---|---|
| Specific goals or needs | 32% | Financial-based reason |
| Discomfort handling finances | 32% | Emotion-based reason |
| Behavioral coaching | 17% | Emotion-based reason |
| Recommended by family or friends | 12% | Emotion-based reason |
| Quality of relationship | 10% | Emotion-based reason |
Numbers may not total 100 due to rounding. Respondents could select more than one answer.
While financial factors played an important role in hiring decisions, emotional reasons made up the largest share of total responses.
This illustrates that clients place a high degree of importance on reaching specific goals or needs, and how an advisor communicates with them. Furthermore, clients seek out advisors for behavioral coaching to help them make informed decisions while staying the course.
Key Takeaways
With this in mind, here are five ways advisors can provide value to their clients and grow their practice:
- Address clients’ emotional needs early on
- Demonstrate how you can offer support
- Use ordinary language
- Provide education to help clients stay on track
- Acknowledge that these are issues we all face
By addressing emotional factors, advisors can more effectively help clients’ navigate intricate financial decisions and avoid common behavioral mistakes.

The Top 5 Reasons Clients Fire a Financial Advisor

The Top 5 Reasons Clients Hire a Financial Advisor

Visualizing the Growth of $100, by Asset Class

How Small Investments Make a Big Impact Over Time

What Were the Top Performing Investment Themes of 2023?
-

 Infographics2 years ago
The Top Investment Quotes Every Investor Should Know
-

 Markets in a Minute2 years ago
Mapped: The Growth in U.S. House Prices by State
-

 Markets in a Minute2 years ago
How Closely Related Are Historical Mortgage Rates and Housing Prices?
-

 Infographics2 years ago
A Visual Guide to Stagflation, Inflation, and Deflation
-

 Markets in a Minute1 year ago
Mapped: Global Energy Prices, by Country in 2022
-

 Markets in a Minute2 years ago
Visualizing Historical Oil Prices (1968-2022)
-

 Infographics1 year ago
Visual Guide: The Three Types of Economic Indicators
-

 Markets in a Minute2 years ago
Mapped: Global Macroeconomic Risk, by Country in 2022
