
Markets in a Minute
Mapped: GDP Growth Forecasts by Country, in 2023
Mapped: GDP Growth Forecasts by Country, in 2023
Since Russia’s invasion of Ukraine early last year, talk of global recession has dominated the outlook for 2023.
High inflation, spurred by rising energy costs, has tested GDP growth. Tightening monetary policy in the U.S., with interest rates jumping from roughly 0% to over 4% in 2022, has historically preceded a downturn about one to two years later.
For European economies, energy prices are critical. The good news is that prices have fallen recently since March highs, but the continent remains on shaky ground.
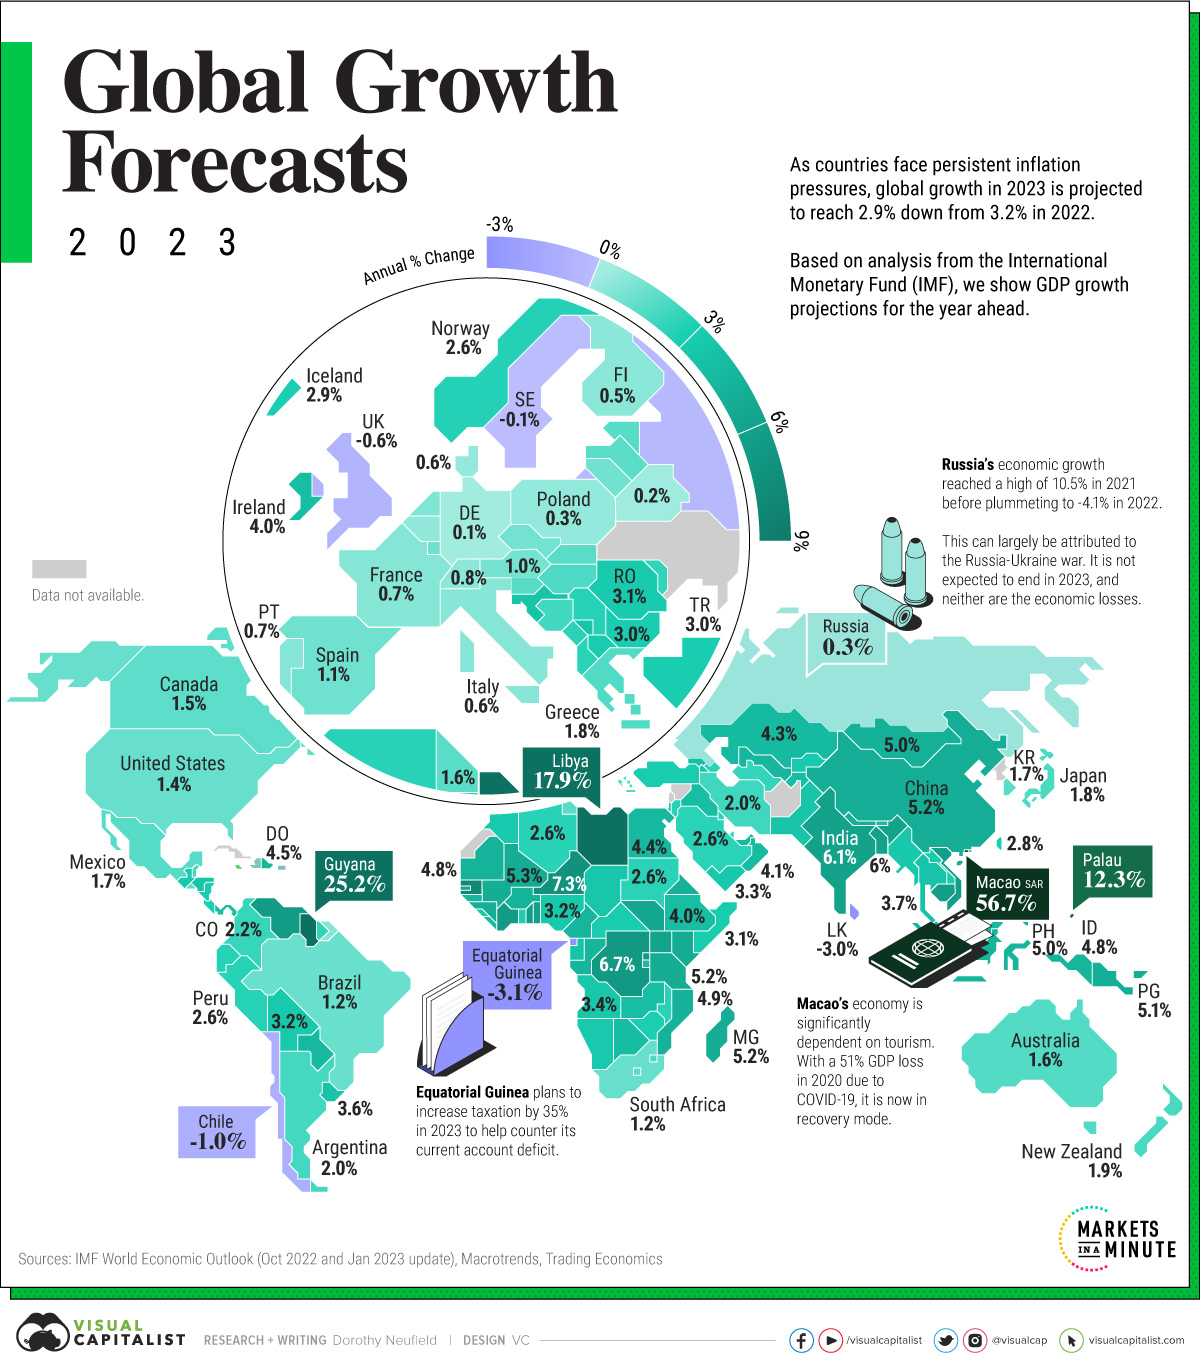
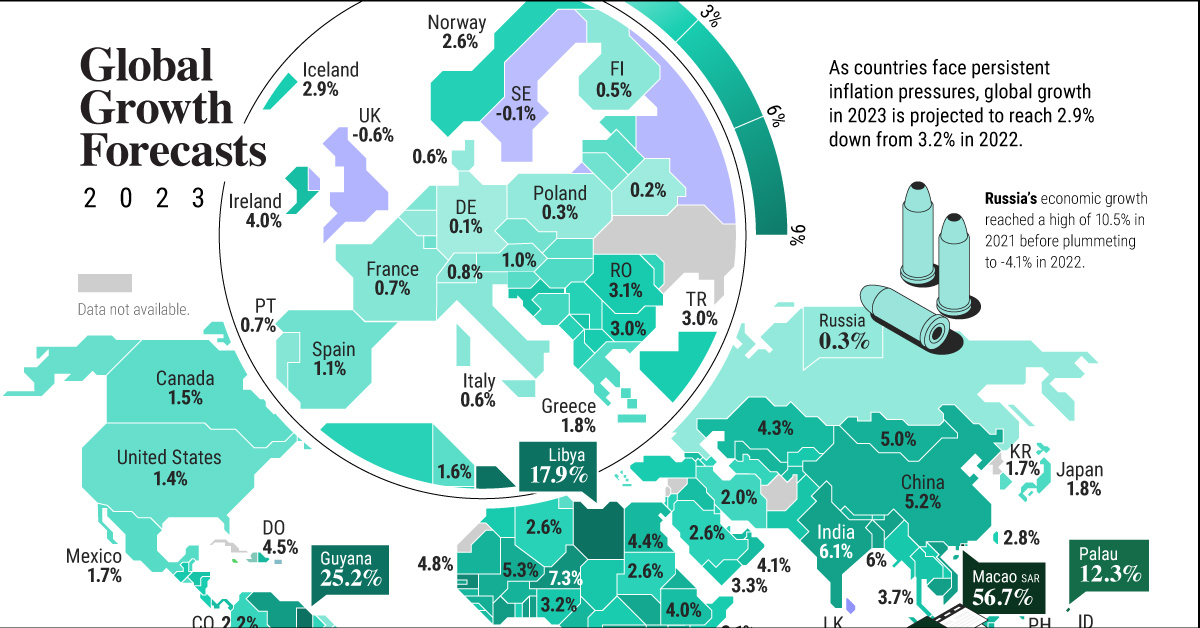
The map shows GDP growth forecasts by country for the year ahead, based on projections from the International Monetary Fund (IMF) October 2022 Outlook and January 2023 update.
2023 GDP Growth Outlook
The world economy is projected to see just 2.9% GDP growth in 2023, down from 3.2% projected for 2022.
This is a 0.2% increase since the October 2022 Outlook thanks in part to China’s reopening, higher global demand, and slowing inflation projected across certain countries in the year ahead.
With this in mind, we show GDP growth forecasts for 191 jurisdictions given multiple economic headwinds—and a few emerging bright spots in 2023.
| Country / Region | 2023 Real GDP % Change (Projected) | 2022 Real GDP % Change (Projected) |
|---|---|---|
| 🇦🇱 Albania | 2.5% | 4.0% |
| 🇩🇿 Algeria | 2.6% | 4.7% |
| 🇦🇴 Angola | 3.4% | 2.9% |
| 🇦🇬 Antigua and Barbuda | 5.6% | 6.0% |
| 🇦🇷 Argentina* | 2.0% | 4.0% |
| 🇦🇲 Armenia | 3.5% | 7.0% |
| 🇦🇼 Aruba | 2.0% | 4.0% |
| 🇦🇺 Australia* | 1.6% | 3.8% |
| 🇦🇹 Austria | 1.0% | 4.7% |
| 🇦🇿 Azerbaijan | 2.5% | 3.7% |
| 🇧🇭 Bahrain | 3.0% | 3.4% |
| 🇧🇩 Bangladesh | 6.0% | 7.2% |
| 🇧🇧 Barbados | 5.0% | 10.5% |
| 🇧🇾 Belarus | 0.2% | -7.0% |
| 🇧🇪 Belgium | 0.4% | 2.4% |
| 🇧🇿 Belize | 2.0% | 3.5% |
| 🇧🇯 Benin | 6.2% | 5.7% |
| 🇧🇹 Bhutan | 4.3% | 4.0% |
| 🇧🇴 Bolivia | 3.2% | 3.8% |
| 🇧🇦 Bosnia and Herzegovina | 2.0% | 2.4% |
| 🇧🇼 Botswana | 4.0% | 4.1% |
| 🇧🇷 Brazil* | 1.2% | 2.8% |
| 🇧🇳 Brunei Darussalam | 3.3% | 1.2% |
| 🇧🇬 Bulgaria | 3.0% | 2.9% |
| 🇧🇫 Burkina Faso | 4.8% | 3.6% |
| 🇧🇮 Burundi | 4.1% | 3.3% |
| 🇨🇻 Cabo Verde | 4.8% | 4.0% |
| 🇨🇲 Cameroon | 4.6% | 3.8% |
| 🇰🇭 Cambodia | 6.2% | 5.1% |
| 🇨🇦 Canada* | 1.5% | 3.3% |
| 🇨🇫 Central African Republic | 3.0% | 1.5% |
| 🇹🇩 Chad | 3.4% | 3.3% |
| 🇨🇱 Chile | -1.0% | 2.0% |
| 🇨🇳 China* | 5.3% | 3.2% |
| 🇨🇴 Colombia | 2.2% | 7.6% |
| 🇰🇲 Comoros | 3.4% | 3.0% |
| 🇨🇷 Costa Rica | 2.9% | 3.8% |
| 🇨🇮 Côte d'Ivoire | 6.5% | 5.5% |
| 🇭🇷 Croatia | 3.5% | 5.9% |
| 🇨🇾 Cyprus | 2.5% | 3.5% |
| 🇨🇿 Czech Republic | 1.5% | 1.9% |
| 🇨🇩 Democratic Republic of the Congo | 6.7% | 6.1% |
| 🇩🇰 Denmark | 0.6% | 2.6% |
| 🇩🇯 Djibouti | 5.0% | 3.6% |
| 🇩🇲 Dominica | 4.9% | 6.0% |
| 🇩🇴 Dominican Republic | 4.5% | 5.3% |
| 🇪🇨 Ecuador | 2.7% | 2.9% |
| 🇪🇬 Egypt* | 4.0% | 6.6% |
| 🇸🇻 El Salvador | 1.7% | 2.6% |
| 🇬🇶 Equatorial Guinea | -3.1% | 5.8% |
| 🇪🇷 Eritrea | 2.9% | 2.6% |
| 🇪🇪 Estonia | 1.8% | 1.0% |
| 🇸🇿 Eswatini | 1.8% | 2.4% |
| 🇪🇹 Ethiopia | 5.3% | 3.8% |
| 🇫🇯 Fiji | 6.9% | 12.5% |
| 🇫🇮 Finland | 0.5% | 2.1% |
| 🇫🇷 France* | 0.7% | 2.5% |
| 🇲🇰 North Macedonia | 3.0% | |
| 🇬🇦 Gabon | 3.7% | 2.7% |
| 🇬🇪 Georgia | 4.0% | 9.0% |
| 🇩🇪 Germany* | 0.1% | 1.5% |
| 🇬🇭 Ghana | 2.8% | 3.6% |
| 🇬🇷 Greece | 1.8% | 5.2% |
| 🇬🇩 Grenada | 3.6% | 3.6% |
| 🇬🇹 Guatemala | 3.2% | 3.4% |
| 🇬🇳 Guinea | 5.1% | 4.6% |
| 🇬🇼 Guinea-Bissau | 4.5% | 3.8% |
| 🇬🇾 Guyana | 25.2% | 57.8% |
| 🇭🇹 Haiti | 0.5% | -1.2% |
| 🇭🇳 Honduras | 3.5% | 3.4% |
| 🇭🇰 Hong Kong SAR | 3.9% | -0.8% |
| 🇭🇺 Hungary | 1.8% | 5.7% |
| 🇮🇸 Iceland | 2.9% | 5.1% |
| 🇮🇳 India* | 6.1% | 6.8% |
| 🇮🇩 Indonesia* | 4.8% | 5.3% |
| 🇮🇶 Iraq | 4.0% | 9.3% |
| 🇮🇪 Ireland | 4.0% | 9.0% |
| 🇮🇷 Iran* | 2.0% | 3.0% |
| 🇮🇱 Israel | 3.0% | 6.1% |
| 🇮🇹 Italy* | 0.6% | 3.2% |
| 🇯🇲 Jamaica | 3.0% | 2.8% |
| 🇯🇵 Japan* | 1.8% | 1.7% |
| 🇯🇴 Jordan | 2.7% | 2.4% |
| 🇰🇿 Kazakhstan* | 4.3% | 2.5% |
| 🇰🇪 Kenya | 5.1% | 5.3% |
| 🇰🇮 Kiribati | 2.4% | 1.0% |
| 🇰🇷 South Korea* | 1.7% | 2.6% |
| 🇽🇰 Kosovo | 3.5% | 2.7% |
| 🇰🇼 Kuwait | 2.6% | 8.7% |
| 🇰🇬 Kyrgyz Republic | 3.2% | 3.8% |
| 🇱🇦 Lao P.D.R. | 3.1% | 2.2% |
| 🇱🇻 Latvia | 1.6% | 2.5% |
| 🇱🇸 Lesotho | 1.6% | 2.1% |
| 🇱🇷 Liberia | 4.2% | 3.7% |
| 🇱🇾 Libya | 17.9% | -18.4% |
| 🇱🇹 Lithuania | 1.1% | 1.8% |
| 🇱🇺 Luxembourg | 1.1% | 1.6% |
| 🇲🇴 Macao SAR | 56.7% | -22.4% |
| 🇲🇬 Madagascar | 5.2% | 4.2% |
| 🇲🇼 Malawi | 2.5% | 0.9% |
| 🇲🇾 Malaysia* | 4.4% | 5.4% |
| 🇲🇻 Maldives | 6.1% | 8.7% |
| 🇲🇱 Mali | 5.3% | 2.5% |
| 🇲🇹 Malta | 3.3% | 6.2% |
| 🇲🇭 Marshall Islands | 3.2% | 1.5% |
| 🇲🇷 Mauritania | 4.8% | 4.0% |
| 🇲🇺 Mauritius | 5.4% | 6.1% |
| 🇲🇽 Mexico* | 1.7% | 2.1% |
| 🇫🇲 Micronesia | 2.9% | -0.6% |
| 🇲🇩 Moldova | 2.3% | 0.0% |
| 🇲🇳 Mongolia | 5.0% | 2.5% |
| 🇲🇪 Montenegro | 2.5% | 7.2% |
| 🇲🇦 Morocco | 3.1% | 08% |
| 🇲🇿 Mozambique | 4.9% | 3.7% |
| 🇲🇲 Myanmar | 3.3% | 2.0% |
| 🇳🇦 Namibia | 3.2% | 3.0% |
| 🇳🇷 Nauru | 2.0% | 0.9% |
| 🇳🇵 Nepal | 5.0% | 4.2% |
| 🇳🇱 Netherlands* | 0.6% | 4.5% |
| 🇳🇿 New Zealand | 1.9% | 2.3% |
| 🇳🇮 Nicaragua | 3.0% | 4.0% |
| 🇳🇪 Niger | 7.3% | 6.7% |
| 🇳🇬 Nigeria* | 3.2% | 3.2% |
| 🇳🇴 Norway | 2.6% | 3.6% |
| 🇴🇲 Oman | 4.1% | 4.4% |
| 🇵🇰 Pakistan* | 2.0% | 6.0% |
| 🇵🇼 Palau | 12.3% | -2.8% |
| 🇵🇦 Panama | 4.0% | 7.5% |
| 🇵🇬 Papua New Guinea | 5.1% | 3.8% |
| 🇵🇾 Paraguay | 4.3% | 0.2% |
| 🇵🇪 Peru | 2.6% | 2.7% |
| 🇵🇭 Philippines* | 5.0% | 6.5% |
| 🇵🇱 Poland* | 0.3% | 3.8% |
| 🇵🇹 Portugal | 0.7% | 6.2% |
| 🇵🇷 Puerto Rico | 0.4% | 4.8% |
| 🇶🇦 Qatar | 2.4% | 3.4% |
| 🇨🇬 Republic of Congo | 4.6% | 4.3% |
| 🇷🇴 Romania | 3.1% | 4.8% |
| 🇷🇺 Russia* | 0.3% | -3.4% |
| 🇷🇼 Rwanda | 6.7% | 6.0% |
| 🇼🇸 Samoa | 4.0% | -5.0% |
| 🇸🇲 San Marino | 0.8% | 3.1% |
| 🇸🇹 São Tomé and Príncipe | 2.6% | 1.4% |
| 🇸🇦 Saudi Arabia* | 2.6% | 7.6% |
| 🇸🇳 Senegal | 8.1% | 4.7% |
| 🇷🇸 Serbia | 2.7% | 3.5% |
| 🇸🇨 Seychelles | 5.2% | 10.9% |
| 🇸🇱 Sierra Leone | 3.3% | 2.4% |
| 🇸🇬 Singapore | 2.3% | 3.0% |
| 🇸🇰 Slovak Republic | 1.5% | 1.8% |
| 🇸🇮 Slovenia | 1.7% | 5.7% |
| 🇸🇧 Solomon Islands | 2.6% | -4.5% |
| 🇸🇴 Somalia | 3.1% | 1.9% |
| 🇿🇦 South Africa* | 1.2% | 2.1% |
| 🇸🇸 South Sudan | 5.6% | 6.5% |
| 🇪🇸 Spain* | 1.1% | 4.3% |
| 🇱🇰 Sri Lanka | -3.0% | -8.7% |
| 🇰🇳 St. Kitts and Nevis | 4.8% | 9.8% |
| 🇱🇨 St. Lucia | 5.8% | 9.1% |
| 🇻🇨 St. Vincent and the Grenadines | 6.0% | 5.0% |
| 🇸🇩 Sudan | 2.6% | -0.3% |
| 🇸🇷 Suriname | 2.3% | 1.3% |
| 🇸🇪 Sweden | -0.1% | 2.6% |
| 🇨🇭 Switzerland | 0.8% | 2.2% |
| 🇹🇼 Taiwan | 2.8% | 3.3% |
| 🇹🇯 Tajikistan | 4.0% | 5.5% |
| 🇹🇿 Tanzania | 5.2% | 4.5% |
| 🇹🇭 Thailand* | 3.7% | 2.8% |
| 🇧🇸 The Bahamas | 4.1% | 8.0% |
| 🇬🇲 The Gambia | 6.0% | 5.0% |
| 🇹🇱 Timor-Leste | 4.2% | 3.3% |
| 🇹🇬 Togo | 6.2% | 5.4% |
| 🇹🇴 Tonga | 2.9% | -2.0% |
| 🇹🇹 Trinidad and Tobago | 3.5% | 4.0% |
| 🇹🇳 Tunisia | 1.6% | 2.2% |
| 🇹🇷 Turkey* | 3.0% | 5.0% |
| 🇹🇲 Turkmenistan | 2.3% | 1.2% |
| 🇹🇻 Tuvalu | 3.5% | 3.0% |
| 🇺🇬 Uganda | 5.9% | 4.4% |
| 🇺🇦 Ukraine | N/A | -35.0% |
| 🇦🇪 United Arab Emirates | 4.2% | 5.1% |
| 🇬🇧 United Kingdom* | -0.6% | 3.6% |
| 🇺🇲 U.S.* | 1.4% | 1.6% |
| 🇺🇾 Uruguay | 3.6% | 5.3% |
| 🇺🇿 Uzbekistan | 4.7% | 5.2% |
| 🇻🇺 Vanuatu | 3.1% | 1.7% |
| 🇻🇪 Venezuela | 6.5% | 6.0% |
| 🇻🇳 Vietnam | 6.2% | 7.0% |
| West Bank and Gaza | 3.5% | 4.0% |
| 🇾🇪 Yemen | 3.3% | 2.0% |
| 🇿🇲 Zambia | 4.0% | 2.9% |
| 🇿🇼 Zimbabwe | 2.8% | 3.0% |
*Reflect updated figures from the January 2023 IMF Update.
The U.S. is forecast to see 1.4% GDP growth in 2023, up from 1.0% seen in the last October projection.
Still, signs of economic weakness can be seen in the growing wave of tech layoffs, foreshadowed as a white-collar or ‘Patagonia-vest’ recession. Last year, 88,000 tech jobs were cut and this trend has continued into 2023. Major financial firms have also followed suit. Still, unemployment remains fairly steadfast, at 3.5% as of December 2022. Going forward, concerns remain around inflation and the path of interest rate hikes, though both show signs of slowing.
Across Europe, the average projected GDP growth rate is 0.7% for 2023, a sharp decline from the 2.1% forecast for last year.
Both Germany and Italy are forecast to see slight growth, at 0.1% and 0.6%, respectively. Growth forecasts were revised upwards since the IMF’s October release. However, an ongoing energy crisis exposes the manufacturing sector to vulnerabilities, with potential spillover effects to consumers and businesses, and overall Euro Area growth.
China remains an open question. In 2023, growth is predicted to rise 5.2%, higher than many large economies. While its real estate sector has shown signs of weakness, the recent opening on January 8th, following 1,016 days of zero-Covid policy, could boost demand and economic activity.
A Long Way to Go
The IMF has stated that 2023 will feel like a recession for much of the global economy. But whether it is headed for a recovery or a sharper decline remains unknown.
Today, two factors propping up the global economy are lower-than-expected energy prices and resilient private sector balance sheets. European natural gas prices have sunk to levels seen before the war in Ukraine. During the height of energy shocks, firms showed a notable ability to withstand astronomical energy prices squeezing their finances. They are also sitting on significant cash reserves.
On the other hand, inflation is far from over. To counter this effect, many central banks will have to use measures to rein in prices. This may in turn have a dampening effect on economic growth and financial markets, with unknown consequences.
As economic data continues to be released over the year, there may be a divergence between consumer sentiment and whether things are actually changing in the economy. Where the economy is heading in 2023 will be anyone’s guess.


Markets in a Minute
The Top 5 Reasons Clients Fire a Financial Advisor
Firing an advisor is often driven by more than cost and performance factors. Here are the top reasons clients ‘break up’ with their advisors.

The Top 5 Reasons Clients Fire a Financial Advisor
What drives investors to fire a financial advisor?
From saving for a down payment to planning for retirement, clients turn to advisors to guide them through life’s complex financial decisions. However, many of the key reasons for firing a financial advisor stem from emotional factors, and go beyond purely financial motivations.
We partnered with Morningstar to show the top reasons clients fire an advisor to provide insight on what’s driving investor behavior.
What Drives Firing Decisions?
Here are the top reasons clients terminated their advisor, based on a survey of 184 respondents:
| Reason for Firing | % of Respondents Citing This Reason | Type of Motivation |
|---|---|---|
| Quality of financial advice and services | 32% | Emotion-based reason |
| Quality of relationship | 21% | Emotion-based reason |
| Cost of services | 17% | Financial-based reason |
| Return performance | 11% | Financial-based reason |
| Comfort handling financial issues on their own | 10% | Emotion-based reason |
Numbers may not total 100 due to rounding. Respondents could select more than one answer.
Numbers may not total 100 due to rounding. Respondents could select more than one answer.
While firing an advisor is rare, many of the primary drivers behind firing decisions are also emotionally driven.
Often, advisors were fired due to the quality of the relationship. In many cases, this was due to an advisor not dedicating enough time to fully grasp their personal financial goals. Additionally, wealthier, and more financially literate clients are more likely to fire their advisors—highlighting the importance of understanding the client.
Key Takeaways
Given these driving factors, here are five ways that advisors can build a lasting relationship through recognizing their clients’ emotional needs:
- Understand your clients’ deeper goals
- Reach out proactively
- Act as a financial coach
- Keep clients updated
- Conduct goal-setting exercises on a regular basis
By communicating their value and setting expectations early, advisors can help prevent setbacks in their practice by adeptly recognizing the emotional motivators of their clients.
Markets in a Minute
The Top 5 Reasons Clients Hire a Financial Advisor
Here are the most common drivers for hiring a financial advisor, revealing that investor motivations go beyond just financial factors.

The Top 5 Reasons Clients Hire a Financial Advisor
What drives investors to hire a financial advisor?
From saving for a down payment to planning for retirement, clients turn to advisors to guide them through life’s complex financial decisions. However, many of the key reasons for hiring a financial advisor stem from emotional factors, and go beyond purely financial motivations.
We partnered with Morningstar to show the top reasons clients hire a financial advisor to provide insight on what’s driving investor behavior.
What Drives Hiring Decisions?
Here are the most common reasons for hiring an advisor, based on a survey of 312 respondents.
| Reason for Hiring | % of Respondents Citing This Reason | Type of Motivation |
|---|---|---|
| Specific goals or needs | 32% | Financial-based reason |
| Discomfort handling finances | 32% | Emotion-based reason |
| Behavioral coaching | 17% | Emotion-based reason |
| Recommended by family or friends | 12% | Emotion-based reason |
| Quality of relationship | 10% | Emotion-based reason |
Numbers may not total 100 due to rounding. Respondents could select more than one answer.
While financial factors played an important role in hiring decisions, emotional reasons made up the largest share of total responses.
This illustrates that clients place a high degree of importance on reaching specific goals or needs, and how an advisor communicates with them. Furthermore, clients seek out advisors for behavioral coaching to help them make informed decisions while staying the course.
Key Takeaways
With this in mind, here are five ways advisors can provide value to their clients and grow their practice:
- Address clients’ emotional needs early on
- Demonstrate how you can offer support
- Use ordinary language
- Provide education to help clients stay on track
- Acknowledge that these are issues we all face
By addressing emotional factors, advisors can more effectively help clients’ navigate intricate financial decisions and avoid common behavioral mistakes.

The Top 5 Reasons Clients Fire a Financial Advisor

The Top 5 Reasons Clients Hire a Financial Advisor

Visualizing the Growth of $100, by Asset Class

How Small Investments Make a Big Impact Over Time

What Were the Top Performing Investment Themes of 2023?
-

 Infographics2 years ago
The Top Investment Quotes Every Investor Should Know
-

 Markets in a Minute2 years ago
Mapped: The Growth in U.S. House Prices by State
-

 Markets in a Minute2 years ago
How Closely Related Are Historical Mortgage Rates and Housing Prices?
-

 Infographics2 years ago
A Visual Guide to Stagflation, Inflation, and Deflation
-

 Markets in a Minute1 year ago
Mapped: Global Energy Prices, by Country in 2022
-

 Infographics3 years ago
The 5 Fastest Growing Industries of the Next Decade
-

 Markets in a Minute2 years ago
Visualizing Historical Oil Prices (1968-2022)
-

 Infographics1 year ago
Visual Guide: The Three Types of Economic Indicators
