
Markets in a Minute
Visualizing Interest Rates by Country in 2021
Visualizing Interest Rates by Country in 2021
Going as far back as the 14th century, pandemics have been found to have a negative effect on interest rates.
History shows that this effect is even greater than that of financial crises. Across a study of 19 pandemics since the mid-1300s, real interest rates fell an average of 1.5 percentage points lower in the following two decades than they would have otherwise. And yet, even before COVID-19, structural forces, such as rising debt, were causing interest rates to fall.
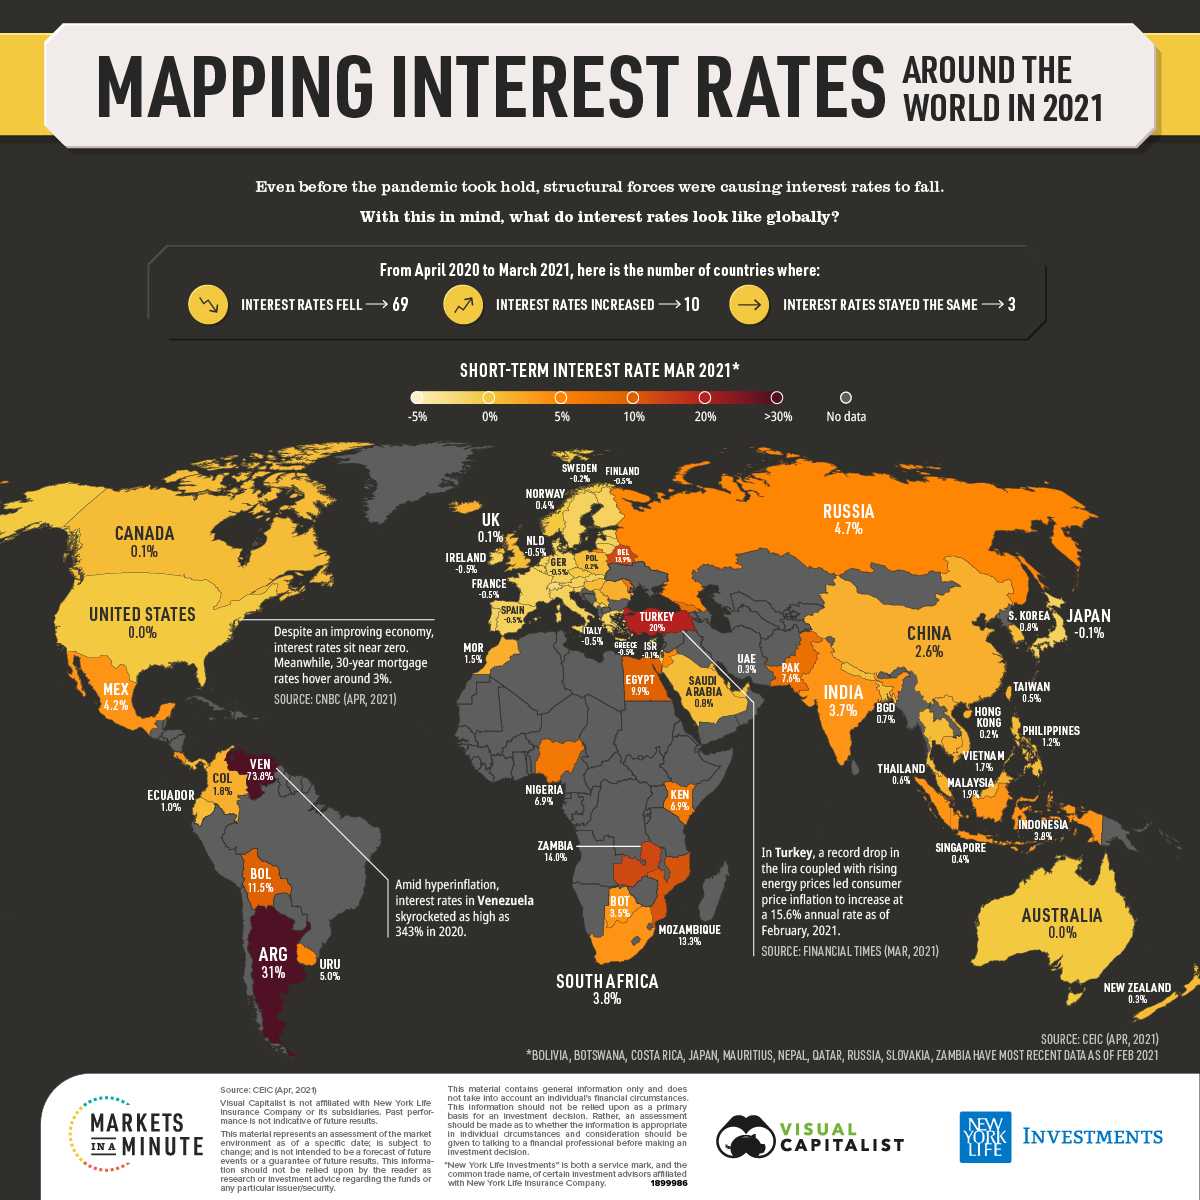
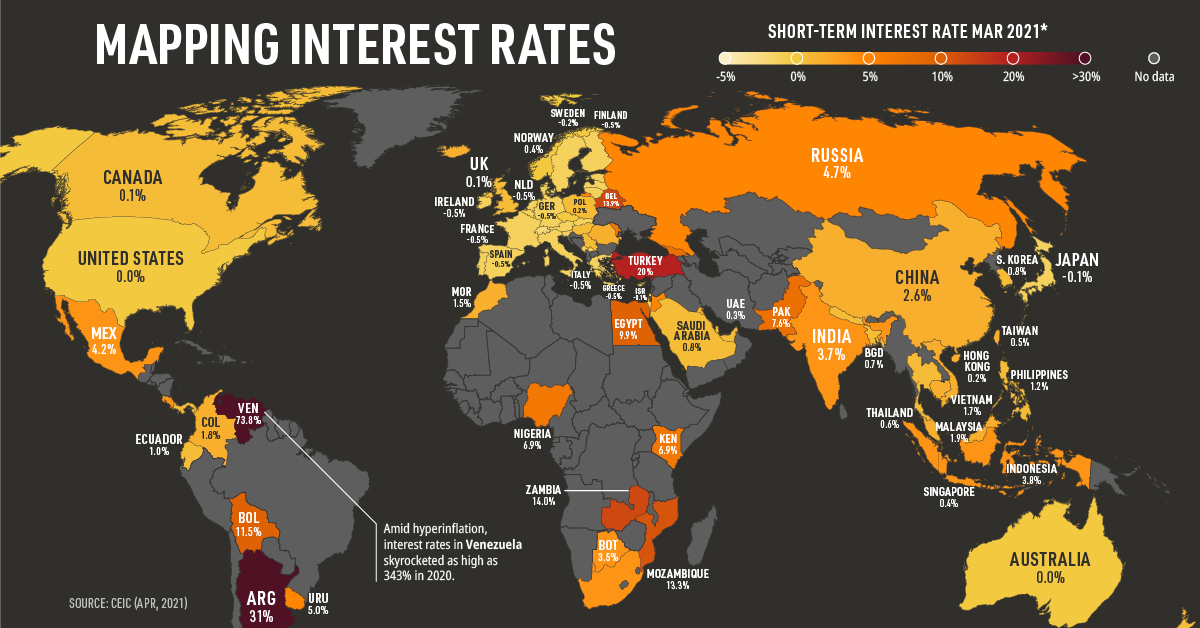
The above Markets in a Minute chart from New York Life Investments shows interest rates by country in 2021.
How Have Interest Rates Changed?
Broadly speaking, the majority of countries’ short-term interest rates have declined since COVID-19 began. Using data from CEIC as of April 2021, short-term interest rates are measured by three-month money market rates where available.
Interest rate change Apr 2020 – Mar 2021
- Interest rates fell: 69 countries
- Interest rates increased: 10 countries
- Interest rates stayed the same: 3 countries
Across nearly every continent, interest rates have decreased as central banks enacted measures to combat the economic fallout of COVID-19.
| Country/ Region | Short-Term Interest Rate Mar 2021 (%)* | Short-Term Interest Rate Apr 2020 (%)** | Interest Rate Change 2020-2021 (%) |
|---|---|---|---|
| Argentina | 31 | 12.4 | 18.6 |
| Australia | 0.0 | 0.1 | -0.1 |
| Austria | -0.5 | -0.3 | -0.2 |
| Bangladesh | 0.7 | 7.1 | -6.4 |
| Belarus | 13.9 | 10.6 | 3.3 |
| Belgium | -0.5 | -0.3 | -0.2 |
| Bolivia | 11.5 | 8.6 | 2.9 |
| Botswana | 3.5 | 4.4 | -0.9 |
| Cambodia | 1.8 | 1.6 | 0.2 |
| Canada | 0.1 | 0.3 | -0.2 |
| China | 2.6 | 1.4 | 1.2 |
| Colombia | 1.8 | 4.6 | -2.8 |
| Costa Rica | 3.6 | 4.1 | -0.5 |
| Cyprus | -0.5 | -0.3 | -0.2 |
| Czech Republic | 0.4 | 0.9 | -0.5 |
| Denmark | -0.2 | -0.4 | 0.2 |
| Ecuador | 1.0 | 1.3 | -0.3 |
| Egypt | 9.9 | 9.6 | 0.3 |
| Estonia | -0.5 | -0.3 | -0.2 |
| Finland | -0.5 | -0.3 | -0.2 |
| France | -0.5 | -0.3 | -0.2 |
| Georgia | 8.0 | 9.0 | -1.0 |
| Germany | -0.5 | -0.3 | -0.2 |
| Greece | -0.5 | -0.3 | -0.2 |
| Hong Kong | 0.2 | 1.7 | -1.5 |
| Hungary | 0.8 | 1.1 | -0.3 |
| Iceland | 1.4 | 2.4 | -1.0 |
| India | 3.7 | 5.3 | -1.6 |
| Indonesia | 3.8 | 4.9 | -1.1 |
| Ireland | -0.5 | -0.3 | -0.2 |
| Israel | -0.1 | 0.1 | -0.2 |
| Italy | -0.5 | -0.3 | -0.2 |
| Japan | -0.1 | 0.1 | -0.2 |
| Jordan | 4.6 | 4.7 | -0.1 |
| Kenya | 6.9 | 7.2 | -0.3 |
| Kosovo | -0.5 | -0.3 | -0.2 |
| Kuwait | 1.5 | 1.8 | -0.3 |
| Latvia | -0.5 | -0.3 | -0.2 |
| Lithuania | -0.5 | -0.3 | -0.2 |
| Luxembourg | -0.5 | -0.3 | -0.2 |
| Macau SAR | 0.3 | 1.7 | -1.4 |
| Malaysia | 1.9 | 2.8 | -0.9 |
| Malta | -0.5 | -0.3 | -0.2 |
| Mauritius | 0.1 | 1.2 | -1.1 |
| Mexico | 4.2 | 6.2 | -2.0 |
| Moldova | 7.0 | 8.0 | -1.0 |
| Montenegro | -0.5 | -0.3 | -0.2 |
| Morocco | 1.5 | 2.0 | -0.5 |
| Mozambique | 13.3 | 10.0 | 3.3 |
| Nepal | 1.1 | 2.1 | -1.0 |
| Netherlands | -0.5 | -0.3 | -0.2 |
| New Zealand | 0.3 | 0.3 | 0.0 |
| Nigeria | 6.9 | 10.1 | -3.2 |
| Norway | 0.4 | 1.4 | -1.0 |
| Pakistan | 7.6 | 8.2 | -0.6 |
| Panama | 0.2 | 0.7 | -0.5 |
| Philippines | 1.2 | 3.2 | -2.0 |
| Poland | 0.2 | 0.7 | -0.5 |
| Portugal | -0.5 | -0.3 | -0.2 |
| Qatar | 1.1 | 1.1 | 0.0 |
| Romania | 1.7 | 2.5 | -0.8 |
| Russia | 4.7 | 6.7 | -2.0 |
| Saudi Arabia | 0.8 | 1.2 | -0.4 |
| Serbia | 0.9 | 1.2 | -0.3 |
| Singapore | 0.4 | 0.9 | -0.5 |
| Slovakia | -0.5 | -0.3 | -0.2 |
| Slovenia | -0.5 | -0.3 | -0.2 |
| South Africa | 3.8 | 4.2 | -0.4 |
| South Korea | 0.8 | 1.0 | -0.2 |
| Spain | -0.5 | -0.3 | -0.2 |
| Sweden | -0.2 | 0.3 | -0.5 |
| Switzerland | -0.8 | -0.7 | -0.1 |
| Taiwan | 0.5 | 0.5 | 0.0 |
| Thailand | 0.6 | 0.9 | -0.3 |
| Turkey | 20 | 8.4 | 11.6 |
| UAE | 0.3 | 1.9 | -1.6 |
| United Kingdom | 0.1 | 0.6 | -0.5 |
| United States | 0.0 | 0.1 | -0.1 |
| Uruguay | 5.0 | 10.1 | -5.1 |
| Venezuela | 73.8 | 23.5 | 50.3 |
| Vietnam | 1.7 | 4.2 | -2.5 |
| Zambia | 14.0 | 16.5 | -2.5 |
Source: CEIC (Apr, 2021)
*Bolivia, Botswana, Costa Rica, Japan, Mauritius, Nepal, Qatar, Russia, Slovakia, Zambia have most recent data as of Feb ’21
**Costa Rica, Denmark, Mauritius, Norway & Russia have 2020 data as of Mar 2020
In the U.S., interest rates fell to record lows, dropping by 0.1 percentage points between April 2020 and March 2021. As vaccine rollouts accelerated in 2021, real GDP grew by an annual rate of 6.4% in the first quarter. Unemployment slightly improved to 6.1%, but still remains well above pre-pandemic levels of 3.5%.
Given these variables, the question of whether interest rates will rise is an open one.
Like the U.S., interest rates in the European Union declined, although at a greater rate—from -0.3% to -0.5%. To help improve economic conditions, the European Central Bank promises to purchase $2.2 trillion in government bonds until March 2022.
Together, the euro area, the U.S., Japan, and Britain have produced at least $3.8 trillion in new money supply since early 2020.
Interest Rates: The Steepest Gains and Declines
As money creation and low interest rates have become increasingly common phenomena, the focus has shifted to inflation.
With interest rates reaching 343% in 2020, Venezuela has been a poster child for hyperinflationary forces. Energy shortages only compounded the effect which was well underway before the pandemic. Between April 2020 and March 2021, interest rates jumped over 50 percentage points.
In addition, Turkey and Brazil raised interest rates in March 2021 to dampen inflation. Interest rates in Turkey have increased 11.6 percentage points over the time frame, one of the highest absolute changes globally.
In 2020, the lira faced historic declines, causing the price of imports to climb significantly.
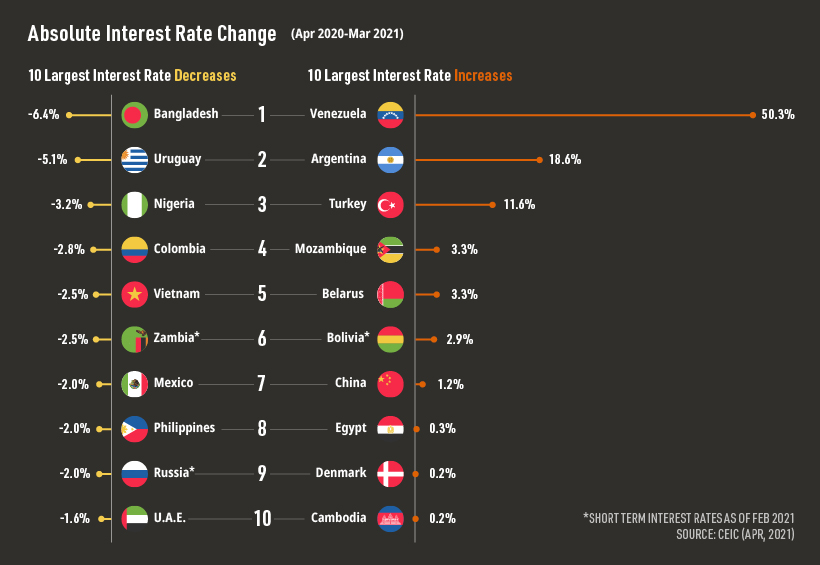
On the other hand, Bangladesh has seen its interest rates decline 6.4 percentage points, the steepest drop across the dataset. To help offset the effects of COVID-19, the Bangladesh Bank lowered interest rates from 7.1% to 0.7%.
With rates falling 3.2 percentage points, Nigeria has also seen one of the greatest interest rate drops. In March, Fitch Ratings gave the country a B rating with a stable outlook, supported by its low government debt-to-GDP ratio and large economy.
Research has found that countries with better credit ratings and transparent fiscal infrastructure had greater ability for central banks to lower interest rates in response to the crisis.
Sign of the Times
Policy rate changes, a key central bank maneuver, have been an important tool in response to COVID-19.
As economic activity in some countries picks up, interest rates could rise. However, progress in vaccination distribution remains uncertain, especially in emerging markets.
In tandem with this, global central banks are applying unproven monetary policy frameworks, including money creation and large-scale bond purchases. While studies show that interest rates have been falling over the past several centuries, the confluence of these factors will be revealing in the years that follow.


Markets in a Minute
The Top 5 Reasons Clients Fire a Financial Advisor
Firing an advisor is often driven by more than cost and performance factors. Here are the top reasons clients ‘break up’ with their advisors.

The Top 5 Reasons Clients Fire a Financial Advisor
What drives investors to fire a financial advisor?
From saving for a down payment to planning for retirement, clients turn to advisors to guide them through life’s complex financial decisions. However, many of the key reasons for firing a financial advisor stem from emotional factors, and go beyond purely financial motivations.
We partnered with Morningstar to show the top reasons clients fire an advisor to provide insight on what’s driving investor behavior.
What Drives Firing Decisions?
Here are the top reasons clients terminated their advisor, based on a survey of 184 respondents:
| Reason for Firing | % of Respondents Citing This Reason | Type of Motivation |
|---|---|---|
| Quality of financial advice and services | 32% | Emotion-based reason |
| Quality of relationship | 21% | Emotion-based reason |
| Cost of services | 17% | Financial-based reason |
| Return performance | 11% | Financial-based reason |
| Comfort handling financial issues on their own | 10% | Emotion-based reason |
Numbers may not total 100 due to rounding. Respondents could select more than one answer.
Numbers may not total 100 due to rounding. Respondents could select more than one answer.
While firing an advisor is rare, many of the primary drivers behind firing decisions are also emotionally driven.
Often, advisors were fired due to the quality of the relationship. In many cases, this was due to an advisor not dedicating enough time to fully grasp their personal financial goals. Additionally, wealthier, and more financially literate clients are more likely to fire their advisors—highlighting the importance of understanding the client.
Key Takeaways
Given these driving factors, here are five ways that advisors can build a lasting relationship through recognizing their clients’ emotional needs:
- Understand your clients’ deeper goals
- Reach out proactively
- Act as a financial coach
- Keep clients updated
- Conduct goal-setting exercises on a regular basis
By communicating their value and setting expectations early, advisors can help prevent setbacks in their practice by adeptly recognizing the emotional motivators of their clients.
Markets in a Minute
The Top 5 Reasons Clients Hire a Financial Advisor
Here are the most common drivers for hiring a financial advisor, revealing that investor motivations go beyond just financial factors.

The Top 5 Reasons Clients Hire a Financial Advisor
What drives investors to hire a financial advisor?
From saving for a down payment to planning for retirement, clients turn to advisors to guide them through life’s complex financial decisions. However, many of the key reasons for hiring a financial advisor stem from emotional factors, and go beyond purely financial motivations.
We partnered with Morningstar to show the top reasons clients hire a financial advisor to provide insight on what’s driving investor behavior.
What Drives Hiring Decisions?
Here are the most common reasons for hiring an advisor, based on a survey of 312 respondents.
| Reason for Hiring | % of Respondents Citing This Reason | Type of Motivation |
|---|---|---|
| Specific goals or needs | 32% | Financial-based reason |
| Discomfort handling finances | 32% | Emotion-based reason |
| Behavioral coaching | 17% | Emotion-based reason |
| Recommended by family or friends | 12% | Emotion-based reason |
| Quality of relationship | 10% | Emotion-based reason |
Numbers may not total 100 due to rounding. Respondents could select more than one answer.
While financial factors played an important role in hiring decisions, emotional reasons made up the largest share of total responses.
This illustrates that clients place a high degree of importance on reaching specific goals or needs, and how an advisor communicates with them. Furthermore, clients seek out advisors for behavioral coaching to help them make informed decisions while staying the course.
Key Takeaways
With this in mind, here are five ways advisors can provide value to their clients and grow their practice:
- Address clients’ emotional needs early on
- Demonstrate how you can offer support
- Use ordinary language
- Provide education to help clients stay on track
- Acknowledge that these are issues we all face
By addressing emotional factors, advisors can more effectively help clients’ navigate intricate financial decisions and avoid common behavioral mistakes.

The Top 5 Reasons Clients Fire a Financial Advisor

The Top 5 Reasons Clients Hire a Financial Advisor

Visualizing the Growth of $100, by Asset Class

How Small Investments Make a Big Impact Over Time

What Were the Top Performing Investment Themes of 2023?
-

 Infographics2 years ago
The Top Investment Quotes Every Investor Should Know
-

 Markets in a Minute2 years ago
Mapped: The Growth in U.S. House Prices by State
-

 Markets in a Minute2 years ago
How Closely Related Are Historical Mortgage Rates and Housing Prices?
-

 Infographics2 years ago
A Visual Guide to Stagflation, Inflation, and Deflation
-

 Markets in a Minute1 year ago
Mapped: Global Energy Prices, by Country in 2022
-

 Markets in a Minute2 years ago
Visualizing Historical Oil Prices (1968-2022)
-

 Infographics1 year ago
Visual Guide: The Three Types of Economic Indicators
-

 Markets in a Minute2 years ago
Mapped: Global Macroeconomic Risk, by Country in 2022
