
Markets in a Minute
Mapped: Global GDP Forecasts for 2021 and Beyond
How to use: Arrows on side navigate maps with global GDP changes in 2020, 2021p, and 2022p
This infographic is available as a poster.
Mapped: Global GDP Forecasts for 2021 and Beyond
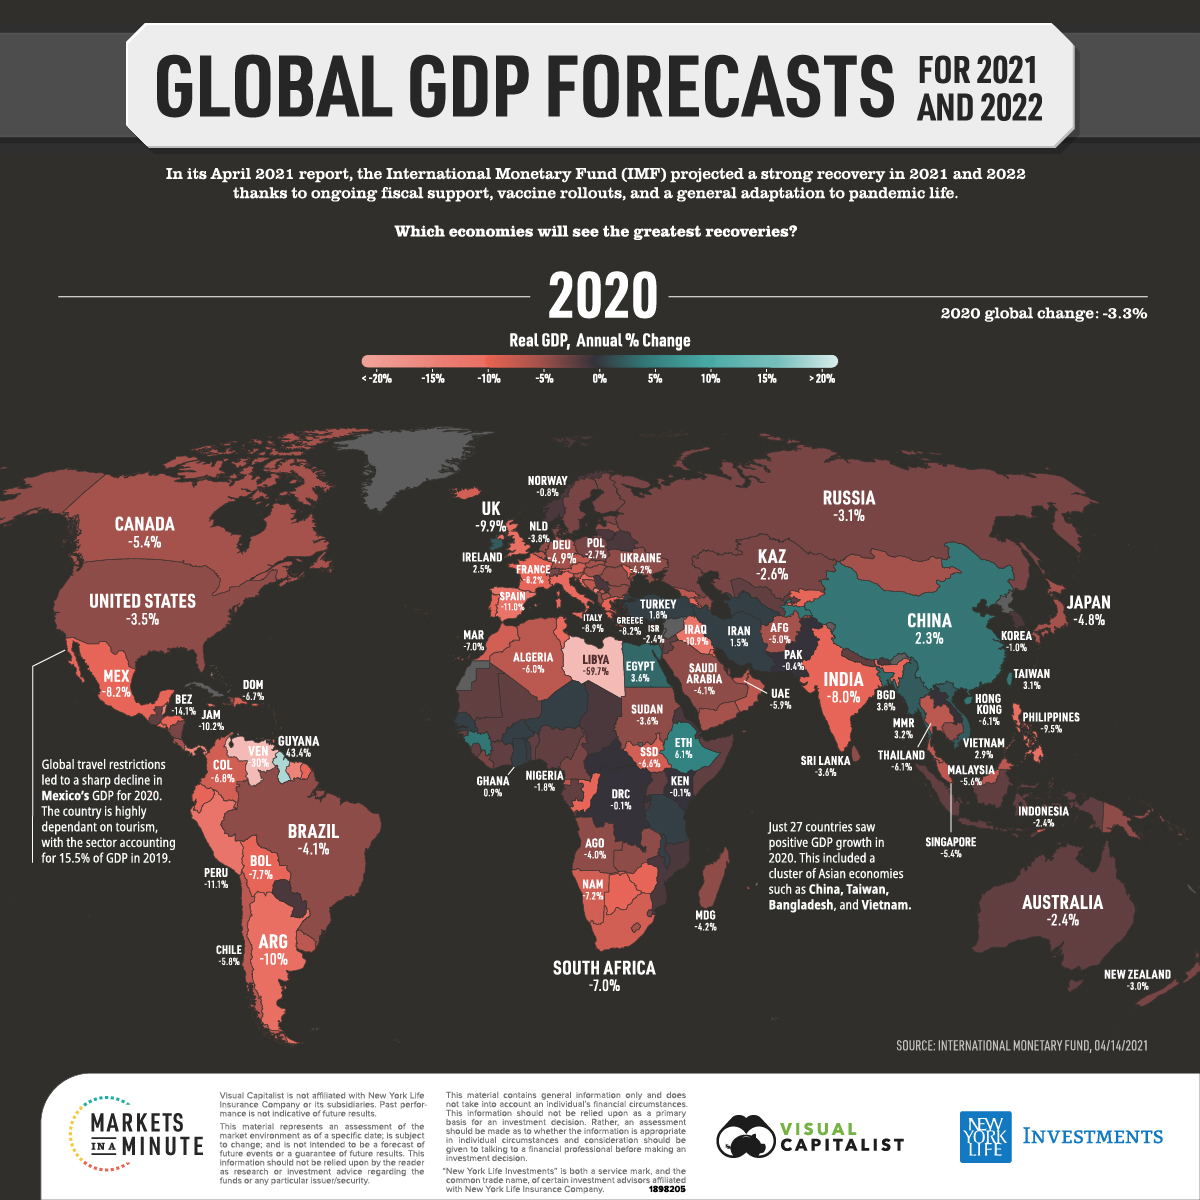
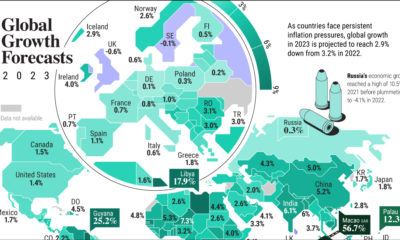
In the April 2021 version of its Global Economic Outlook, the International Monetary Fund (IMF) reiterated its expectations of a strong economic recovery over the next few years.
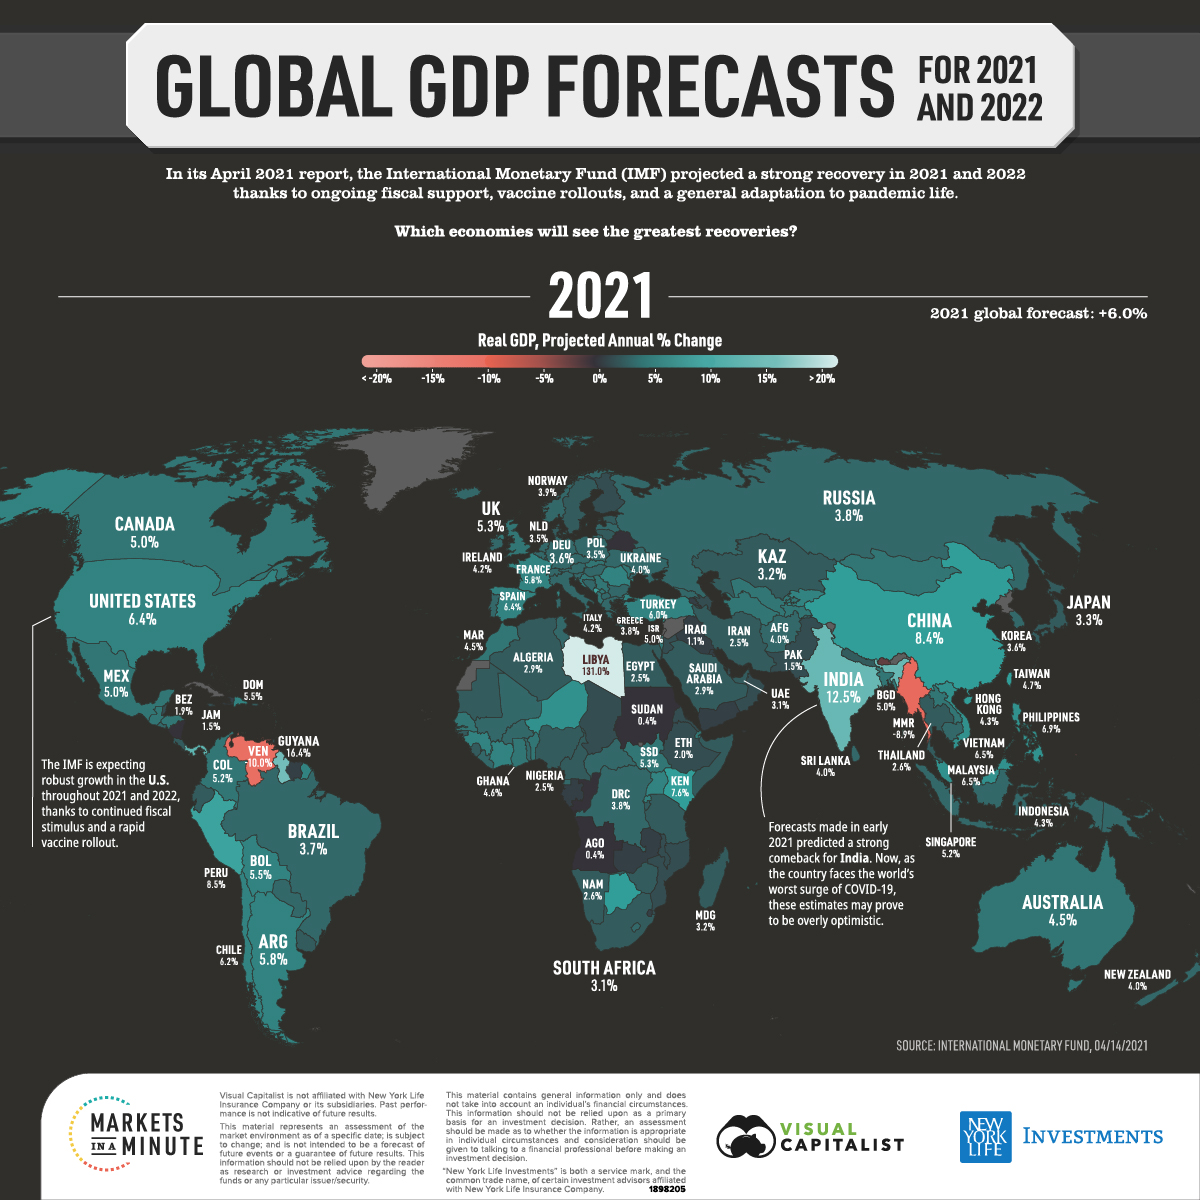
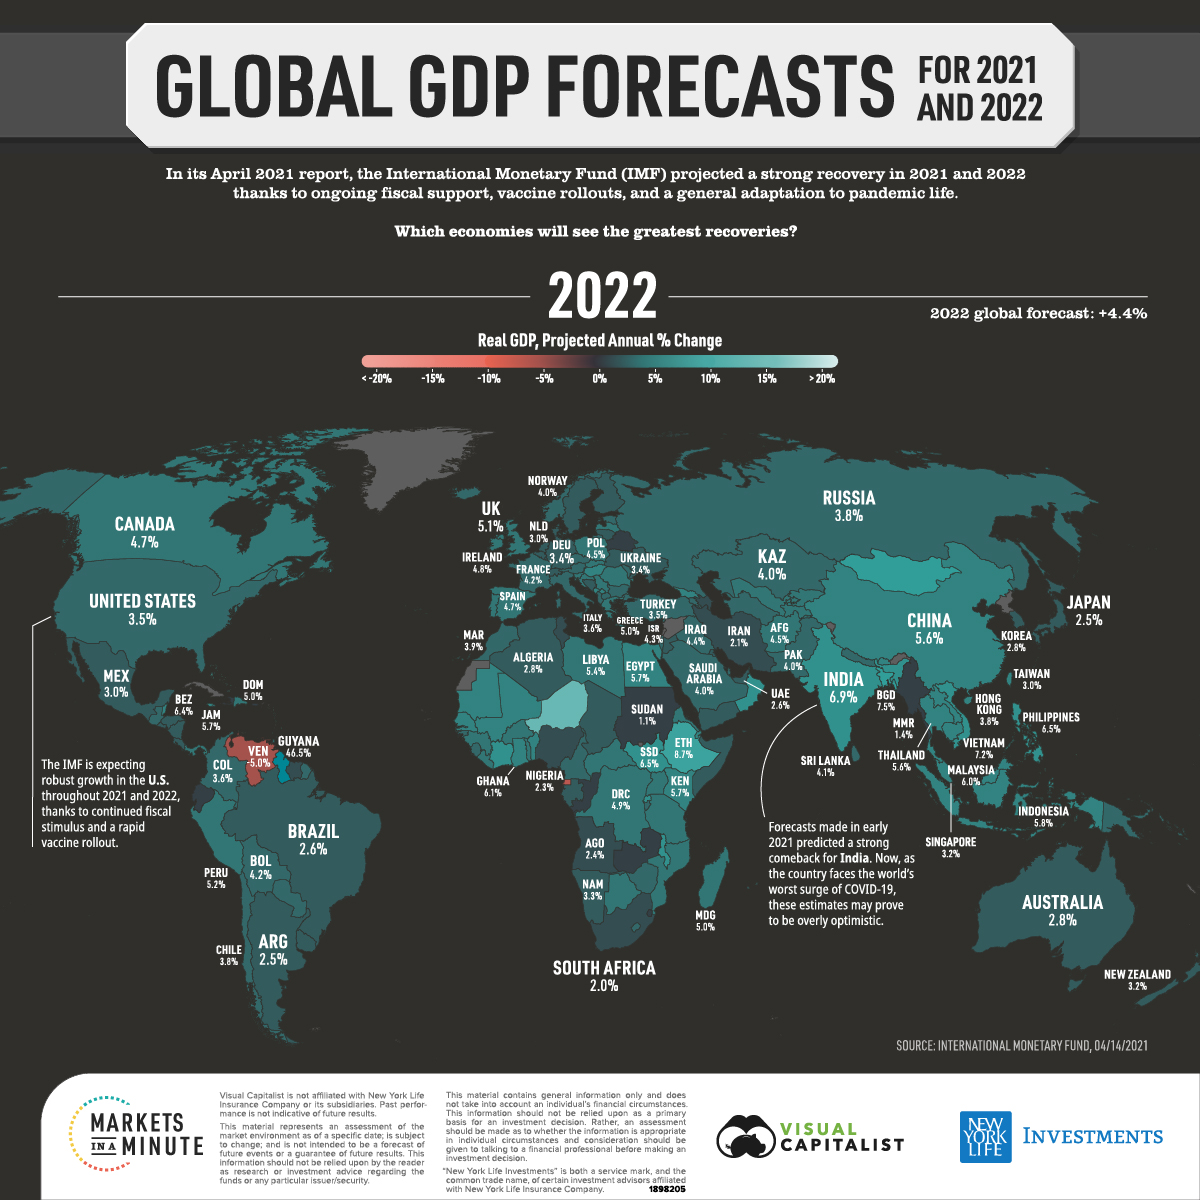
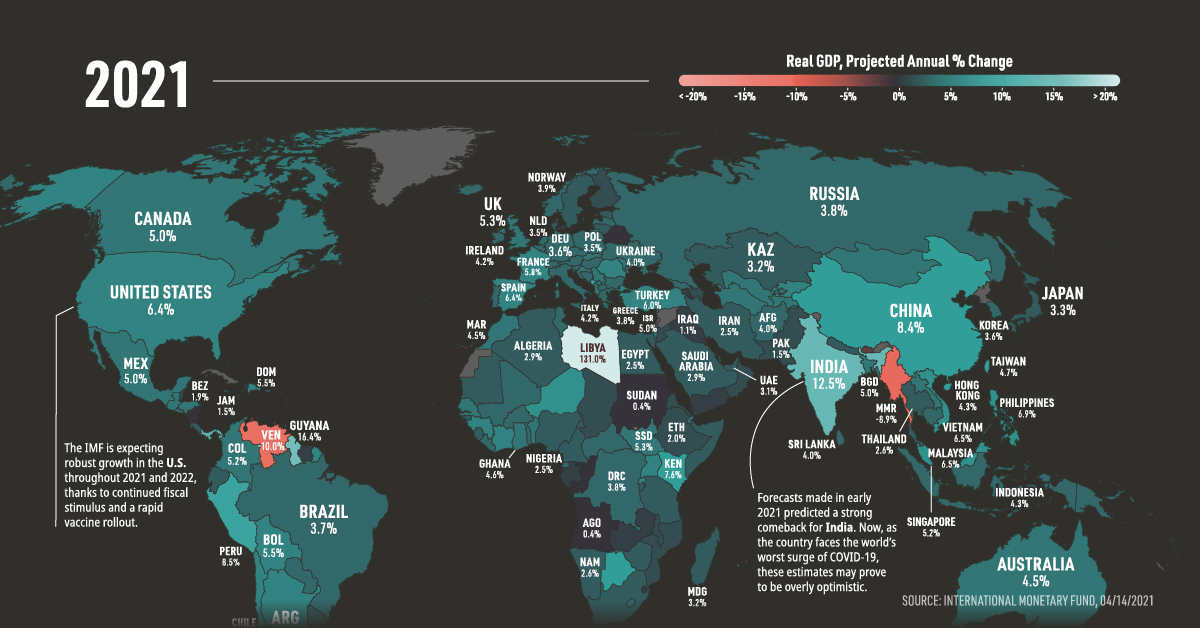
Economists acknowledged that, while the path of the pandemic remains uncertain, global vaccine rollouts represent the light at the end of the tunnel. As a result, global GDP growth forecasts for 2021 and 2022 sit at +6.0% and +4.4% respectively.
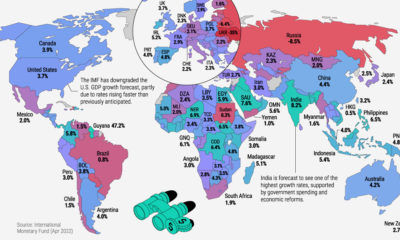
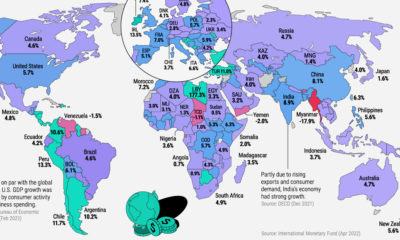
In this Markets in a Minute chart from New York Life Investments, we’ve mapped the IMF’s country-level GDP forecasts to see which areas are expected to have the greatest rebounds.
Country-level Data
The following table lists each country’s percentage GDP change for 2020, as well as forecasts for 2021 and 2022.
| Jurisdiction | 2020 GDP Growth (%) | 2021 GDP Growth Forecasts (%) | 2022 GDP Growth Forecasts (%) |
|---|---|---|---|
| Afghanistan | -5.0 | 4.0 | 4.5 |
| Albania | -3.5 | 5.0 | 4.0 |
| Algeria | -6.0 | 2.9 | 2.8 |
| Angola | -4.0 | 0.4 | 2.4 |
| Antigua and Barbuda | -17.3 | -3.0 | 11.9 |
| Argentina | -10.0 | 5.8 | 2.5 |
| Armenia | -7.6 | 1.0 | 3.5 |
| Aruba | -25.5 | 5.0 | 12.0 |
| Australia | -2.4 | 4.5 | 2.8 |
| Austria | -6.6 | 3.5 | 4.0 |
| Azerbaijan | -4.3 | 2.3 | 1.7 |
| Bahrain | -5.4 | 3.3 | 3.1 |
| Bangladesh | 3.8 | 5.0 | 7.5 |
| Barbados | -17.6 | 4.1 | 7.7 |
| Belarus | -0.9 | -0.4 | 0.8 |
| Belgium | -6.4 | 4.0 | 3.1 |
| Belize | -14.1 | 1.9 | 6.4 |
| Benin | 2.0 | 5.0 | 6.0 |
| Bhutan | -0.8 | -1.9 | 5.7 |
| Bolivia | -7.7 | 5.5 | 4.2 |
| Bosnia and Herzegovina | -5.5 | 3.5 | 3.3 |
| Botswana | -8.3 | 7.5 | 5.4 |
| Brazil | -4.1 | 3.7 | 2.6 |
| Brunei Darussalam | 1.2 | 1.6 | 2.5 |
| Bulgaria | -3.8 | 4.4 | 4.4 |
| Burkina Faso | 0.8 | 4.3 | 5.2 |
| Burundi | -1.3 | 2.8 | 3.7 |
| Cabo Verde | -14 | 5.8 | 6.0 |
| Cambodia | -3.5 | 4.2 | 6.0 |
| Cameroon | -2.8 | 3.4 | 4.3 |
| Canada | -5.4 | 5.0 | 4.7 |
| Central African Republic | 0 | 3.5 | 5.0 |
| Chad | -0.9 | 1.8 | 2.6 |
| Chile | -5.8 | 6.2 | 3.8 |
| China | 2.3 | 8.4 | 5.6 |
| Colombia | -6.8 | 5.2 | 3.6 |
| Comoros | -0.5 | 0 | 3.6 |
| Costa Rica | -4.8 | 2.6 | 3.3 |
| Côte d'Ivoire | 2.3 | 6.0 | 6.5 |
| Croatia | -9.0 | 4.7 | 5.0 |
| Cyprus | -5.1 | 3.0 | 3.9 |
| Czech Republic | -5.6 | 4.2 | 4.3 |
| Democratic Republic of the Congo | -0.1 | 3.8 | 4.9 |
| Denmark | -3.3 | 2.8 | 2.9 |
| Djibouti | -1.0 | 5.0 | 5.5 |
| Dominica | -10.4 | -0.4 | 5.8 |
| Dominican Republic | -6.7 | 5.5 | 5.0 |
| Ecuador | -7.5 | 2.5 | 1.3 |
| Egypt | 3.6 | 2.5 | 5.7 |
| El Salvador | -8.6 | 4.2 | 2.8 |
| Equatorial Guinea | -5.8 | 4.0 | -5.9 |
| Eritrea | -0.6 | 2.0 | 4.9 |
| Estonia | -2.9 | 3.4 | 4.2 |
| Eswatini | -3.3 | 1.4 | 0.9 |
| Ethiopia | 6.1 | 2.0 | 8.7 |
| Fiji | -19.0 | 5.0 | 9.0 |
| Finland | -2.9 | 2.3 | 2.5 |
| France | -8.2 | 5.8 | 4.2 |
| Gabon | -1.8 | 1.2 | 2.7 |
| Georgia | -6.1 | 3.5 | 5.8 |
| Germany | -4.9 | 3.6 | 3.4 |
| Ghana | 0.9 | 4.6 | 6.1 |
| Greece | -8.2 | 3.8 | 5.0 |
| Grenada | -13.5 | -1.5 | 5.2 |
| Guatemala | -1.5 | 4.5 | 4.0 |
| Guinea | 5.2 | 5.6 | 5.2 |
| Guinea-Bissau | -2.4 | 3.0 | 4.0 |
| Guyana | 43.4 | 16.4 | 46.5 |
| Haiti | -3.7 | 1.0 | 1.0 |
| Honduras | -8.0 | 4.5 | 3.3 |
| Hong Kong SAR | -6.1 | 4.3 | 3.8 |
| Hungary | -5.0 | 4.3 | 5.9 |
| Iceland | -6.6 | 3.7 | 3.6 |
| India | -8.0 | 12.5 | 6.9 |
| Indonesia | -2.1 | 4.3 | 5.8 |
| Iraq | -10.9 | 1.1 | 4.4 |
| Ireland | 2.5 | 4.2 | 4.8 |
| Islamic Republic of Iran | 1.5 | 2.5 | 2.1 |
| Israel | -2.4 | 5.0 | 4.3 |
| Italy | -8.9 | 4.2 | 3.6 |
| Jamaica | -10.2 | 1.5 | 5.7 |
| Japan | -4.8 | 3.3 | 2.5 |
| Jordan | -2.0 | 2.0 | 2.7 |
| Kazakhstan | -2.6 | 3.2 | 4.0 |
| Kenya | -0.1 | 7.6 | 5.7 |
| Kiribati | -0.5 | 1.8 | 2.5 |
| Korea | -1.0 | 3.6 | 2.8 |
| Kosovo | -6.0 | 4.5 | 5.5 |
| Kuwait | -8.1 | 0.7 | 3.2 |
| Kyrgyz Republic | -8.0 | 6.0 | 4.6 |
| Lao P.D.R. | -0.4 | 4.6 | 5.6 |
| Latvia | -3.6 | 3.9 | 5.2 |
| Lebanon | -25 | n/a | n/a |
| Lesotho | -4.5 | 3.5 | 4.3 |
| Liberia | -3.0 | 3.6 | 4.7 |
| Libya | -59.7 | 131 | 5.4 |
| Lithuania | -0.8 | 3.2 | 3.2 |
| Luxembourg | -1.3 | 4.1 | 3.6 |
| Macao SAR | -56.3 | 61.2 | 43.0 |
| Madagascar | -4.2 | 3.2 | 5.0 |
| Malawi | 0.6 | 2.2 | 6.5 |
| Malaysia | -5.6 | 6.5 | 6.0 |
| Maldives | -32.2 | 18.9 | 13.4 |
| Mali | -2.0 | 4.0 | 6.0 |
| Malta | -7.0 | 4.7 | 5.6 |
| Marshall Islands | -3.3 | -1.5 | 3.5 |
| Mauritania | -2.2 | 3.1 | 5.6 |
| Mauritius | -15.8 | 6.6 | 5.2 |
| Mexico | -8.2 | 5.0 | 3.0 |
| Micronesia | -1.6 | -3.7 | 2.8 |
| Moldova | -7.5 | 4.5 | 4.0 |
| Mongolia | -5.3 | 5.0 | 7.5 |
| Montenegro | -15.2 | 9.0 | 5.5 |
| Morocco | -7.0 | 4.5 | 3.9 |
| Mozambique | -0.5 | 2.1 | 4.7 |
| Myanmar | 3.2 | -8.9 | 1.4 |
| Namibia | -7.2 | 2.6 | 3.3 |
| Nauru | 0.7 | 1.6 | 0.9 |
| Nepal | -1.9 | 2.9 | 4.2 |
| Netherlands | -3.8 | 3.5 | 3.0 |
| New Zealand | -3.0 | 4.0 | 3.2 |
| Nicaragua | -3.0 | 0.2 | 2.7 |
| Niger | 1.2 | 6.9 | 12.8 |
| Nigeria | -1.8 | 2.5 | 2.3 |
| North Macedonia | -4.5 | 3.8 | 4.0 |
| Norway | -0.8 | 3.9 | 4.0 |
| Oman | -6.4 | 1.8 | 7.4 |
| Pakistan | -0.4 | 1.5 | 4.0 |
| Palau | -10.3 | -10.8 | 10.4 |
| Panama | -17.9 | 12.0 | 5.0 |
| Papua New Guinea | -3.9 | 3.5 | 4.2 |
| Paraguay | -0.9 | 4.0 | 4.0 |
| Peru | -11.1 | 8.5 | 5.2 |
| Philippines | -9.5 | 6.9 | 6.5 |
| Poland | -2.7 | 3.5 | 4.5 |
| Portugal | -7.6 | 3.9 | 4.8 |
| Puerto Rico | -7.5 | 2.5 | 0.7 |
| Qatar | -2.6 | 2.4 | 3.6 |
| Republic of Congo | -7.8 | 0.2 | 1.0 |
| Romania | -3.9 | 6.0 | 4.8 |
| Russia | -3.1 | 3.8 | 3.8 |
| Rwanda | -0.2 | 5.7 | 6.8 |
| Samoa | -3.2 | -7.8 | 1.7 |
| San Marino | -9.7 | 4.5 | 3.4 |
| São Tomé and Príncipe | -6.5 | 3.0 | 5.0 |
| Saudi Arabia | -4.1 | 2.9 | 4.0 |
| Senegal | 0.8 | 5.2 | 6.0 |
| Serbia | -1.0 | 5.0 | 4.5 |
| Seychelles | -13.4 | 1.8 | 4.3 |
| Sierra Leone | -2.2 | 3.0 | 3.6 |
| Singapore | -5.4 | 5.2 | 3.2 |
| Slovak Republic | -5.2 | 4.7 | 4.5 |
| Slovenia | -5.5 | 3.7 | 4.5 |
| Solomon Islands | -4.3 | 1.5 | 4.5 |
| Somalia | -1.5 | 2.9 | 3.2 |
| South Africa | -7 | 3.1 | 2.0 |
| South Sudan | -6.6 | 5.3 | 6.5 |
| Spain | -11.0 | 6.4 | 4.7 |
| Sri Lanka | -3.6 | 4.0 | 4.1 |
| St. Kitts and Nevis | -18.7 | -2.0 | 10.0 |
| St. Lucia | -18.9 | 3.1 | 10.7 |
| St. Vincent and the Grenadines | -4.2 | -0.1 | 4.9 |
| Sudan | -3.6 | 0.4 | 1.1 |
| Suriname | -13.5 | 0.7 | 1.5 |
| Sweden | -2.8 | 3.1 | 3.0 |
| Switzerland | -3.0 | 3.5 | 2.8 |
| Syria | n/a | n/a | n/a |
| Taiwan Province of China | 3.1 | 4.7 | 3.0 |
| Tajikistan | 4.5 | 5.0 | 4.5 |
| Tanzania | 1.0 | 2.7 | 4.6 |
| Thailand | -6.1 | 2.6 | 5.6 |
| The Bahamas | -16.3 | 2.0 | 8.5 |
| The Gambia | 0 | 6.0 | 6.5 |
| Timor-Leste | -6.8 | 2.8 | 4.9 |
| Togo | 0.7 | 3.5 | 4.5 |
| Tonga | -0.5 | -2.5 | 2.5 |
| Trinidad and Tobago | -7.8 | 2.1 | 4.1 |
| Tunisia | -8.8 | 3.8 | 2.4 |
| Turkey | 1.8 | 6.0 | 3.5 |
| Turkmenistan | 0.8 | 4.6 | 3.9 |
| Tuvalu | 0.5 | 2.5 | 3.5 |
| Uganda | -2.1 | 6.3 | 5.0 |
| Ukraine | -4.2 | 4.0 | 3.4 |
| United Arab Emirates | -5.9 | 3.1 | 2.6 |
| United Kingdom | -9.9 | 5.3 | 5.1 |
| United States | -3.5 | 6.4 | 3.5 |
| Uruguay | -5.7 | 3.0 | 3.1 |
| Uzbekistan | 1.6 | 5.0 | 5.3 |
| Vanuatu | -9.2 | 3.2 | 4.6 |
| Venezuela | -30.0 | -10.0 | -5.0 |
| Vietnam | 2.9 | 6.5 | 7.2 |
| West Bank and Gaza | -11.0 | 5.7 | 7.0 |
| Yemen | -5.0 | 0.5 | 2.5 |
| Zambia | -3.5 | 0.6 | 1.1 |
| Zimbabwe | -8.0 | 3.1 | 4.0 |
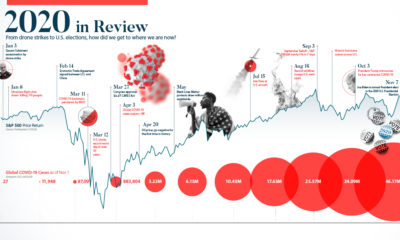
Just 27 countries saw positive GDP growth in 2020, including a cluster of Asian economies that includes China, Taiwan, and Vietnam. Although the virus originated in China, the country’s strict lockdowns enabled it to flatten the infection curve relatively quick. As a result, Asia’s biggest economy returned to pre-COVID GDP levels in 2020—something most others aren’t expected to do until 2023.
Forecasts for 2021 are very positive, with the vast majority of countries expected to bounce back economically. Within advanced economies, the U.S. is expected to be a strong performer. The IMF believes that the Biden administration’s new fiscal package, valued at $1.9 trillion, will provide a strong boost to growth.
Looking further to 2022, the IMF expects GDP growth to remain positive around the world. Many European economies will experience positive GDP growth above 3%, including France (+4.2%), Germany (+3.4%), and Spain (+4.7%). The European Central Bank (ECB) has relied on expansionary monetary policy to stimulate its economy during the pandemic, growing its balance sheet by over $2 trillion since February 2020.
Uncertainty Remains, Despite Vaccine Rollouts
Given the unpredictable nature of COVID-19 and its many variants, the GDP forecasts visualized in the above maps should not be interpreted as concrete figures.
India, which was forecasted to grow its GDP by 12.5% in 2021, is now facing the world’s worst surge of COVID-19, fueled in part by the emerging B1617 variant that many are dubbing a “double mutation”.
“We completely let down our guard and assumed in January that the pandemic was over.”
– K. Srinath Reddy, President, Public Health Foundation of India
It remains to be seen if India’s second outbreak will significantly impact its economy, or even the economies of other countries. This situation does, however, serve as a reminder that the virus can still surprise us.


Markets in a Minute
The Top 5 Reasons Clients Fire a Financial Advisor
Firing an advisor is often driven by more than cost and performance factors. Here are the top reasons clients ‘break up’ with their advisors.

The Top 5 Reasons Clients Fire a Financial Advisor
What drives investors to fire a financial advisor?
From saving for a down payment to planning for retirement, clients turn to advisors to guide them through life’s complex financial decisions. However, many of the key reasons for firing a financial advisor stem from emotional factors, and go beyond purely financial motivations.
We partnered with Morningstar to show the top reasons clients fire an advisor to provide insight on what’s driving investor behavior.
What Drives Firing Decisions?
Here are the top reasons clients terminated their advisor, based on a survey of 184 respondents:
| Reason for Firing | % of Respondents Citing This Reason | Type of Motivation |
|---|---|---|
| Quality of financial advice and services | 32% | Emotion-based reason |
| Quality of relationship | 21% | Emotion-based reason |
| Cost of services | 17% | Financial-based reason |
| Return performance | 11% | Financial-based reason |
| Comfort handling financial issues on their own | 10% | Emotion-based reason |
Numbers may not total 100 due to rounding. Respondents could select more than one answer.
Numbers may not total 100 due to rounding. Respondents could select more than one answer.
While firing an advisor is rare, many of the primary drivers behind firing decisions are also emotionally driven.
Often, advisors were fired due to the quality of the relationship. In many cases, this was due to an advisor not dedicating enough time to fully grasp their personal financial goals. Additionally, wealthier, and more financially literate clients are more likely to fire their advisors—highlighting the importance of understanding the client.
Key Takeaways
Given these driving factors, here are five ways that advisors can build a lasting relationship through recognizing their clients’ emotional needs:
- Understand your clients’ deeper goals
- Reach out proactively
- Act as a financial coach
- Keep clients updated
- Conduct goal-setting exercises on a regular basis
By communicating their value and setting expectations early, advisors can help prevent setbacks in their practice by adeptly recognizing the emotional motivators of their clients.
Markets in a Minute
The Top 5 Reasons Clients Hire a Financial Advisor
Here are the most common drivers for hiring a financial advisor, revealing that investor motivations go beyond just financial factors.

The Top 5 Reasons Clients Hire a Financial Advisor
What drives investors to hire a financial advisor?
From saving for a down payment to planning for retirement, clients turn to advisors to guide them through life’s complex financial decisions. However, many of the key reasons for hiring a financial advisor stem from emotional factors, and go beyond purely financial motivations.
We partnered with Morningstar to show the top reasons clients hire a financial advisor to provide insight on what’s driving investor behavior.
What Drives Hiring Decisions?
Here are the most common reasons for hiring an advisor, based on a survey of 312 respondents.
| Reason for Hiring | % of Respondents Citing This Reason | Type of Motivation |
|---|---|---|
| Specific goals or needs | 32% | Financial-based reason |
| Discomfort handling finances | 32% | Emotion-based reason |
| Behavioral coaching | 17% | Emotion-based reason |
| Recommended by family or friends | 12% | Emotion-based reason |
| Quality of relationship | 10% | Emotion-based reason |
Numbers may not total 100 due to rounding. Respondents could select more than one answer.
While financial factors played an important role in hiring decisions, emotional reasons made up the largest share of total responses.
This illustrates that clients place a high degree of importance on reaching specific goals or needs, and how an advisor communicates with them. Furthermore, clients seek out advisors for behavioral coaching to help them make informed decisions while staying the course.
Key Takeaways
With this in mind, here are five ways advisors can provide value to their clients and grow their practice:
- Address clients’ emotional needs early on
- Demonstrate how you can offer support
- Use ordinary language
- Provide education to help clients stay on track
- Acknowledge that these are issues we all face
By addressing emotional factors, advisors can more effectively help clients’ navigate intricate financial decisions and avoid common behavioral mistakes.

The Top 5 Reasons Clients Fire a Financial Advisor

The Top 5 Reasons Clients Hire a Financial Advisor

Visualizing the Growth of $100, by Asset Class

How Small Investments Make a Big Impact Over Time

What Were the Top Performing Investment Themes of 2023?
-

 Infographics2 years ago
The Top Investment Quotes Every Investor Should Know
-

 Markets in a Minute2 years ago
Mapped: The Growth in U.S. House Prices by State
-

 Markets in a Minute2 years ago
How Closely Related Are Historical Mortgage Rates and Housing Prices?
-

 Infographics2 years ago
A Visual Guide to Stagflation, Inflation, and Deflation
-

 Markets in a Minute1 year ago
Mapped: Global Energy Prices, by Country in 2022
-

 Markets in a Minute2 years ago
Visualizing Historical Oil Prices (1968-2022)
-

 Infographics1 year ago
Visual Guide: The Three Types of Economic Indicators
-

 Markets in a Minute2 years ago
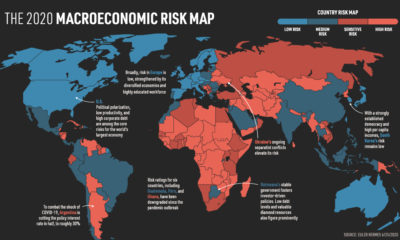
Mapped: Global Macroeconomic Risk, by Country in 2022
