
Markets in a Minute
Data Centers: Investing in the Infrastructure of the Future
This infographic is available as a poster.
This infographic is available as a poster.
Data Centers: Investing in the Infrastructure of the Future
Digital transformation is one of the world’s most prominent trends today.
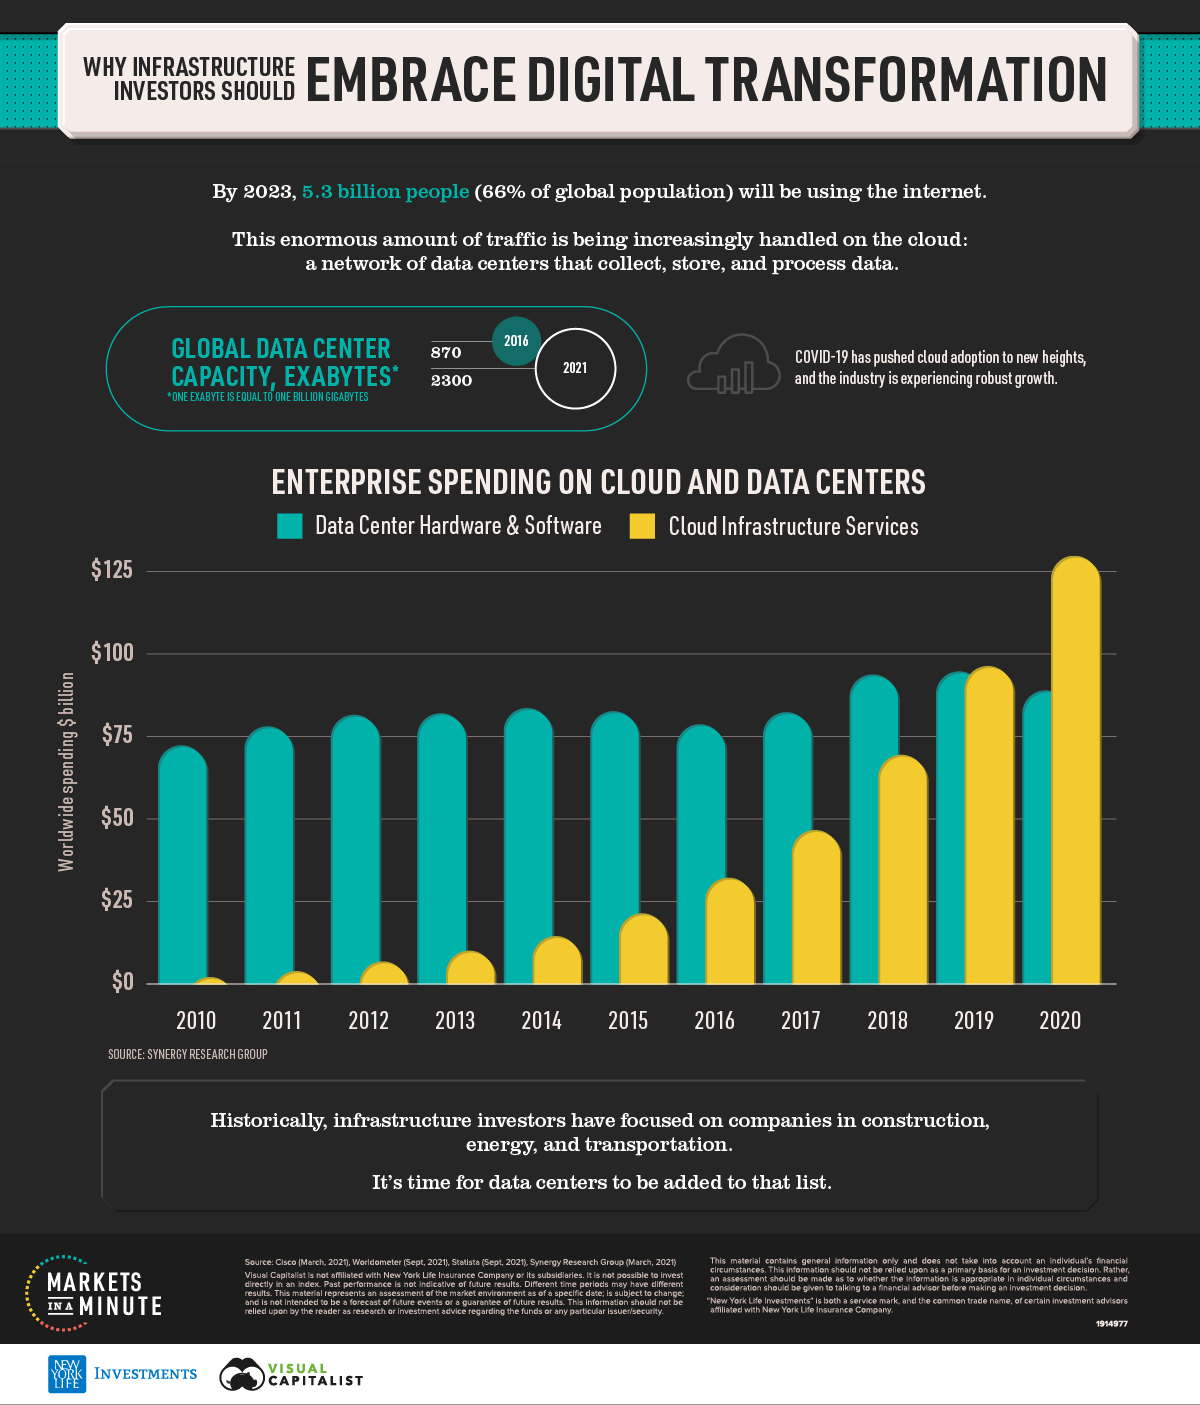
For evidence, consider the growth in internet users worldwide. By 2023, 5.3 billion people (66% of population) will be using the internet, up from 3.9 billion (51% of population) in 2018.
This growth has resulted in an incredible amount of data being produced each day, whether its from streaming music on Spotify or buying goods on Amazon. But how is all this data being processed?
In this Markets in a Minute chart from New York Life Investments, we shed light on the importance of data centers, and why they should be considered as core infrastructure.
The Role of the Data Center
A data center is a facility that stores, processes, and disseminates data. There are thousands of them around the world, and collectively, they’re referred to as the “cloud”.
This puts data centers at the center of nearly everything we do online: e-commerce, communications, storage and back-up, and even online gaming. To gain a better sense of what this all looks like, the following table breaks down the storage capacity of the world’s data centers.
| Segment | 2016 Storage Capacity (exabytes) | 2021 Storage Capacity (exabytes) |
|---|---|---|
| Compute | 160 | 470 |
| Collaboration | 170 | 400 |
| Database & analytics | 150 | 380 |
| Enterprise resource planning | 180 | 420 |
| Video streaming | 50 | 180 |
| Social networking | 60 | 160 |
| Search engine | 30 | 100 |
| Other consumer apps | 70 | 190 |
| Total | 870 | 2,300 |
Source: Statista (2021)
One exabyte is equal to one billion gigabytes, which means the world currently has 2.3 trillion gigabytes of total storage.
The largest segment is compute instances, which are cloud-based workstations used by data scientists. At the lower end of the scale are segments like video streaming (includes Netflix and Hulu) and social networking (think Facebook or LinkedIn).
Cloud Spending Reaches a Historic Milestone
For businesses that create and use data, moving to the cloud (as opposed to maintaining their own servers) has plenty of advantages like cost savings, flexibility, and security.
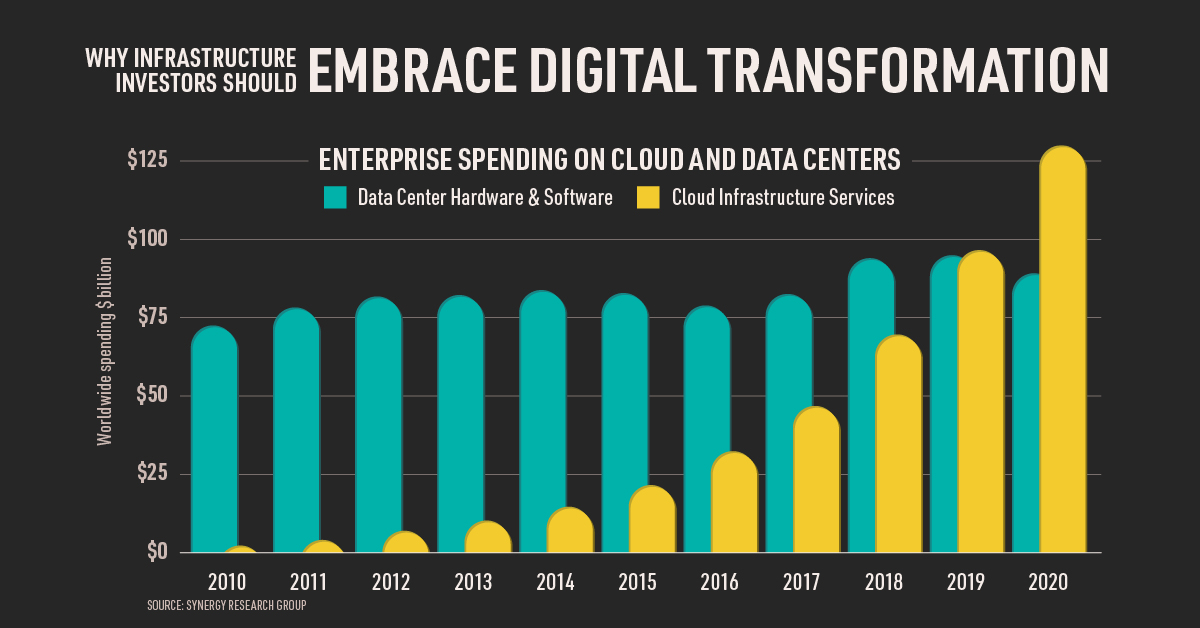
This is driving exponential growth in cloud infrastructure spending, which reached a record $130 billion in 2020. At the same time, spending on data center hardware decreased from $96 to $90 billion. These results are partly attributed to COVID-19, which forced many businesses to switch to a work-from-home operating model.
A survey conducted by 451 Research found that 40% of businesses had increased their usage of cloud services during the pandemic. In addition, 85% of those who were impacted indicated that the move would be a permanent one.
Data Centers are Infrastrcture
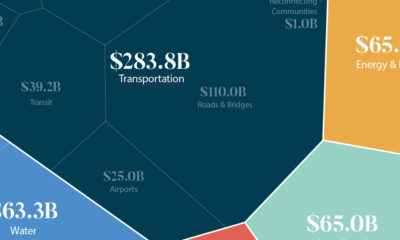
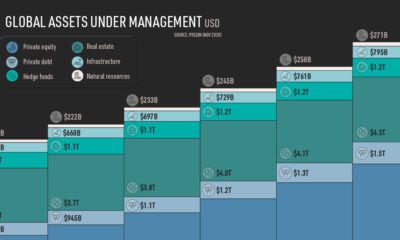
The scope of an infrastructure investor has historically been limited to companies in construction, energy, and transportation.
But what defines infrastructure?
It’s any physical system that is vital for an economy’s development and prosperity—and in a world where over 5 billion people are expected to be online by 2023, the data center is the perfect embodiment of that.


Markets in a Minute
The Top 5 Reasons Clients Fire a Financial Advisor
Firing an advisor is often driven by more than cost and performance factors. Here are the top reasons clients ‘break up’ with their advisors.

The Top 5 Reasons Clients Fire a Financial Advisor
What drives investors to fire a financial advisor?
From saving for a down payment to planning for retirement, clients turn to advisors to guide them through life’s complex financial decisions. However, many of the key reasons for firing a financial advisor stem from emotional factors, and go beyond purely financial motivations.
We partnered with Morningstar to show the top reasons clients fire an advisor to provide insight on what’s driving investor behavior.
What Drives Firing Decisions?
Here are the top reasons clients terminated their advisor, based on a survey of 184 respondents:
| Reason for Firing | % of Respondents Citing This Reason | Type of Motivation |
|---|---|---|
| Quality of financial advice and services | 32% | Emotion-based reason |
| Quality of relationship | 21% | Emotion-based reason |
| Cost of services | 17% | Financial-based reason |
| Return performance | 11% | Financial-based reason |
| Comfort handling financial issues on their own | 10% | Emotion-based reason |
Numbers may not total 100 due to rounding. Respondents could select more than one answer.
Numbers may not total 100 due to rounding. Respondents could select more than one answer.
While firing an advisor is rare, many of the primary drivers behind firing decisions are also emotionally driven.
Often, advisors were fired due to the quality of the relationship. In many cases, this was due to an advisor not dedicating enough time to fully grasp their personal financial goals. Additionally, wealthier, and more financially literate clients are more likely to fire their advisors—highlighting the importance of understanding the client.
Key Takeaways
Given these driving factors, here are five ways that advisors can build a lasting relationship through recognizing their clients’ emotional needs:
- Understand your clients’ deeper goals
- Reach out proactively
- Act as a financial coach
- Keep clients updated
- Conduct goal-setting exercises on a regular basis
By communicating their value and setting expectations early, advisors can help prevent setbacks in their practice by adeptly recognizing the emotional motivators of their clients.
Markets in a Minute
The Top 5 Reasons Clients Hire a Financial Advisor
Here are the most common drivers for hiring a financial advisor, revealing that investor motivations go beyond just financial factors.

The Top 5 Reasons Clients Hire a Financial Advisor
What drives investors to hire a financial advisor?
From saving for a down payment to planning for retirement, clients turn to advisors to guide them through life’s complex financial decisions. However, many of the key reasons for hiring a financial advisor stem from emotional factors, and go beyond purely financial motivations.
We partnered with Morningstar to show the top reasons clients hire a financial advisor to provide insight on what’s driving investor behavior.
What Drives Hiring Decisions?
Here are the most common reasons for hiring an advisor, based on a survey of 312 respondents.
| Reason for Hiring | % of Respondents Citing This Reason | Type of Motivation |
|---|---|---|
| Specific goals or needs | 32% | Financial-based reason |
| Discomfort handling finances | 32% | Emotion-based reason |
| Behavioral coaching | 17% | Emotion-based reason |
| Recommended by family or friends | 12% | Emotion-based reason |
| Quality of relationship | 10% | Emotion-based reason |
Numbers may not total 100 due to rounding. Respondents could select more than one answer.
While financial factors played an important role in hiring decisions, emotional reasons made up the largest share of total responses.
This illustrates that clients place a high degree of importance on reaching specific goals or needs, and how an advisor communicates with them. Furthermore, clients seek out advisors for behavioral coaching to help them make informed decisions while staying the course.
Key Takeaways
With this in mind, here are five ways advisors can provide value to their clients and grow their practice:
- Address clients’ emotional needs early on
- Demonstrate how you can offer support
- Use ordinary language
- Provide education to help clients stay on track
- Acknowledge that these are issues we all face
By addressing emotional factors, advisors can more effectively help clients’ navigate intricate financial decisions and avoid common behavioral mistakes.

The Top 5 Reasons Clients Fire a Financial Advisor

The Top 5 Reasons Clients Hire a Financial Advisor

Visualizing the Growth of $100, by Asset Class

How Small Investments Make a Big Impact Over Time

What Were the Top Performing Investment Themes of 2023?
-

 Infographics2 years ago
The Top Investment Quotes Every Investor Should Know
-

 Markets in a Minute2 years ago
Mapped: The Growth in U.S. House Prices by State
-

 Markets in a Minute2 years ago
How Closely Related Are Historical Mortgage Rates and Housing Prices?
-

 Infographics2 years ago
A Visual Guide to Stagflation, Inflation, and Deflation
-

 Markets in a Minute1 year ago
Mapped: Global Energy Prices, by Country in 2022
-

 Markets in a Minute2 years ago
Visualizing Historical Oil Prices (1968-2022)
-

 Infographics1 year ago
Visual Guide: The Three Types of Economic Indicators
-

 Markets in a Minute2 years ago
Mapped: Global Macroeconomic Risk, by Country in 2022
