
Markets in a Minute
How Dominant is the U.S. Dollar?
This infographic is available as a poster.
How Dominant is the U.S. Dollar?
The U.S. dollar has been the world’s dominant currency since the end of World War II.
According to the Congressional Research Service, roughly half of international trade, international loans, and global debt securities are denominated in USD. The same goes for many of the world’s most important commodities including gold, silver, and crude oil.
In this Markets in a Minute chart from New York Life Investments, we provide a snapshot of the U.S. dollar’s global standing.
The World’s Most Traded Currency Pairs
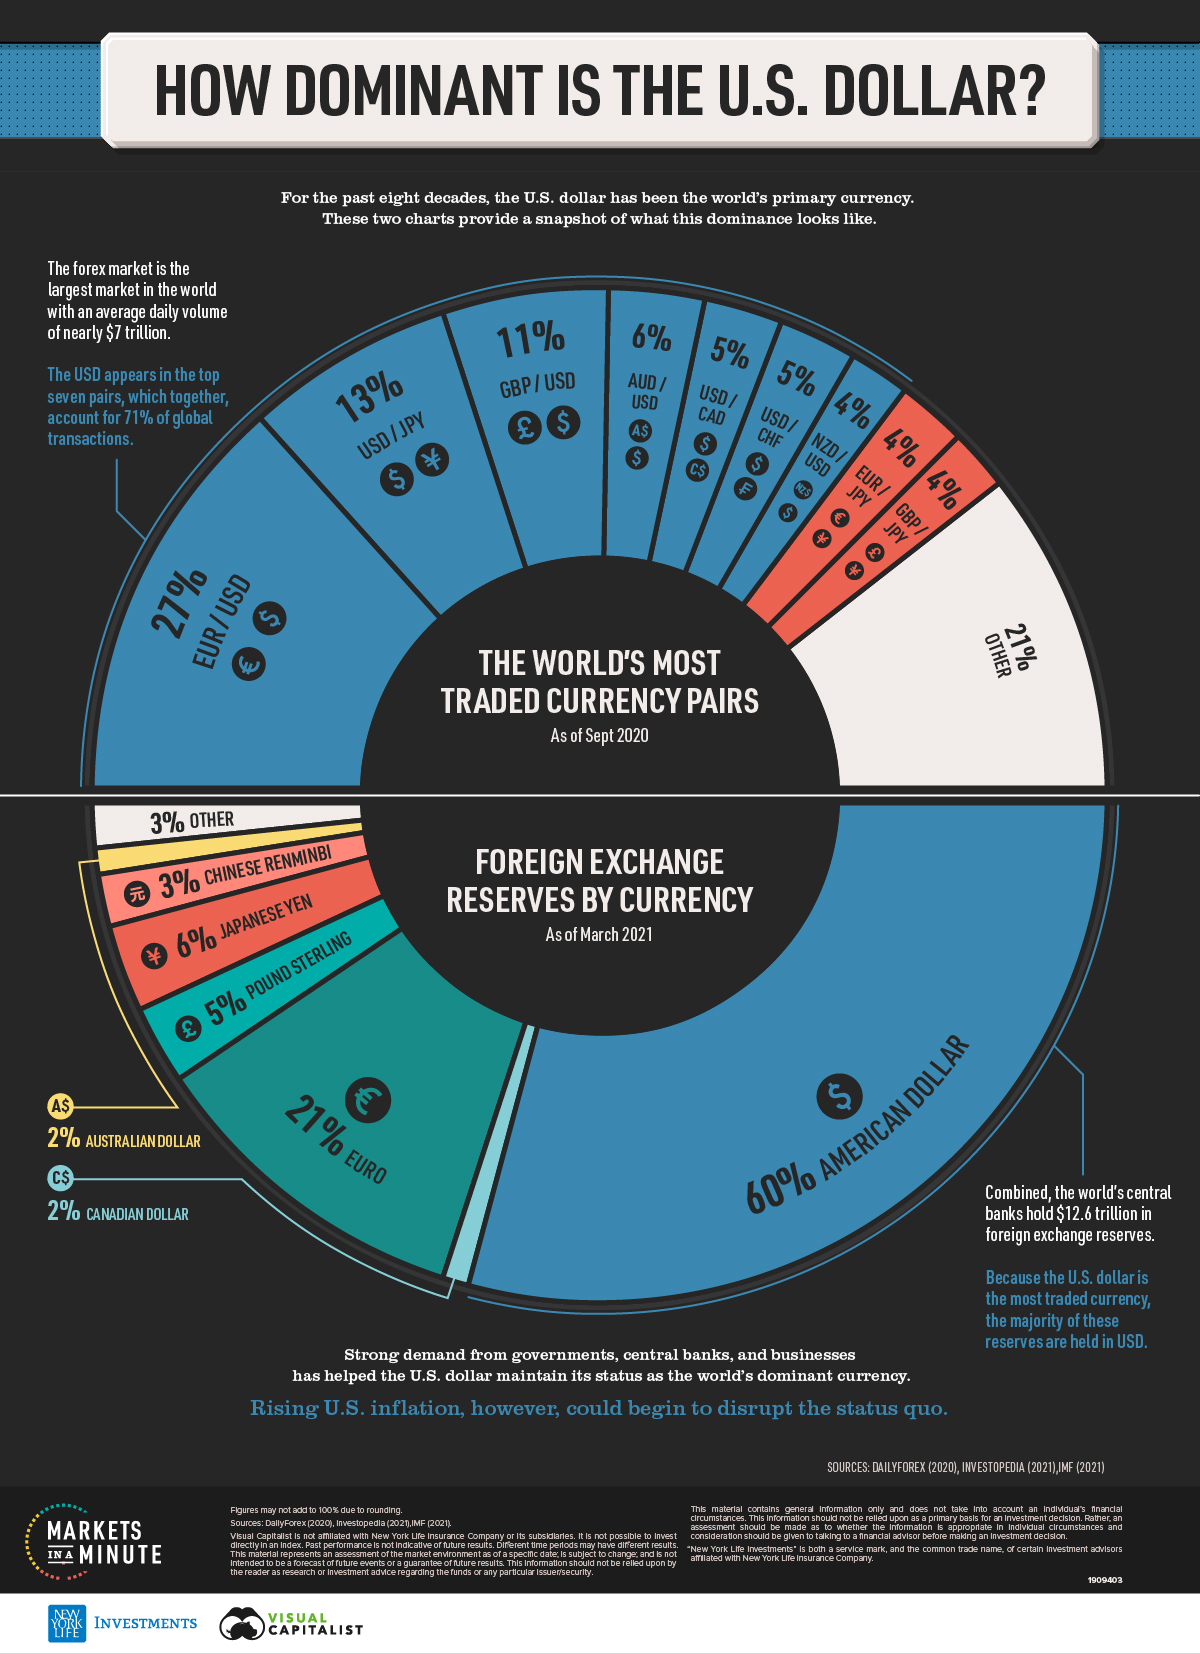
The foreign exchange market is the largest financial market in the world, with an average daily trading volume of almost $7 trillion. The majority of this volume is driven by banks, corporations, and other financial institutions.
More than 70% of this volume is generated from the top seven currency pairs, all of which involve the U.S. dollar.
| Currency Pair | Share of Global Transactions |
|---|---|
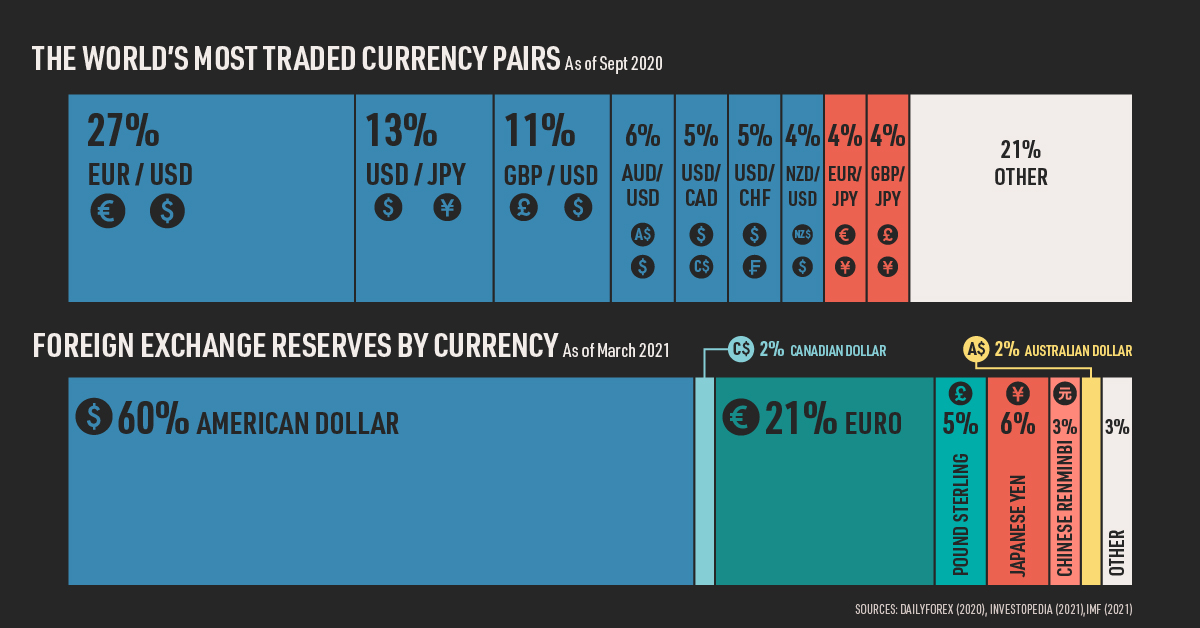
| EUR/USD | 27% |
| USD/JPY | 13% |
| GBP/USD | 11% |
| AUD/USD | 6% |
| USD/CAD | 5% |
| USD/CHF | 5% |
| NZD/USD | 4% |
| EUR/JPY | 4% |
| GBP/JPY | 4% |
| Other | 21% |
Figures may not add to 100% due to rounding.
The EUR/USD pair is the world’s most traded currency pair and is commonly referred to as “fiber”. It indicates how many U.S. dollars are needed to purchase one euro.
Foreign Exchange Reserves by Currency
Central banks typically hold foreign exchange reserves for purposes such as:
- Influencing exchange rates
- Maintaining liquidity in the event of a crisis
- Backing debt obligations
Given its status as the world’s dominant currency, the USD naturally represents a majority of these reserves.
| Currency | Share of Total Reserves |
|---|---|
| US dollar | 60% |
| Euro | 21% |
| Japanese Yen | 6% |
| Pound sterling | 5% |
| Chinese renminbi | 3% |
| Australian dollar | 2% |
| Canadian dollar | 2% |
| Other | 3% |
Figures may not add to 100% due to rounding.
Japan and China are the world’s largest foreign holders of USD, with stockpiles of over one trillion each. These are often accumulated by purchasing U.S. Treasury bonds, a strategy for devaluing one’s domestic currency.
Because a large portion of China’s GDP is generated from exports, the country benefits when its currency, the renminbi (RMB), is weaker relative to the dollar. A relatively weak RMB means Chinese exports become cheaper than American-made goods.
How Long Will The U.S. Dollar Reign?
Today’s shifting geopolitical and economic landscape presents challenges to the U.S. dollar’s global status.
China has overtaken the U.S. as the world’s major trading partner, and is looking to leverage its power to expand the presence of the RMB. Two factors that limit the RMB’s potential as an international currency are tight government controls and a lack of transparency.
Another threat to the USD’s dominance is the use of financial sanctions, which limit foreign access to the U.S. financial system. While these sanctions may be effective from a foreign policy perspective, they can also undermine the global role of the USD.
The following chart illustrates how Russia has circumvented the U.S. dollar in the face of American sanctions.
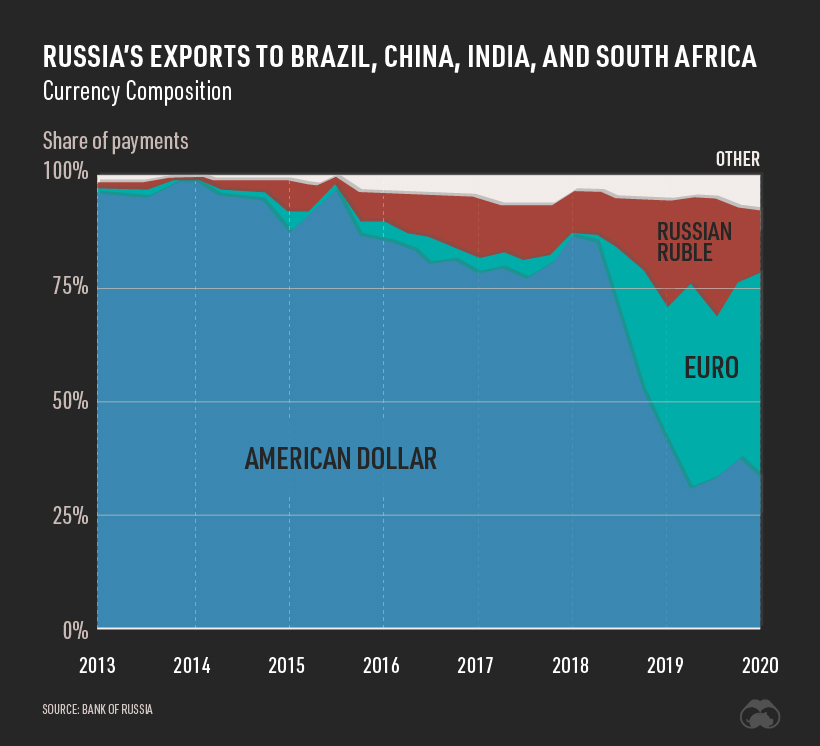
More specifically, Russia and China have been working towards a closer financial alliance. As of Q1 2020, just 45% of trade between the two nations was denominated in USD, down from 90% in late 2015.
What About Inflation?
America’s M2 money supply has grown significantly since the 2008 global financial crisis, and even more so during the COVID-19 pandemic. M2 includes cash, checking deposits, and liquid vehicles such as money market securities.
Looking forward, U.S. inflation is expected to accelerate. In August 2020, the Federal Reserve announced it would switch to an inflation-averaging policy. This means that annual inflation will be allowed to exceed 2% in a given year, so long as the 2% target is achieved over a longer timeframe.
In some respects, higher inflation can be a positive. The U.S. debt to GDP ratio is currently over 100%, and by 2050, it’s expected to reach 195%. With so much debt being issued, sustained inflation can gradually undermine the real value of these liabilities. The tradeoff, of course, is a further weakening of the U.S. dollar.


Markets in a Minute
The Top 5 Reasons Clients Fire a Financial Advisor
Firing an advisor is often driven by more than cost and performance factors. Here are the top reasons clients ‘break up’ with their advisors.

The Top 5 Reasons Clients Fire a Financial Advisor
What drives investors to fire a financial advisor?
From saving for a down payment to planning for retirement, clients turn to advisors to guide them through life’s complex financial decisions. However, many of the key reasons for firing a financial advisor stem from emotional factors, and go beyond purely financial motivations.
We partnered with Morningstar to show the top reasons clients fire an advisor to provide insight on what’s driving investor behavior.
What Drives Firing Decisions?
Here are the top reasons clients terminated their advisor, based on a survey of 184 respondents:
| Reason for Firing | % of Respondents Citing This Reason | Type of Motivation |
|---|---|---|
| Quality of financial advice and services | 32% | Emotion-based reason |
| Quality of relationship | 21% | Emotion-based reason |
| Cost of services | 17% | Financial-based reason |
| Return performance | 11% | Financial-based reason |
| Comfort handling financial issues on their own | 10% | Emotion-based reason |
Numbers may not total 100 due to rounding. Respondents could select more than one answer.
Numbers may not total 100 due to rounding. Respondents could select more than one answer.
While firing an advisor is rare, many of the primary drivers behind firing decisions are also emotionally driven.
Often, advisors were fired due to the quality of the relationship. In many cases, this was due to an advisor not dedicating enough time to fully grasp their personal financial goals. Additionally, wealthier, and more financially literate clients are more likely to fire their advisors—highlighting the importance of understanding the client.
Key Takeaways
Given these driving factors, here are five ways that advisors can build a lasting relationship through recognizing their clients’ emotional needs:
- Understand your clients’ deeper goals
- Reach out proactively
- Act as a financial coach
- Keep clients updated
- Conduct goal-setting exercises on a regular basis
By communicating their value and setting expectations early, advisors can help prevent setbacks in their practice by adeptly recognizing the emotional motivators of their clients.
Markets in a Minute
The Top 5 Reasons Clients Hire a Financial Advisor
Here are the most common drivers for hiring a financial advisor, revealing that investor motivations go beyond just financial factors.

The Top 5 Reasons Clients Hire a Financial Advisor
What drives investors to hire a financial advisor?
From saving for a down payment to planning for retirement, clients turn to advisors to guide them through life’s complex financial decisions. However, many of the key reasons for hiring a financial advisor stem from emotional factors, and go beyond purely financial motivations.
We partnered with Morningstar to show the top reasons clients hire a financial advisor to provide insight on what’s driving investor behavior.
What Drives Hiring Decisions?
Here are the most common reasons for hiring an advisor, based on a survey of 312 respondents.
| Reason for Hiring | % of Respondents Citing This Reason | Type of Motivation |
|---|---|---|
| Specific goals or needs | 32% | Financial-based reason |
| Discomfort handling finances | 32% | Emotion-based reason |
| Behavioral coaching | 17% | Emotion-based reason |
| Recommended by family or friends | 12% | Emotion-based reason |
| Quality of relationship | 10% | Emotion-based reason |
Numbers may not total 100 due to rounding. Respondents could select more than one answer.
While financial factors played an important role in hiring decisions, emotional reasons made up the largest share of total responses.
This illustrates that clients place a high degree of importance on reaching specific goals or needs, and how an advisor communicates with them. Furthermore, clients seek out advisors for behavioral coaching to help them make informed decisions while staying the course.
Key Takeaways
With this in mind, here are five ways advisors can provide value to their clients and grow their practice:
- Address clients’ emotional needs early on
- Demonstrate how you can offer support
- Use ordinary language
- Provide education to help clients stay on track
- Acknowledge that these are issues we all face
By addressing emotional factors, advisors can more effectively help clients’ navigate intricate financial decisions and avoid common behavioral mistakes.

The Top 5 Reasons Clients Fire a Financial Advisor

The Top 5 Reasons Clients Hire a Financial Advisor

Visualizing the Growth of $100, by Asset Class

How Small Investments Make a Big Impact Over Time

What Were the Top Performing Investment Themes of 2023?
-

 Infographics2 years ago
The Top Investment Quotes Every Investor Should Know
-

 Markets in a Minute2 years ago
Mapped: The Growth in U.S. House Prices by State
-

 Markets in a Minute2 years ago
How Closely Related Are Historical Mortgage Rates and Housing Prices?
-

 Infographics2 years ago
A Visual Guide to Stagflation, Inflation, and Deflation
-

 Markets in a Minute1 year ago
Mapped: Global Energy Prices, by Country in 2022
-

 Markets in a Minute2 years ago
Visualizing Historical Oil Prices (1968-2022)
-

 Infographics1 year ago
Visual Guide: The Three Types of Economic Indicators
-

 Markets in a Minute2 years ago
Mapped: Global Macroeconomic Risk, by Country in 2022
