
Markets in a Minute
Female Breadwinners Have Doubled, But Barriers Remain
This Markets in a Minute chart is available as a poster.
This Markets in a Minute chart is available as a poster.
The Rise of Female Breadwinners
Who is the higher income earner in your family?
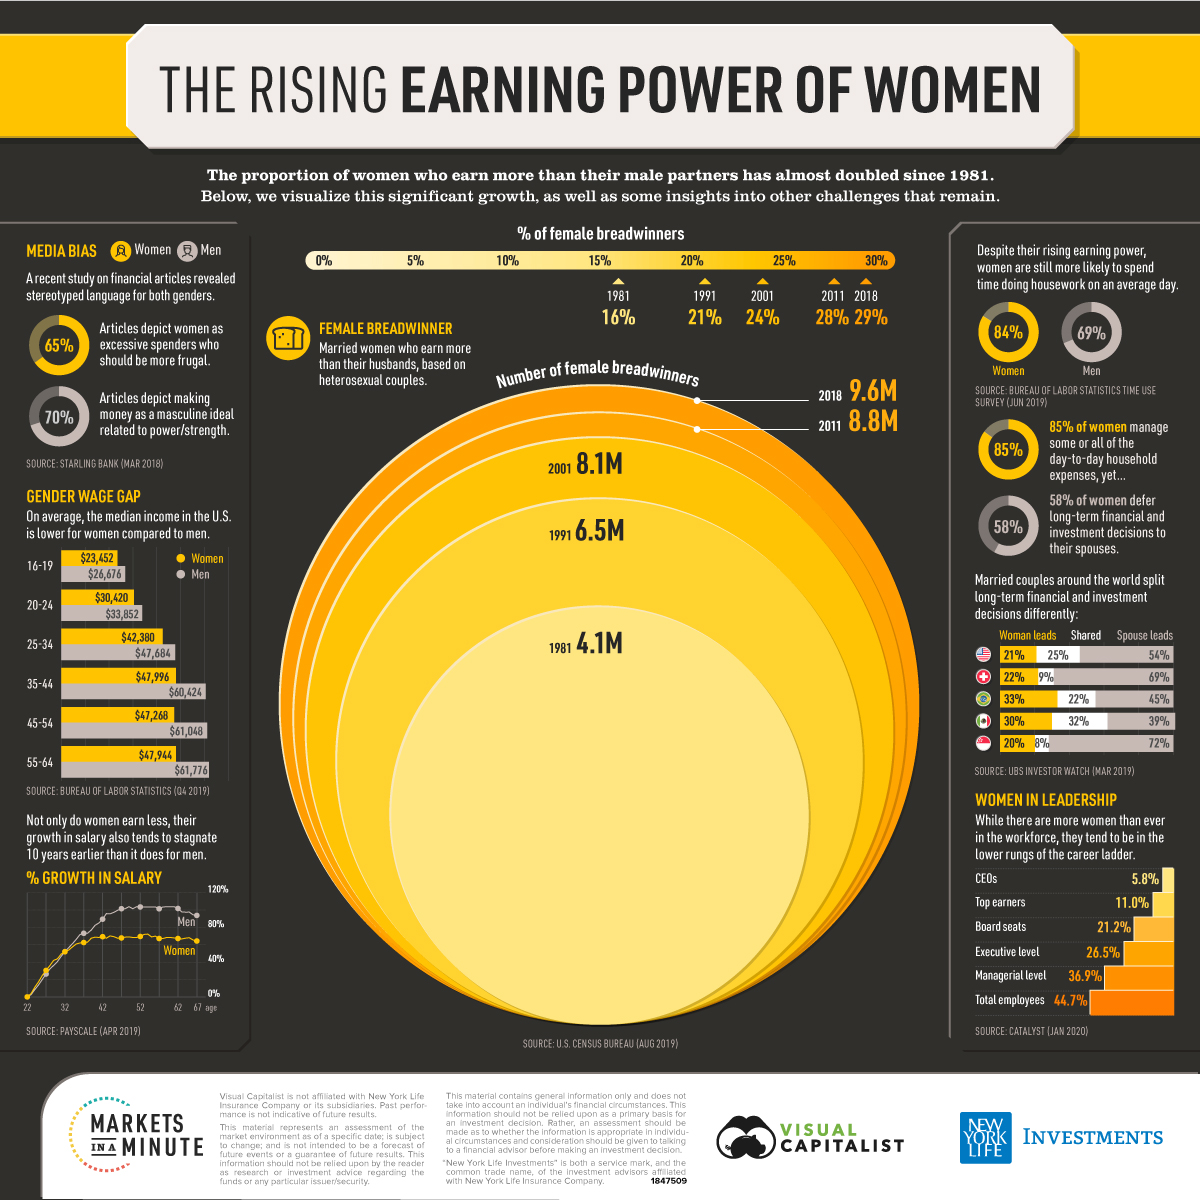
Over time, the U.S. has seen a rise in female breadwinners. In fact, the proportion of women who earn more than their male partners has almost doubled since 1981.
Today’s Markets in a Minute chart–from New York Life Investments–illustrates the historical trajectory of women’s earning power, as well as systemic challenges women still face.
Then and Now: Gaining Ground
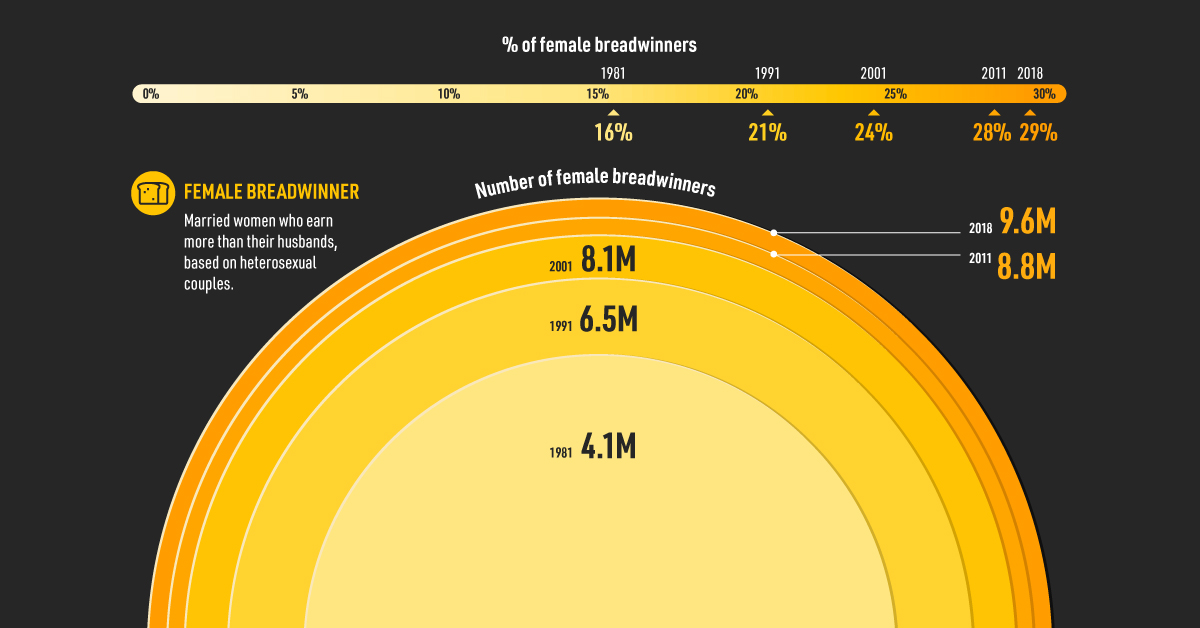
In the last 40 years, there has been considerable progress in both the percentage and number of female breadwinners.
| 1981 | 1991 | 2001 | 2011 | 2018 | |
|---|---|---|---|---|---|
| % Female Breadwinners | 16% | 21% | 24% | 28% | 29% |
| # Female Breadwinners | 4.1M | 6.5M | 8.1M | 8.8M | 9.6M |
For families that had dual incomes, only 16% of households in 1981 had a female breadwinner. This was equal to about 4 million women across the country at the time.
Fast-forward to the present, and close to 10 million married, female breadwinners were part of the U.S. labor pool in 2018.
Breakthroughs Could Link to Education
Higher education rates and rising earning power are helping to decouple women from pre-existing financial stereotypes.
For married female breadwinners*, the impact of education often plays out as follows:
| Education level | % of Women Earning Equal or More Than Partner |
|---|---|
| More education than partner | 49% |
| Same education as partner | 29% |
| Less education than partner | 20% |
Source: Pew Research Center
*Over age 25
The odds of a woman earning the same or more than her partner skyrockets nearly 250% if she has more education, compared to if she has less education.
Interestingly, when it comes to career trajectories, women and men share similar decision-making rationales. Among surveyed women, 83% were more likely to delay having kids in order to advance their careers, compared to 79% of men. The primary reason: to help secure a stronger financial standing for their future children.
While it is clear that women have become a growing financial force over time, they still face many persistent challenges today.
A Chorus of Systemic Barriers
Women experience a litany of headwinds, both overt and subtle. What are some variables that continue to have a pervasive impact on women’s finances?
Media Bias
According to one study, 65% of media language directed towards women and their finances surrounded “excessive spending”. In contrast, 70% of language towards men discussed “making money” as a masculine ideal.
Financial Well-being
According to a global survey, 85% of women manage day-to-day expenses as much as or more than their spouse. However, 58% of women defer long-term financial and investment decisions to their husbands.
Gender Wage Gap
Based on the median salary for all men and women, women earn 79 cents for every dollar men make in 2019. The gap starts small and continues to grow as people age. How can women close the gap? The Georgetown Center on Education and the Workforce has some advice:
- Get one more degree
- Pick a high-paying college major, such as the STEM fields
- Negotiate starting pay
If current earning trends continue, women will not receive equal pay until 2059.
Leadership Roles
While more women are in the workforce compared to previous generations, they tend to be in lower positions.
Women in S&P 500 Companies
| Role | Women's Representation in Role |
|---|---|
| CEOs | 5.8% |
| Top Earners | 11.0% |
| Board Seats | 21.2% |
| Executive/Senior-Level Officials and Managers | 26.5% |
| First/Mid-Level Officials and Managers | 36.9% |
| Total Employees | 44.7% |
Why are there so few women CEOs? Men dominate management roles that influence the company’s bottom line, such as COO or sales. On the other hand, female executives typically fill roles in areas like human resources or legal—which rarely lead to a CEO appointment.
The Road Ahead
The last 40 years have shown immense progress, yet there is still plenty of room for further advancement.
Women belong in all places where decisions are being made… It shouldn’t be that women are the exception.
—Ruth Bader Ginsburg, U.S. Supreme Court Justice


Markets in a Minute
The Top 5 Reasons Clients Fire a Financial Advisor
Firing an advisor is often driven by more than cost and performance factors. Here are the top reasons clients ‘break up’ with their advisors.

The Top 5 Reasons Clients Fire a Financial Advisor
What drives investors to fire a financial advisor?
From saving for a down payment to planning for retirement, clients turn to advisors to guide them through life’s complex financial decisions. However, many of the key reasons for firing a financial advisor stem from emotional factors, and go beyond purely financial motivations.
We partnered with Morningstar to show the top reasons clients fire an advisor to provide insight on what’s driving investor behavior.
What Drives Firing Decisions?
Here are the top reasons clients terminated their advisor, based on a survey of 184 respondents:
| Reason for Firing | % of Respondents Citing This Reason | Type of Motivation |
|---|---|---|
| Quality of financial advice and services | 32% | Emotion-based reason |
| Quality of relationship | 21% | Emotion-based reason |
| Cost of services | 17% | Financial-based reason |
| Return performance | 11% | Financial-based reason |
| Comfort handling financial issues on their own | 10% | Emotion-based reason |
Numbers may not total 100 due to rounding. Respondents could select more than one answer.
Numbers may not total 100 due to rounding. Respondents could select more than one answer.
While firing an advisor is rare, many of the primary drivers behind firing decisions are also emotionally driven.
Often, advisors were fired due to the quality of the relationship. In many cases, this was due to an advisor not dedicating enough time to fully grasp their personal financial goals. Additionally, wealthier, and more financially literate clients are more likely to fire their advisors—highlighting the importance of understanding the client.
Key Takeaways
Given these driving factors, here are five ways that advisors can build a lasting relationship through recognizing their clients’ emotional needs:
- Understand your clients’ deeper goals
- Reach out proactively
- Act as a financial coach
- Keep clients updated
- Conduct goal-setting exercises on a regular basis
By communicating their value and setting expectations early, advisors can help prevent setbacks in their practice by adeptly recognizing the emotional motivators of their clients.
Markets in a Minute
The Top 5 Reasons Clients Hire a Financial Advisor
Here are the most common drivers for hiring a financial advisor, revealing that investor motivations go beyond just financial factors.

The Top 5 Reasons Clients Hire a Financial Advisor
What drives investors to hire a financial advisor?
From saving for a down payment to planning for retirement, clients turn to advisors to guide them through life’s complex financial decisions. However, many of the key reasons for hiring a financial advisor stem from emotional factors, and go beyond purely financial motivations.
We partnered with Morningstar to show the top reasons clients hire a financial advisor to provide insight on what’s driving investor behavior.
What Drives Hiring Decisions?
Here are the most common reasons for hiring an advisor, based on a survey of 312 respondents.
| Reason for Hiring | % of Respondents Citing This Reason | Type of Motivation |
|---|---|---|
| Specific goals or needs | 32% | Financial-based reason |
| Discomfort handling finances | 32% | Emotion-based reason |
| Behavioral coaching | 17% | Emotion-based reason |
| Recommended by family or friends | 12% | Emotion-based reason |
| Quality of relationship | 10% | Emotion-based reason |
Numbers may not total 100 due to rounding. Respondents could select more than one answer.
While financial factors played an important role in hiring decisions, emotional reasons made up the largest share of total responses.
This illustrates that clients place a high degree of importance on reaching specific goals or needs, and how an advisor communicates with them. Furthermore, clients seek out advisors for behavioral coaching to help them make informed decisions while staying the course.
Key Takeaways
With this in mind, here are five ways advisors can provide value to their clients and grow their practice:
- Address clients’ emotional needs early on
- Demonstrate how you can offer support
- Use ordinary language
- Provide education to help clients stay on track
- Acknowledge that these are issues we all face
By addressing emotional factors, advisors can more effectively help clients’ navigate intricate financial decisions and avoid common behavioral mistakes.

The Top 5 Reasons Clients Fire a Financial Advisor

The Top 5 Reasons Clients Hire a Financial Advisor

Visualizing the Growth of $100, by Asset Class

How Small Investments Make a Big Impact Over Time

What Were the Top Performing Investment Themes of 2023?
-

 Infographics2 years ago
The Top Investment Quotes Every Investor Should Know
-

 Markets in a Minute2 years ago
Mapped: The Growth in U.S. House Prices by State
-

 Markets in a Minute2 years ago
How Closely Related Are Historical Mortgage Rates and Housing Prices?
-

 Infographics2 years ago
A Visual Guide to Stagflation, Inflation, and Deflation
-

 Markets in a Minute1 year ago
Mapped: Global Energy Prices, by Country in 2022
-

 Markets in a Minute2 years ago
Visualizing Historical Oil Prices (1968-2022)
-

 Infographics1 year ago
Visual Guide: The Three Types of Economic Indicators
-

 Markets in a Minute2 years ago
Mapped: Global Macroeconomic Risk, by Country in 2022
