
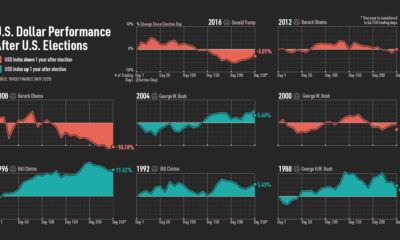

How much influence do elections have? We show U.S dollar performance after U.S. elections to illustrate there's no clear trend between the two.
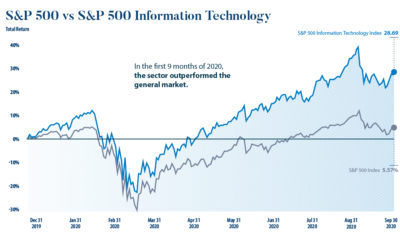

In the first 9 months of 2020, tech's return was almost 5x greater than the general market's return. Here's what you need to know about tech...
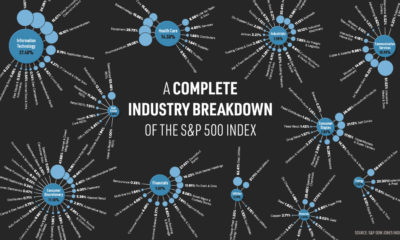

The S&P 500 is one of the most common stock indexes, but do you know how it's comprised? This chart shows all the S&P 500 sectors...


On average globally, women have three-quarters of the legal economic rights granted to men. This map shows the state of women’s economic rights around the world.
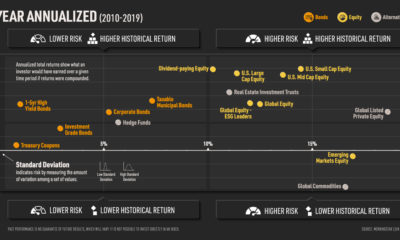

Asset allocation is one of the most important decisions an investor can make. This chart shows asset class risk and return from 2010-2019.
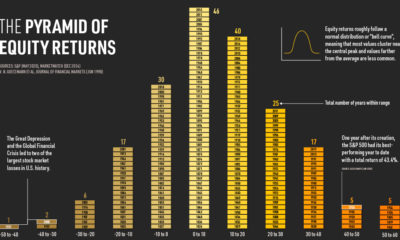

From 1825-2019, equities have had positive annual performance over 70% of the time. This chart shows historical U.S. stock market returns.
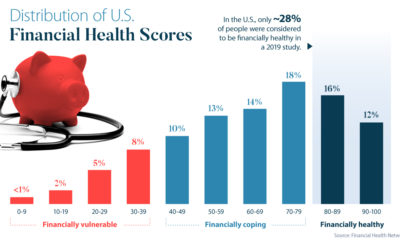

Even prior to COVID-19, only about 28% of U.S. adults were financially healthy. Here’s how you can improve your financial wellness during a crisis.
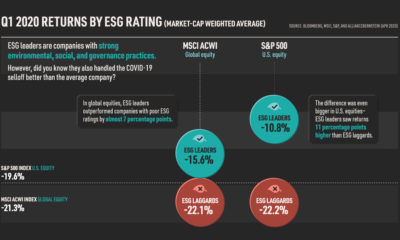

ESG investing provided downside protection during the COVID-19 selloff, with ESG leaders seeing smaller losses than the broader market and ESG laggards.
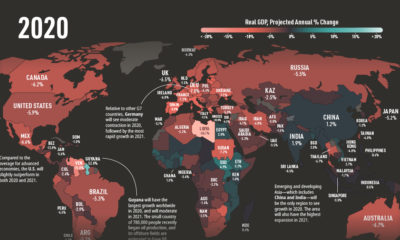

The global economy is projected to contract by 3% in 2020, followed by 5.8% growth in 2021. This animated map shows the IMF's country-level economic forecast.
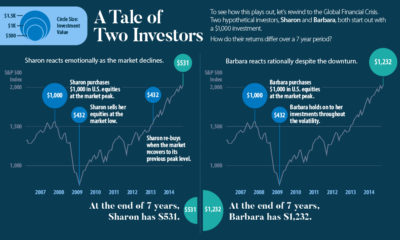

It can be tempting to sell during high market volatility, but investors who hold onto their investments historically see much greater returns.
