
Markets in a Minute
The State of Women’s Economic Rights Worldwide
This Markets in a Minute Chart is available as a poster.
This Markets in a Minute Chart is available as a poster.
The State of Women’s Economic Rights Worldwide
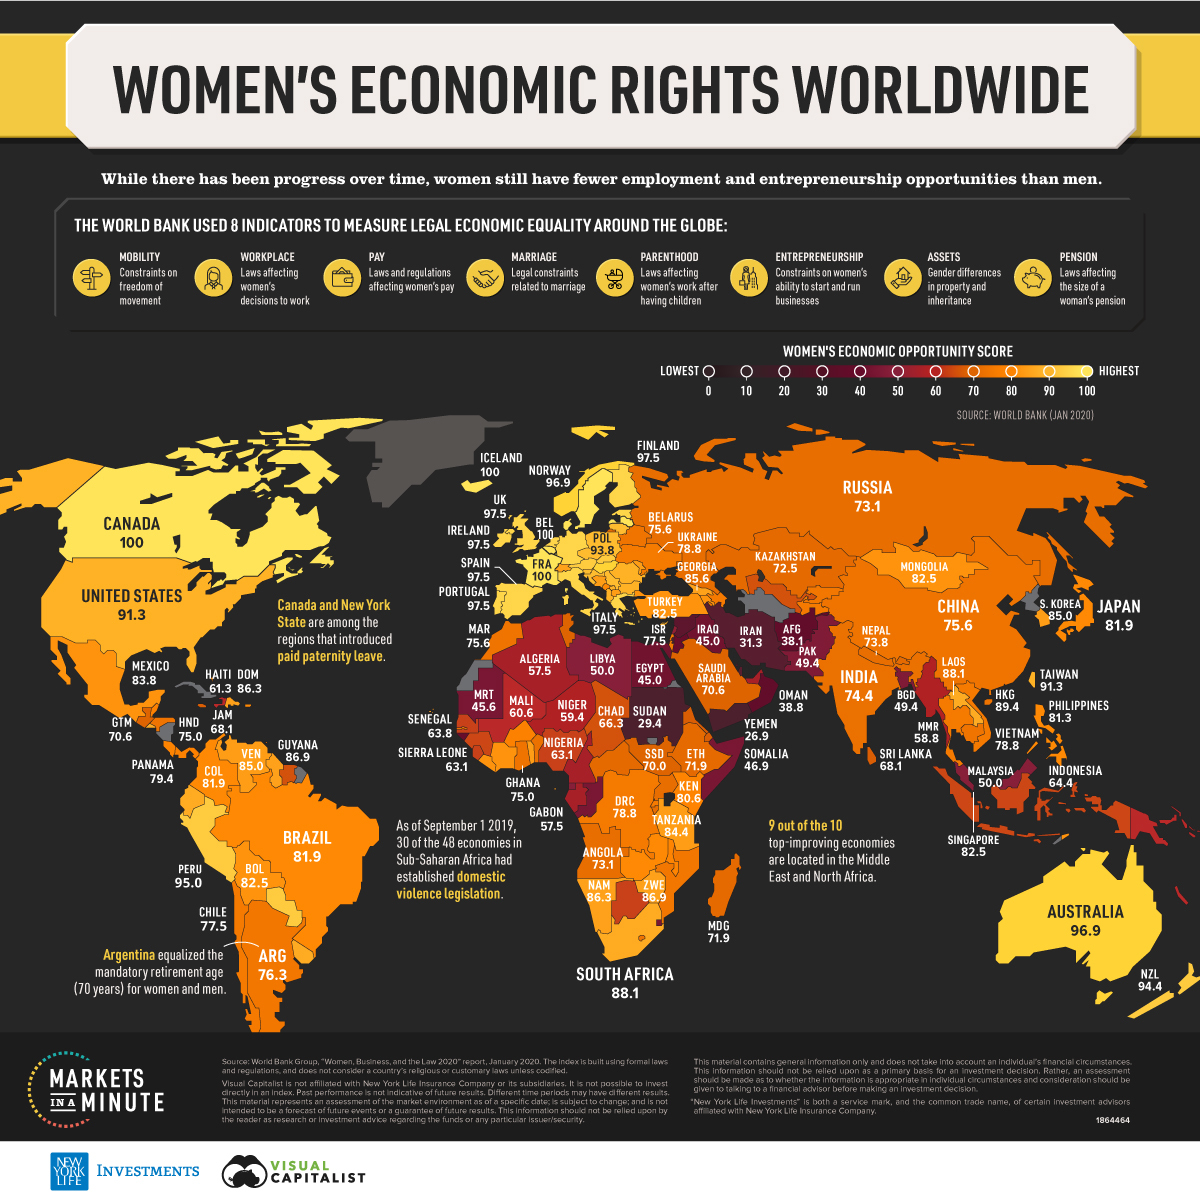
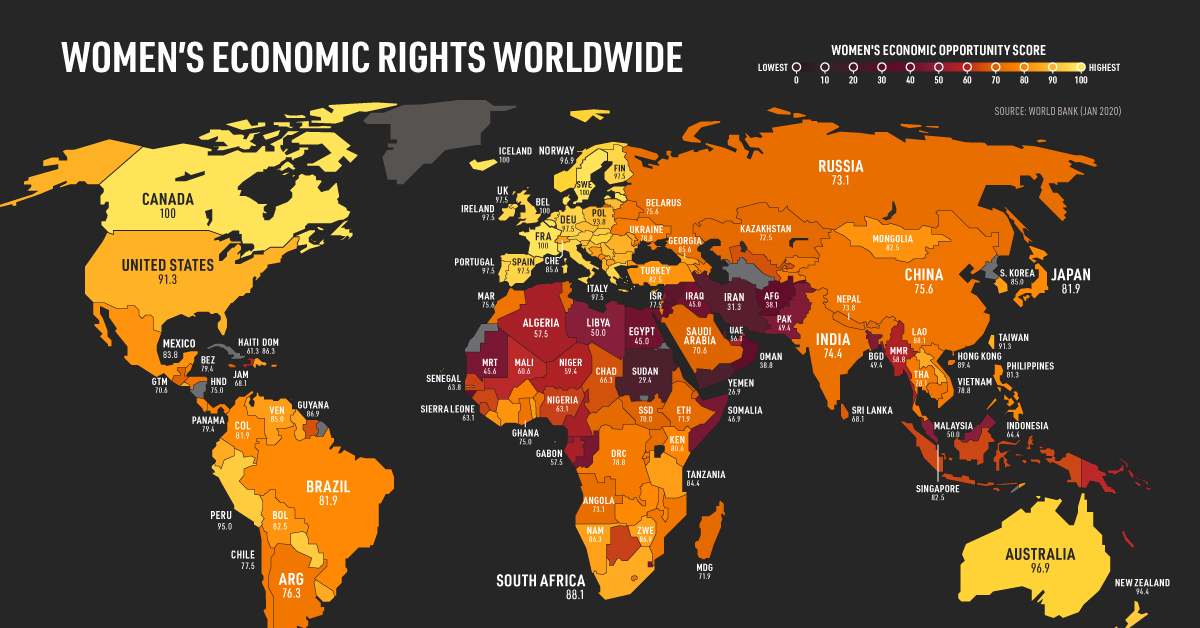
While significant progress has been made over time, women still face entrepreneurship and employment barriers. In fact, on average around the globe, women have just three-quarters of the legal economic rights granted to men.
Equal opportunities are important not only from a human rights perspective, but also from an economic perspective. When women are able to work outside the home and manage money, they are more likely to join the workforce and contribute to economic growth.
In this Markets in a Minute chart from New York Life Investments, we show the state of women’s legal economic rights around the world.
Economic Opportunity by Country
The World Bank analyzed eight metrics that affect women’s economic empowerment at various life stages: mobility, workplace, pay, marriage, parenthood, entrepreneurship, assets, and pension. For example, in places where women are able to move around freely, they are more likely to join the workforce.
To ensure comparability, women are assumed to work in the main business city of their country and in the formal sector. The formal sector refers to work with companies that contribute taxes and/or are registered with the government. It’s also worth noting that the data is based on legal rights, and religious or customary laws are not considered unless codified.
A score of 100 means that women have the same legal economic rights as men for the eight metrics measured. Here’s how each of the 190 economies stack up, sorted by score.
| Economy | Score |
|---|---|
| Belgium | 100.0 |
| Canada | 100.0 |
| Denmark | 100.0 |
| France | 100.0 |
| Iceland | 100.0 |
| Latvia | 100.0 |
| Luxembourg | 100.0 |
| Sweden | 100.0 |
| Estonia | 97.5 |
| Finland | 97.5 |
| Germany | 97.5 |
| Greece | 97.5 |
| Ireland | 97.5 |
| Italy | 97.5 |
| Netherlands | 97.5 |
| Portugal | 97.5 |
| Spain | 97.5 |
| United Kingdom | 97.5 |
| Australia | 96.9 |
| Hungary | 96.9 |
| Norway | 96.9 |
| Peru | 95.0 |
| Austria | 94.4 |
| New Zealand | 94.4 |
| Paraguay | 94.4 |
| Slovak Republic | 94.4 |
| Croatia | 93.8 |
| Czech Republic | 93.8 |
| Lithuania | 93.8 |
| Poland | 93.8 |
| Serbia | 93.8 |
| Slovenia | 93.8 |
| Kosovo | 91.9 |
| Mauritius | 91.9 |
| Albania | 91.3 |
| Cyprus | 91.3 |
| Taiwan, China | 91.3 |
| United States | 91.3 |
| Bulgaria | 90.6 |
| Romania | 90.6 |
| Ecuador | 89.4 |
| Hong Kong SAR, China | 89.4 |
| El Salvador | 88.8 |
| Malta | 88.8 |
| Uruguay | 88.8 |
| Lao PDR | 88.1 |
| South Africa | 88.1 |
| Guyana | 86.9 |
| Zimbabwe | 86.9 |
| Cabo Verde | 86.3 |
| Dominican Republic | 86.3 |
| Namibia | 86.3 |
| Nicaragua | 86.3 |
| São Tomé and Príncipe | 86.3 |
| Georgia | 85.6 |
| Switzerland | 85.6 |
| Bosnia and Herzegovina | 85.0 |
| Korea, Rep. | 85.0 |
| North Macedonia | 85.0 |
| Venezuela, RB | 85.0 |
| Moldova | 84.4 |
| Tanzania | 84.4 |
| Togo | 84.4 |
| Liberia | 83.8 |
| Mexico | 83.8 |
| St. Lucia | 83.8 |
| Côte d’Ivoire | 83.1 |
| Timor-Leste | 83.1 |
| Armenia | 82.5 |
| Bolivia | 82.5 |
| Mongolia | 82.5 |
| Singapore | 82.5 |
| Turkey | 82.5 |
| Brazil | 81.9 |
| Colombia | 81.9 |
| Japan | 81.9 |
| Montenegro | 81.9 |
| Bahamas, The | 81.3 |
| Philippines | 81.3 |
| Puerto Rico | 81.3 |
| Zambia | 81.3 |
| Grenada | 80.6 |
| Kenya | 80.6 |
| Malawi | 80.6 |
| Costa Rica | 80.0 |
| Samoa | 80.0 |
| San Marino | 80.0 |
| Belize | 79.4 |
| Burkina Faso | 79.4 |
| Fiji | 79.4 |
| Panama | 79.4 |
| Azerbaijan | 78.8 |
| Congo, Dem. Rep. | 78.8 |
| Kiribati | 78.8 |
| Tajikistan | 78.8 |
| Ukraine | 78.8 |
| Vietnam | 78.8 |
| Rwanda | 78.1 |
| Thailand | 78.1 |
| Chile | 77.5 |
| Israel | 77.5 |
| Barbados | 76.9 |
| Kyrgyz Republic | 76.9 |
| Mozambique | 76.9 |
| Argentina | 76.3 |
| Seychelles | 76.3 |
| Belarus | 75.6 |
| China | 75.6 |
| Lesotho | 75.6 |
| Morocco | 75.6 |
| Cambodia | 75.0 |
| Ghana | 75.0 |
| Honduras | 75.0 |
| Trinidad and Tobago | 75.0 |
| Benin | 74.4 |
| Gambia, The | 74.4 |
| India | 74.4 |
| Maldives | 73.8 |
| Nepal | 73.8 |
| Angola | 73.1 |
| Burundi | 73.1 |
| Russian Federation | 73.1 |
| Uganda | 73.1 |
| Kazakhstan | 72.5 |
| Bhutan | 71.9 |
| Ethiopia | 71.9 |
| Madagascar | 71.9 |
| Central African Republic | 71.3 |
| St. Kitts and Nevis | 71.3 |
| Guatemala | 70.6 |
| Saudi Arabia | 70.6 |
| South Sudan | 70.0 |
| Tunisia | 70.0 |
| Eritrea | 69.4 |
| Djibouti | 68.1 |
| Jamaica | 68.1 |
| Sri Lanka | 68.1 |
| St. Vincent and the Grenadines | 68.1 |
| Uzbekistan | 67.5 |
| Antigua and Barbuda | 66.3 |
| Chad | 66.3 |
| Suriname | 66.3 |
| Guinea | 65.0 |
| Indonesia | 64.4 |
| Botswana | 63.8 |
| Senegal | 63.8 |
| Nigeria | 63.1 |
| Sierra Leone | 63.1 |
| Dominica | 62.5 |
| Haiti | 61.3 |
| Micronesia, Fed. Sts. | 61.3 |
| Mali | 60.6 |
| Papua New Guinea | 60.0 |
| Niger | 59.4 |
| Comoros | 58.8 |
| Marshall Islands | 58.8 |
| Myanmar | 58.8 |
| Palau | 58.8 |
| Tonga | 58.8 |
| Vanuatu | 58.1 |
| Algeria | 57.5 |
| Gabon | 57.5 |
| Cameroon | 56.9 |
| Solomon Islands | 56.9 |
| United Arab Emirates | 56.3 |
| Brunei Darussalam | 53.1 |
| Lebanon | 52.5 |
| Equatorial Guinea | 51.9 |
| Libya | 50.0 |
| Malaysia | 50.0 |
| Bangladesh | 49.4 |
| Pakistan | 49.4 |
| Somalia | 46.9 |
| Bahrain | 46.3 |
| Congo, Rep. | 46.3 |
| Eswatini | 46.3 |
| Mauritania | 45.6 |
| Egypt, Arab Rep. | 45.0 |
| Iraq | 45.0 |
| Guinea-Bissau | 42.5 |
| Jordan | 40.6 |
| Oman | 38.8 |
| Afghanistan | 38.1 |
| Syrian Arab Republic | 36.9 |
| Kuwait | 32.5 |
| Qatar | 32.5 |
| Iran, Islamic Rep. | 31.3 |
| Sudan | 29.4 |
| Yemen, Rep. | 26.9 |
| West Bank and Gaza | 26.3 |
Data as of September 1, 2019.
Following the introduction of paid paternity leave, Canada joined seven other countries that have a perfect score of 100. Paid leave for fathers contributes positively to women’s economic opportunity as it allows childcare responsibilities to be distributed more evenly.
At the other end of the spectrum, economies in the Middle East and North Africa had the lowest scores, with women having only half of the economic rights granted to men. However, these regions have also seen their scores improving the most.
For example, Saudi Arabia was the top-improving economy, more than doubling its score from 31.8 in 2017 to 70.6 in 2019. The country exacted reforms that had an impact on six out of the eight metrics. The amendments included allowing women to travel abroad without the approval of a male guardian, and changes that prohibit employment discrimination.
A Force for Good, and Economic Growth
All regions have improved their scores, but most countries still need further legal reform to put women on an equal economic footing with men. Doing so will have important socioeconomic implications. For instance, greater equality of economic opportunity is correlated with a reduction in the wage gap, increasing women’s earning power.
It also has positive economic outcomes. One study published in the Harvard Business Review found that when more women joined the workforce, they helped make cities more productive and increased real wages for both women and men.
As investors pursue geographic areas with economic growth potential, they may want to consider countries that are making the biggest strides for women’s economic rights.


Markets in a Minute
The Top 5 Reasons Clients Fire a Financial Advisor
Firing an advisor is often driven by more than cost and performance factors. Here are the top reasons clients ‘break up’ with their advisors.

The Top 5 Reasons Clients Fire a Financial Advisor
What drives investors to fire a financial advisor?
From saving for a down payment to planning for retirement, clients turn to advisors to guide them through life’s complex financial decisions. However, many of the key reasons for firing a financial advisor stem from emotional factors, and go beyond purely financial motivations.
We partnered with Morningstar to show the top reasons clients fire an advisor to provide insight on what’s driving investor behavior.
What Drives Firing Decisions?
Here are the top reasons clients terminated their advisor, based on a survey of 184 respondents:
| Reason for Firing | % of Respondents Citing This Reason | Type of Motivation |
|---|---|---|
| Quality of financial advice and services | 32% | Emotion-based reason |
| Quality of relationship | 21% | Emotion-based reason |
| Cost of services | 17% | Financial-based reason |
| Return performance | 11% | Financial-based reason |
| Comfort handling financial issues on their own | 10% | Emotion-based reason |
Numbers may not total 100 due to rounding. Respondents could select more than one answer.
Numbers may not total 100 due to rounding. Respondents could select more than one answer.
While firing an advisor is rare, many of the primary drivers behind firing decisions are also emotionally driven.
Often, advisors were fired due to the quality of the relationship. In many cases, this was due to an advisor not dedicating enough time to fully grasp their personal financial goals. Additionally, wealthier, and more financially literate clients are more likely to fire their advisors—highlighting the importance of understanding the client.
Key Takeaways
Given these driving factors, here are five ways that advisors can build a lasting relationship through recognizing their clients’ emotional needs:
- Understand your clients’ deeper goals
- Reach out proactively
- Act as a financial coach
- Keep clients updated
- Conduct goal-setting exercises on a regular basis
By communicating their value and setting expectations early, advisors can help prevent setbacks in their practice by adeptly recognizing the emotional motivators of their clients.
Markets in a Minute
The Top 5 Reasons Clients Hire a Financial Advisor
Here are the most common drivers for hiring a financial advisor, revealing that investor motivations go beyond just financial factors.

The Top 5 Reasons Clients Hire a Financial Advisor
What drives investors to hire a financial advisor?
From saving for a down payment to planning for retirement, clients turn to advisors to guide them through life’s complex financial decisions. However, many of the key reasons for hiring a financial advisor stem from emotional factors, and go beyond purely financial motivations.
We partnered with Morningstar to show the top reasons clients hire a financial advisor to provide insight on what’s driving investor behavior.
What Drives Hiring Decisions?
Here are the most common reasons for hiring an advisor, based on a survey of 312 respondents.
| Reason for Hiring | % of Respondents Citing This Reason | Type of Motivation |
|---|---|---|
| Specific goals or needs | 32% | Financial-based reason |
| Discomfort handling finances | 32% | Emotion-based reason |
| Behavioral coaching | 17% | Emotion-based reason |
| Recommended by family or friends | 12% | Emotion-based reason |
| Quality of relationship | 10% | Emotion-based reason |
Numbers may not total 100 due to rounding. Respondents could select more than one answer.
While financial factors played an important role in hiring decisions, emotional reasons made up the largest share of total responses.
This illustrates that clients place a high degree of importance on reaching specific goals or needs, and how an advisor communicates with them. Furthermore, clients seek out advisors for behavioral coaching to help them make informed decisions while staying the course.
Key Takeaways
With this in mind, here are five ways advisors can provide value to their clients and grow their practice:
- Address clients’ emotional needs early on
- Demonstrate how you can offer support
- Use ordinary language
- Provide education to help clients stay on track
- Acknowledge that these are issues we all face
By addressing emotional factors, advisors can more effectively help clients’ navigate intricate financial decisions and avoid common behavioral mistakes.

The Top 5 Reasons Clients Fire a Financial Advisor

The Top 5 Reasons Clients Hire a Financial Advisor

Visualizing the Growth of $100, by Asset Class

How Small Investments Make a Big Impact Over Time

What Were the Top Performing Investment Themes of 2023?
-

 Infographics2 years ago
The Top Investment Quotes Every Investor Should Know
-

 Markets in a Minute2 years ago
Mapped: The Growth in U.S. House Prices by State
-

 Markets in a Minute2 years ago
How Closely Related Are Historical Mortgage Rates and Housing Prices?
-

 Infographics2 years ago
A Visual Guide to Stagflation, Inflation, and Deflation
-

 Markets in a Minute1 year ago
Mapped: Global Energy Prices, by Country in 2022
-

 Infographics3 years ago
The 5 Fastest Growing Industries of the Next Decade
-

 Markets in a Minute2 years ago
Visualizing Historical Oil Prices (1968-2022)
-

 Infographics1 year ago
Visual Guide: The Three Types of Economic Indicators
